Weekly Market Overview
I am back after a nice work/personal trip across the pond to London. I must say I think London is one of the world’s most intriguing and interesting cities out there. There is something for everyone. If you haven’t had a chance to go I would suggest it…

Let’s jump into last week’s market review and look ahead to this week…
The bears gave the bulls a nice beat down this past week and as we outlined in last Sunday’s plan looking at the weekly overview we said…
Let’s discuss some key levels for this week and even through the rest of this month as they could be major levels for support or resistance. 4450-4440 is extremely important for the bulls to begin taking control back. Lots of importance at this zone for many reasons, but if the bears push price below this zone more than likely we will see a lower low than August’s low - potentially targeting 4400.
The bulls couldn’t overtake that critical 4450 pivot and failed Monday, Tuesday, and then Wednesday at this level. If you are not zooming out and looking at multiple timeframes you missed this then. If you clearly look at the charts this was easy and with the levels I provided we sold right into a few key critical levels where we consolidated and faded further down. You could have traded without my daily plans just focusing on these key monthly levels…
Some housekeeping…our team has been crushing the levels. This week I plan to pull the trigger on a monthly or yearly subscription cost. Prices will not go above $19.99 a month and if you subscriber yearly you will save even more. As you will see in our past trade plans, available for all to go back and review, we do an extremely good job on nailing these trade plans and the key levels to react and trade. For this work and effort I think it is only fair to be compensated. Let’s hope to see you all still here after this switchover.
This weeks key news catalysts are a slew of data points starting Tuesday with Consumer Confidence and New Home Sales. On Wednesday we have Durable Goods Orders and then Thursday we have the GDP, Pending Home Sales and FED Chair Powell speaks. We wrap up the week on Friday with Core PCE and Consumer Sentiment and Inflation Expectations.
I have updated our key levels I am looking towards the rest of this month. The first key level if you are bullish is that we need to hold 4309 - which is June’s value area low - VAL. If we break this area and don’t come back to take it, it will be more disastrous to the bulls as price will start to seek 4230. Thus the bulls want to hold this level and begin pushing price up back towards 4368 then 4401 where a gap will be filled. I personally think we break below this level and hunt 4230, but let’s not predict and instead react right?
For the bears they want to continue pressing down below 4300 to target 4232 (gap fill) and where we have our trendline from October 2022 and May 2023 lows. Below this we target 4214 and then we get some interesting levels at 4190-4180. The 200sma sits here and May’s value area high - VAH. We lose these levels we target 4125.
Additionally, the 4326-4292 level has about $26B of dark pool prints. You can say this zone if more accumulation occurs will dictate the next leg and trend.
Let’s discuss some important levels that I will be keeping an eye out for this month…
Above Spot:
4368 - this is June’s POC - point of control
4417 - this is August’s VAL - value area low on the volume profile.
4424 - Septembers VAL - still forming and this range could continue to change and dynamically go up or down
4452 - Septembers POC - still forming and could change as we go through the month
4458 - this is June’s VAH on the volume profile. While we broke below this we did come back strong this week to push back above it. It becomes an important level we follow
4482 - the VAH of last weeks - 9/11 - value area high
4494 - Septembers VAH - value area high - still forming and will change as we go through the month
4516 - this is August’s POC - point of control on the volume profile. We are trading below this level and closed below it at 4515 on Friday.
Below Spot:
4309 - this is June’s VAL - value area low - we lose this and we get 4250-4200 pretty fast then. Why? There is not a lot of volume in this area that pushed price up so it will rip down pretty fast then
4232 - gap fill from 6/1 AND where our bull/up trendline from the lows of October 2022 and March 2023
4214 - this is August 2022’s VAH - value area high
4190 - 200sma on daily chart
4180 - this is May’s VAH - value area high
4125 - this is May’s POC - point of control - hasn’t been breached
4095 - this is May’s VAL - value area low - hasn’t been breached
With that, let’s jump into the trade plan.
SPX/SPY/ES Intraday Overview (TL;DR)
Monday coming up and another Monday with no news catalyst. As I stated in last Tuesday’s trading plan, Monday’s are acting like consolidation days for the rest of the week and I would treat it as such until that trend breaks. We could in other words chop around to be ready for this…
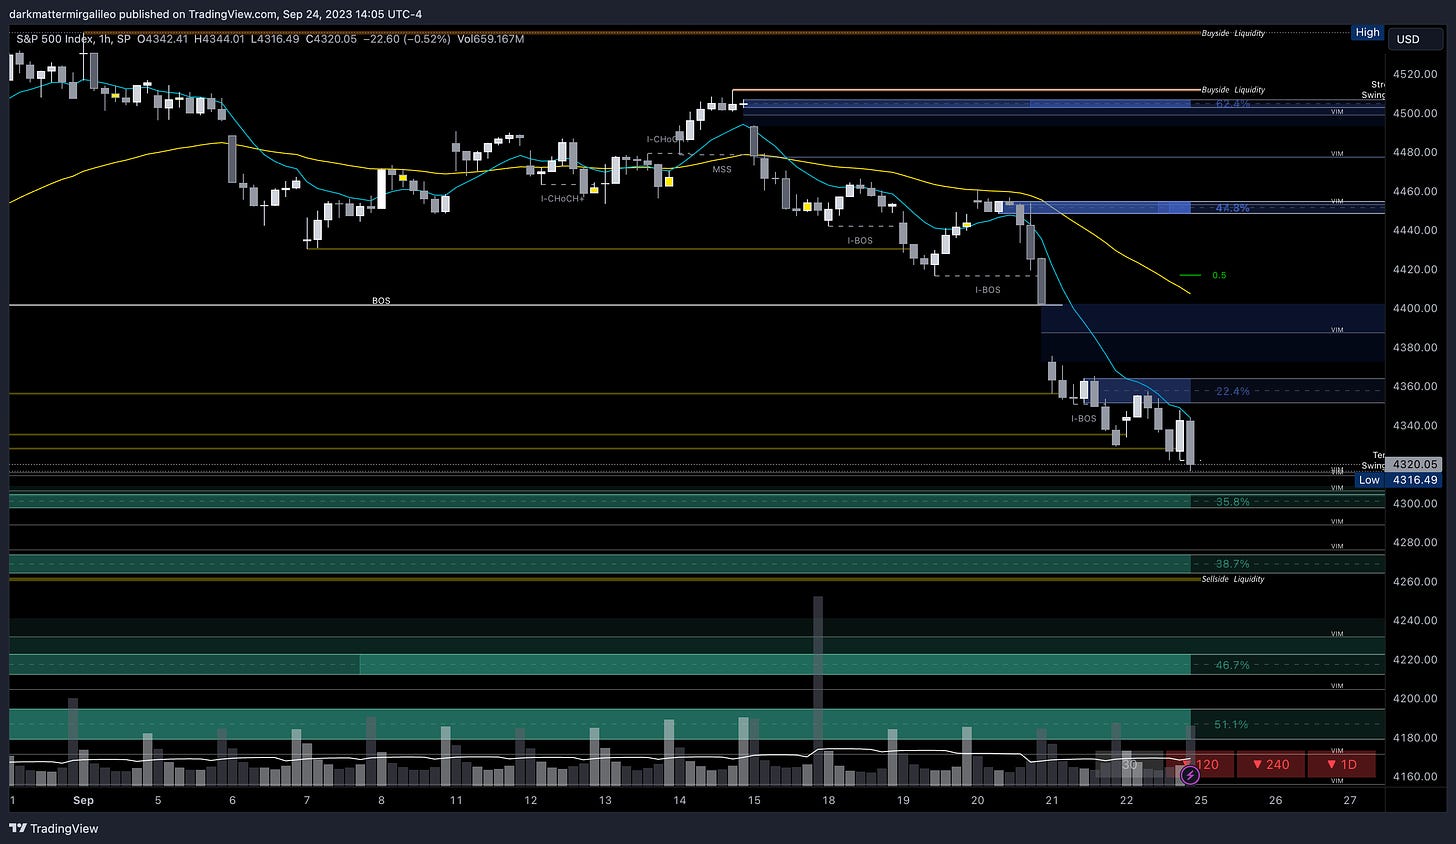
Bulls want to keep price above 4325 to target 4335 and IF we break and hold 4335 target 4350.
Bears want to defend 4335 and a failed breakout there will target 4320. Below we target 4300 then 4290.
For intraday updates please follow me on Twitter @DarkMatterTrade.
News Catalyst
No major news catalyst.
For more information on news events, visit the Economic Calendar
9/25 - SPX/ES/SPY Trade Plan
Bullish bias:
Above 4325 target 4335
If there is a failed breakdown of 4320 target 4335
If VIX continues going down then a breakout of 4335 targets 4350
Bearish bias:
Below 4320 target 4300
If there is a failed breakout of 4335 target 4320
If VIX continues going up then a breakdown of 4300 targets 4290
As always keep an eye on Volland30, VOLD indicator, and the VIX for trend continuation or reversals.
Remember you can use this SPX trade plan to trade ES or SPY. ES value is approx. 41pts more than the SPX levels shared. To get SPY levels simply take the SPX levels and divide by 10.03.
SPX - The Why Behind the Plan
Key Levels
Above Spot:
4325 - negative vanna
4335 - negative vanna
4350 - negative vanna
4348-4354 - OB (30min chart)
4350 midline
4351-4364 - OB (1hr chart)
4357 midline
4344-4349 - 433.19-433.65 - $9.39B
4370-4375 - negative vanna
4375-4384 - 436.20-437.18 - $26.53B
4395 - negative vanna
4394-4412 - 438.09-439.97 - $20.10B
4405-4410 - negative vanna
Below Spot:
4320 - negative vanna
4300 - negative vanna
4304-4297 - OB (1hr chart)
4301 midline
4326-4292 - 431.37-427.92 - $26.94B
4290-4280 - negative vanna
4270 - negative vanna
4276-4263 - OB (4hr chart)
4270 midline
4235 - negative vanna
4215-4210 - negative vanna
Dark Pool Levels
The last day of this past week’s trading session brought a lot of dark pool prints - totaling $8.48B on the day at 4326 (431.37) and 4316 (430.38). The 4326-4292 level has about $26B of dark pool prints. You can say this zone if more accumulation occurs could be where we hold and will dictate the next leg and trend.
Above Spot:
4344-4349 - 433.19-433.65 - $9.39B
4375-4384 - 436.20-437.18 - $26.53B
4394-4412 - 438.09-439.97 - $20.10B
4440-4446 - 442.73-443.32 - $12.10B
4461-4472 - 444.82-445.91 - $11.87B
4474-4487 - 446.16-447.44 - $14.76B
4494-4503 - 448.07-449.03 - $14.70B
4514-4523 - 450.12-451.03 - $16.16B
4577-4590 - 456.43-457.64 - $10.38B
Below Spot:
4326-4292 - 431.37-427.92 - $26.94B
4214-4188 - 420.16-417.60 - $18.8B
I get my dark pool levels from Quant Data. How you want to view these levels is potential magnets. A lot of consolidation will happen at these levels so when we are trading away from one level price will then target the next area of interest whales have.
Orderblocks (OB) and Fair Value Gaps (FVG)
These are smart money concepts and some areas I am looking to see how price reacts. I will give higher credence to OB’s whereas FVG’s could be areas of basing/consolidation if they break. I use Sonarlab’s indicator on Tradingview to plot these.
Resistance levels - at these levels I want to see if price rejects to short or consolidates for a push up. I couple this data with Volland, intraday option flows, and Dark Pool levels. Higher timeframe OB’s or FVG will be harder to break. OB’s are the stronger levels over FVG’s.
4348-4354 - OB (30min chart)
4350 midline
4351-4364 - OB (1hr chart)
4357 midline
4442-4466 - OB (4hr chart)
4453 midline
4478-4511 - OB (1D chart)
4495 midline
4502-4507 - OB (2hr chart)
4504 midline
4510-4516 - OB (1hr, 2hr chart)
4508 midline
4572-4582 - OB (2hr, 4hr chart)
4577 midline
4573-4594 - OB (1D chart)
4584 midline
Support levels - at these levels I want to see if price rejects to long or consolidates for a push down. I couple this data with Volland, intraday option flows, and Dark Pool levels. Higher timeframe OB’s or FVG will be harder to break. OB’s are the stronger levels over FVG’s.
4304-4297 - OB (1hr chart)
4301 midline
4276-4263 - OB (4hr chart)
4270 midline
4195-4166 - OB (2hr chart)
4180 midline
4165-4143 - OB (2hr chart)
4155 midline
4132-4103 - OB (1D chart)
4118 midline
Weekly Option Expected Move
SPX’s weekly option expected move is ~83.89 points. SPY’s expected move is ~8.44. That puts us at 4403.94 to the upside and 4236.16 to the downside. For SPY these levels are 438.86 and 421.98.
Remember over 68% of the time price will resolve it self in this range by weeks end.
Volland Data
For a better understanding of the various greeks below I would suggest you visit the Volland YouTube Page. Volland provides unique data showing where dealers are positioned providing in my opinion a higher degree of conviction to where price may move to.
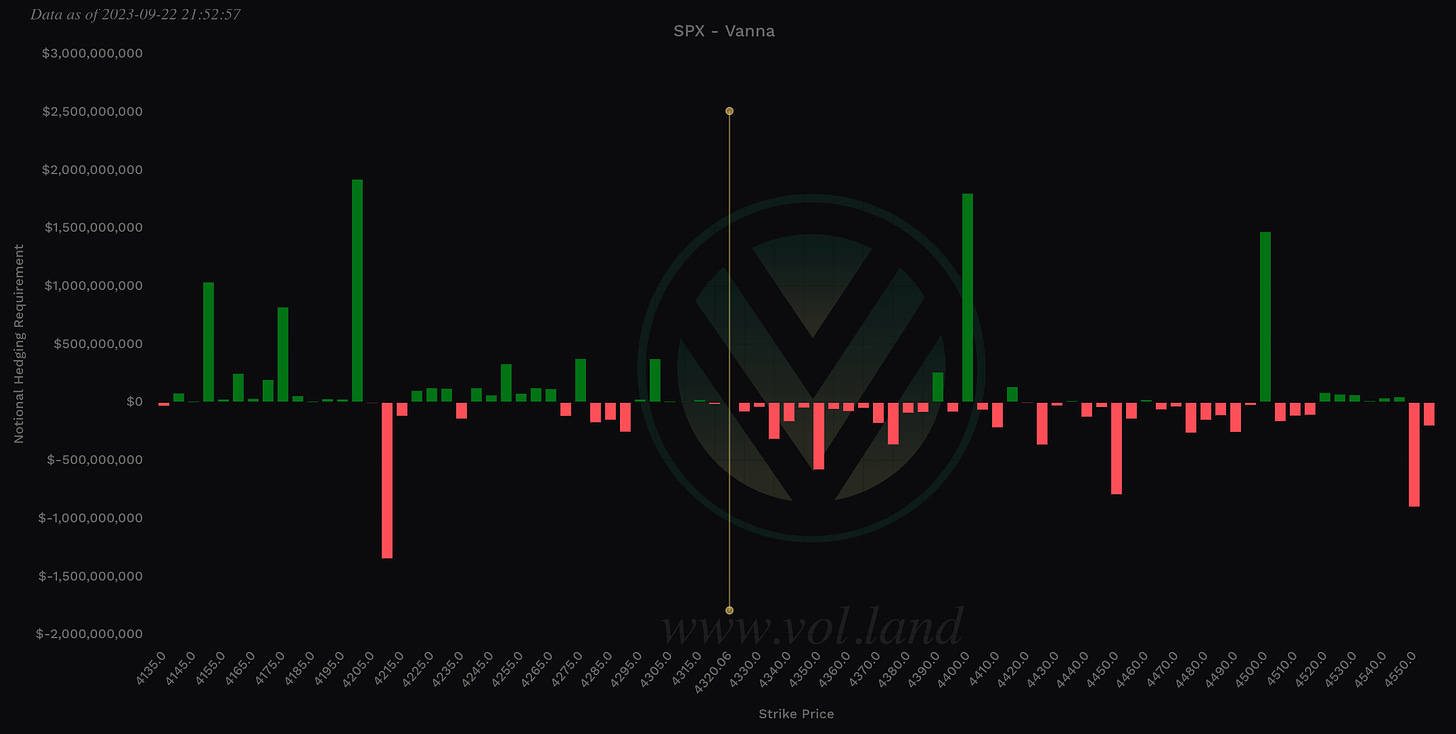
Vanna - Levels where price may repel or act as magnet
Remember for price to go above spot through a magnet or repellent VIX and IV must decrease or stay flat. For price to go below spot through a magnet or repellent VIX and IV must increase.
Positive vanna - will act as magnet
Negative vanna - will act as repellent
When price goes through a positive or negative level it will flip it - ie negative becomes positive and vice versa.
Above Spot:
4325-4385 - negative vanna
4325 - negative vanna
4335 - negative vanna
4350 - negative vanna
4370-4375 - negative vanna
4395 - negative vanna
4405-4410 - negative vanna
Below Spot:
4320 - negative vanna
4300 - negative vanna
4290-4280 - negative vanna
4270 - negative vanna
4235 - negative vanna
4215-4210 - negative vanna
Gamma
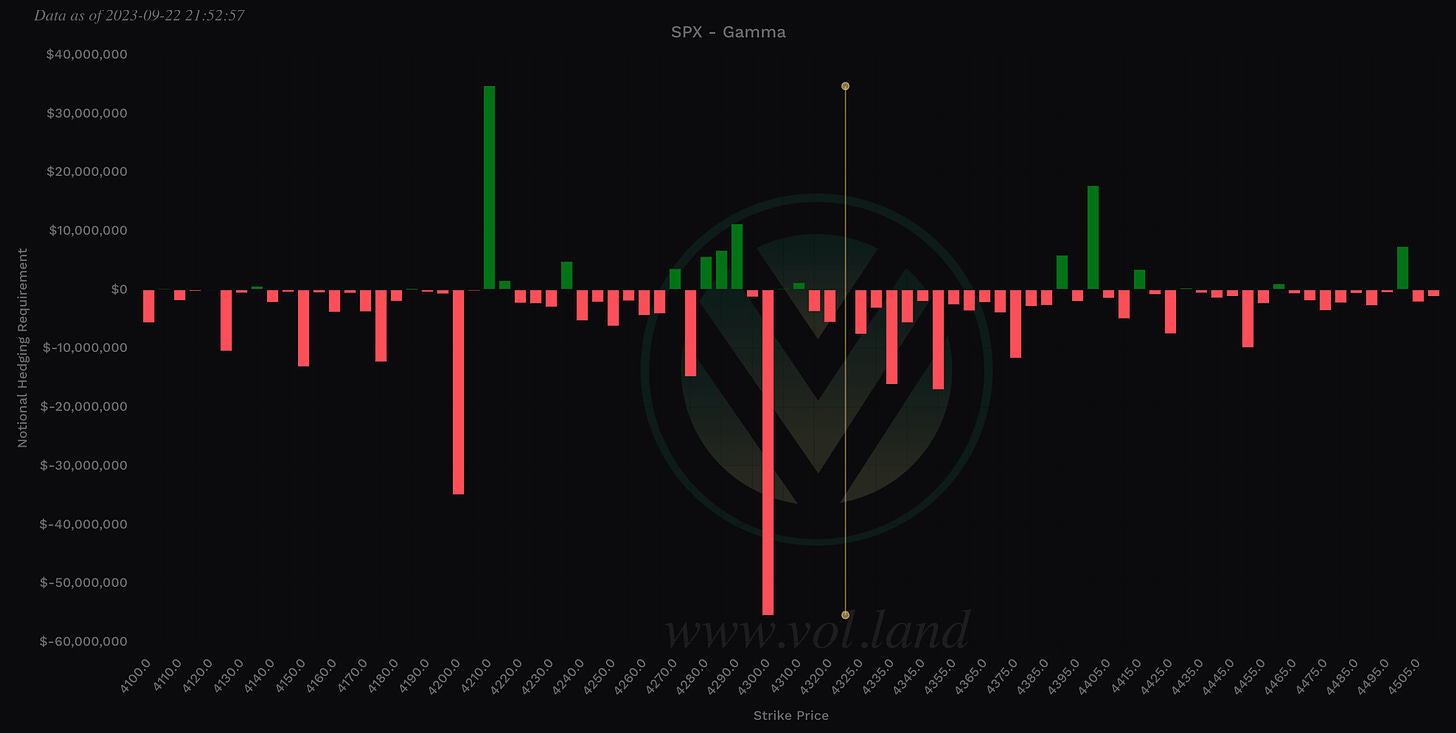
Positive Gamma Above Spot - acts as resistance
Positive Gamma Below Spot - acts as support
Negative Gamma - becomes permissive to price as it moves there - aka neither resistance nor support - simply just chillin and watching what’s happening…
Above Spot:
4390 - positive gamma
4400 - positive gamma
4415 - positive gamma
4460 - positive gamma
Below Spot:
4310 - positive gamma
4290-4280 - positive gamma
4270 - positive gamma
4235 - positive gamma
4215-4210 - positive gamma
Charm
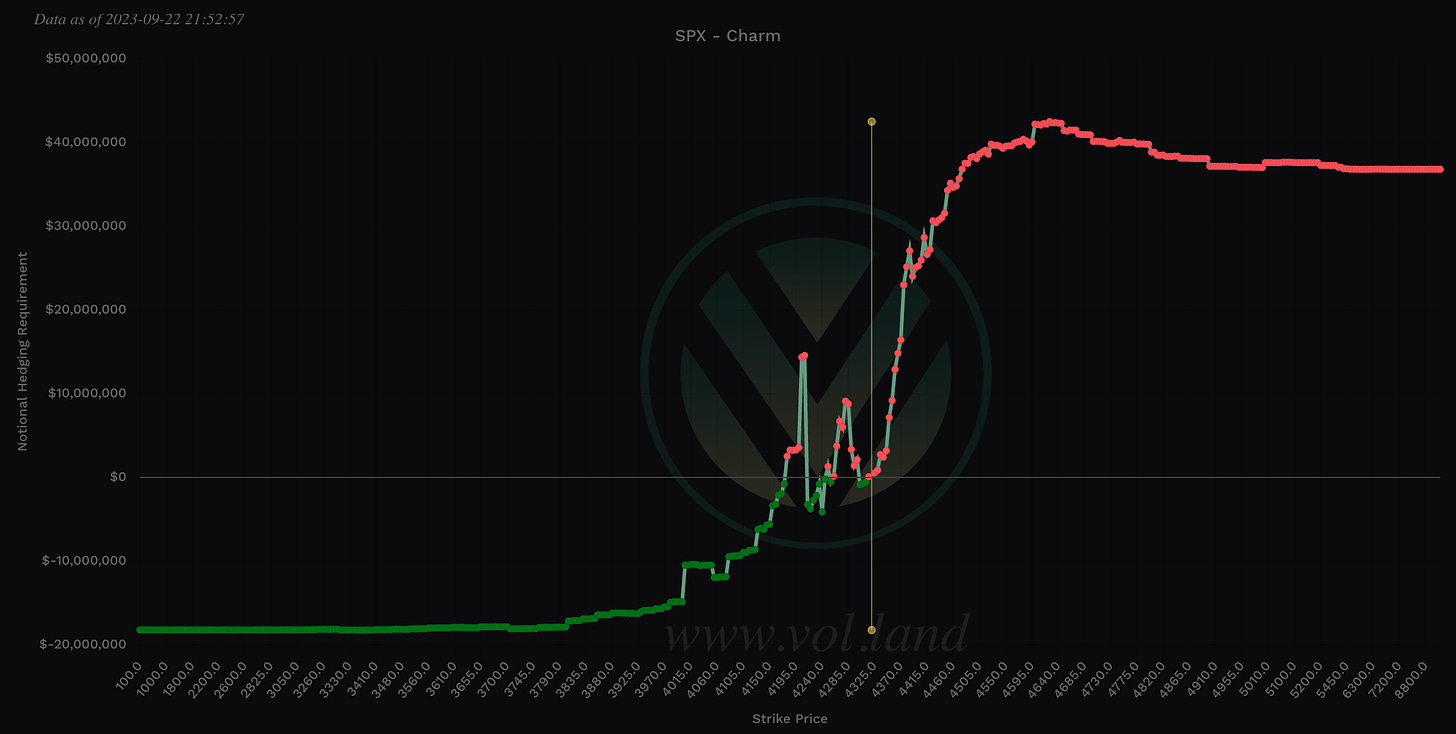
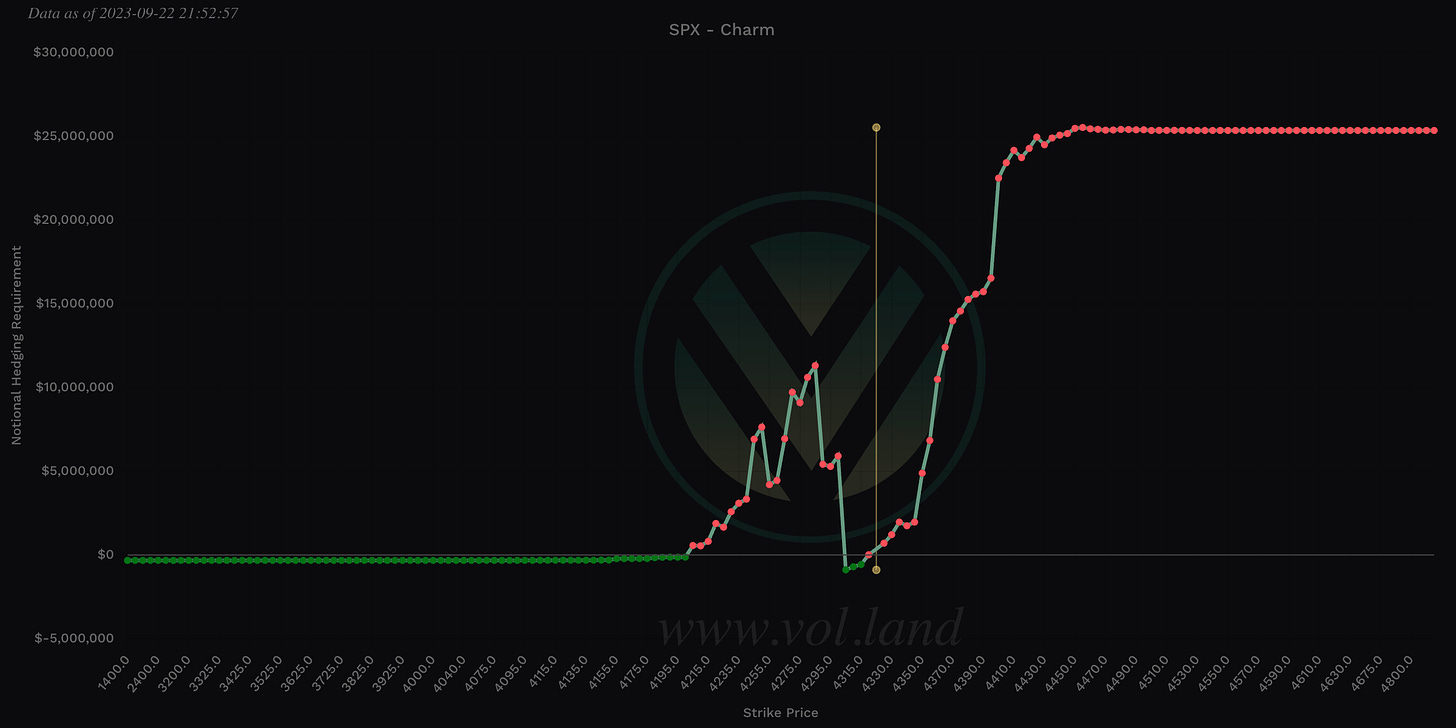
Looking at charm’s aggregate view the market is still in a bearish trend so rallies could be sold. Until we see this total notional value turn negative - take the far left value and subtract from the far right value - then we need to be careful with longs. I will be keeping a close eye on Charm going forward…
Charm’s 0DTE view on SPX looks bearish as well. Remember, total positive notional value is bearish. This value can change as we start the overnight session and then the beginning of the regular trading hours.
To cover our basis…
Welcome to my Substack where I provide a daily SPX trading plan to help guide my intraday trading. The purpose of this letter is not to advice you on your trading or investment decisions. I am simply documenting my daily trading plan for myself to help with planning and execution. These are simply my opinions and the data sourced from the likes of vol.land, TradingView, Quant Data and others. The stock market is risky, gains are not guaranteed. This is not about getting rich quick, but learn to educate yourself and make the necessary financial decisions on your own. This is not financial advice.


