October 28 - ES Weekly Market Insights: Dealer Positions & Volume Profile Analysis!
Welcome to another weekly overview where we provide you with key levels to enter and target
Hello fellow traders. Welcome to another weekly overview of the ES/SPX/SPY market.
As a reminder we have officially partnered with Volland - available at https://vol.land - providing our weekly and daily ES/SPX analysis to subscribers there.
Get our weekly and daily plans while also learning how to use dealer positions to have better trading success.
Remember use promo code DARKMATTER10 to get 10% off your first month at Volland.
A slew of earnings continues this week and we have geopolitics, election, and much more so let's jump into it.
Before we kick into this week let's review what we said last week - I do this not to show my analysis right/wrong - I do this to learn from it. What did we get right and what didn't we get right?
10/21 - Weekly Recap:
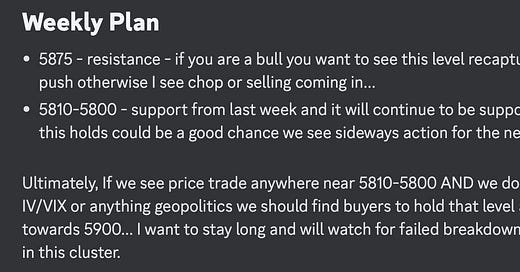
Our 5875 resistance callout was right and we knew we couldn't be outright bullish unless we got above this level and that's exactly what we got...
The 5800 level finally cracked and it lead to a quick 40pt sell that was immediately bought up. Which you could have gone long there with the adjustment in the vanna data in Volland or you could have taken our failed breakdown of 5800 trade which yielded you almost 60pts from that reversal
So I hope you are learning from these trade plans - the levels will continue to be important - even if we go above/below them. They were critical at one point and will be critical going forward. Our weekly and daily vanna levels showed us this where the majority of the volume and $$$'s were at these key critical levels all week.
Market Moves with Volland
Don't forget to join Wiz and myself in our weekly installment of the "Market Moves with Volland." You can set a notification and join us live at 8:30am est on YouTube - https://www.youtube.com/live/SpxDZ9ztqfc?si=y0PPHC38lmBNDw4y
Andrew will be joining us again and we will be going through this weeks overview of the SPX, but will be providing you with a look into key earnings reports for this week.
News Catalyst Preview
* Mon - no events
* Tue - US Case Shiller House Price Index, UK Monetary Policy Report Hearings, US Consumer Confidence, JOLTS Job Openings
* Wed - US ADP Non-Farm Employment Change, US GDP, US Pending Home Sales
* Thur - BOJ Press Conference, EU CPI, US PCE, US Unemployment Claims, US Employment Cost Index q/q
* Fri - US Non-Farm Employment Change, US Unemployment Rate, US Avg Hourly Earnings m/m, US Manufacturing PMI & Prices
Earnings
We have the continuation of Q3 earnings this week and we have some big ones on deck. Some notable companies providing their earnings this week include GOOGL, AAPL, AMZN, META, MSFT, INTL, COIN, AMD, F, V, MA and many more...
Weekly Options Expected Move
SPX’s weekly option expected move is ~107.75 points. That puts us at 5915.86 to the upside and 5700.36 to the downside.
Remember over 68% of the time price will resolve it self in this range by weeks end.
# Vanna Overview
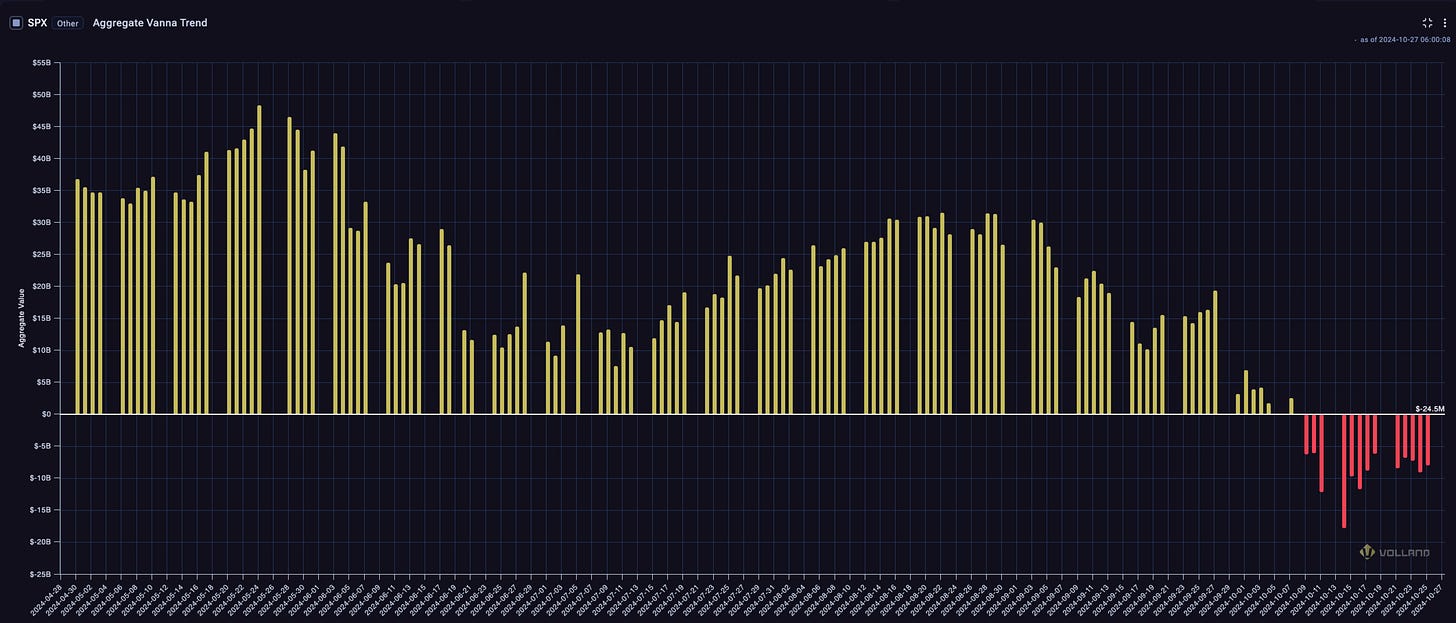
Aggregate vanna continues to consolidate and just stay negative - which has been one of the reason the market has not been able to rise as much on positive news - think of TSLA ER's.
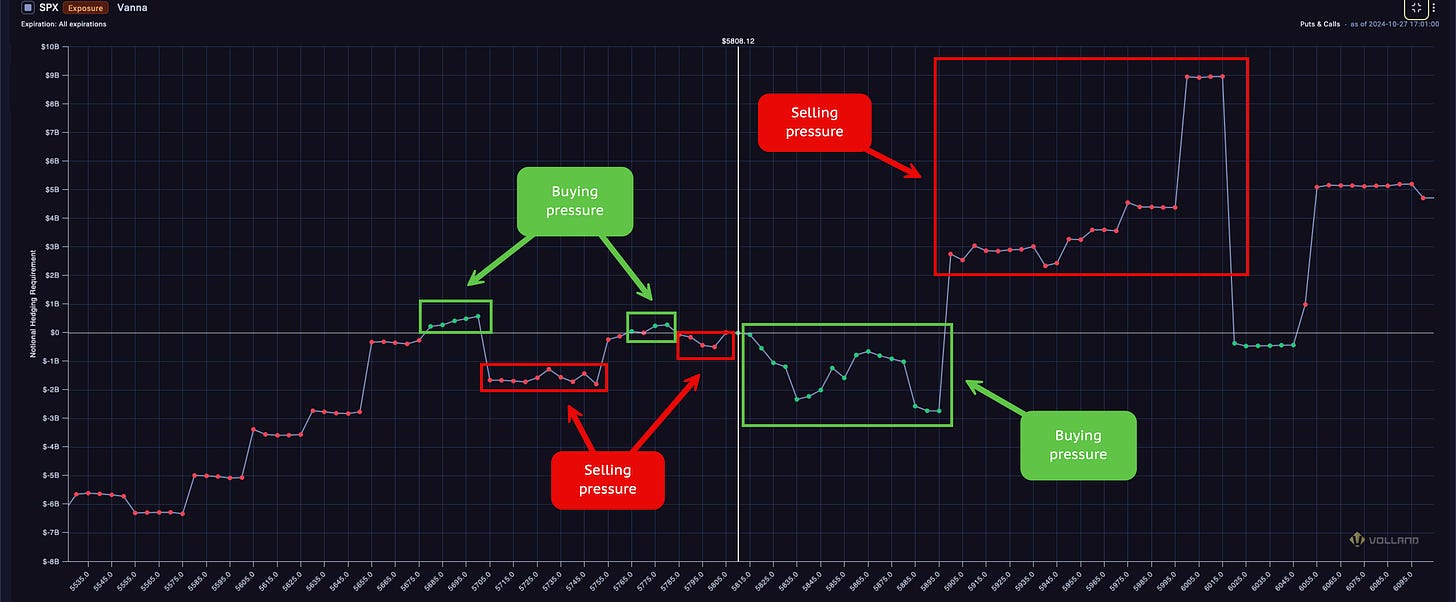
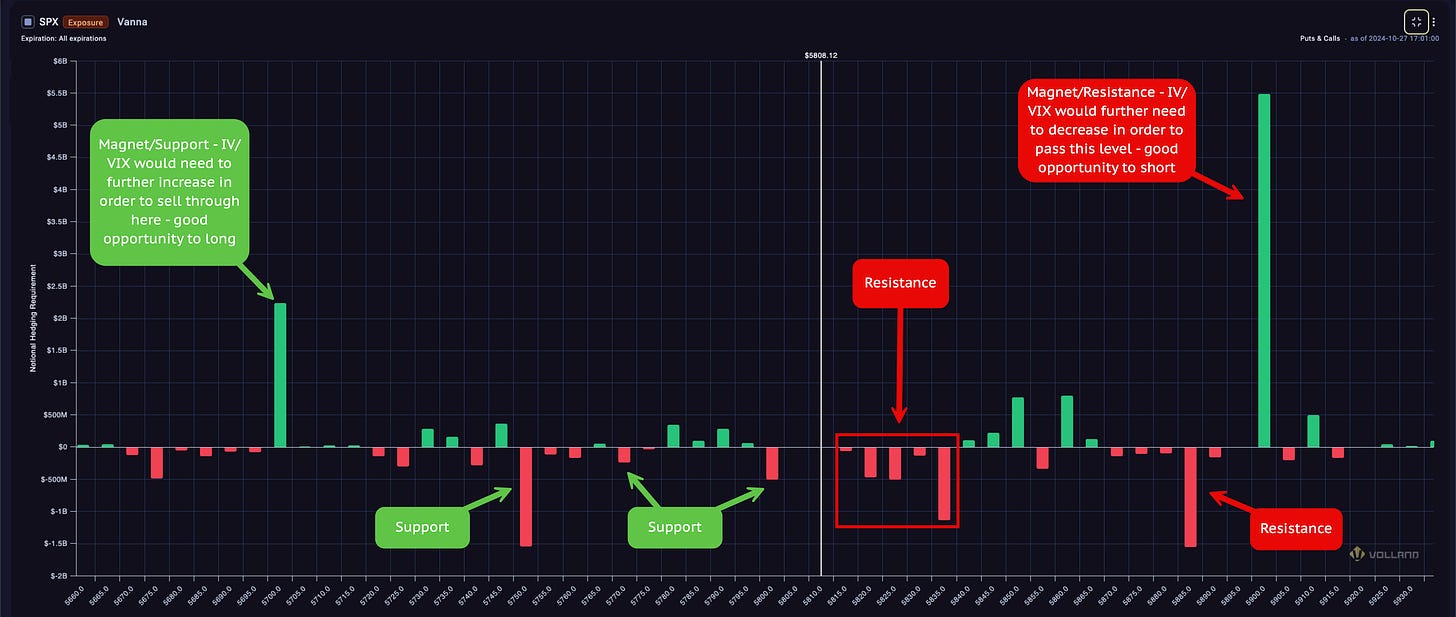
Looking at this from all expirations view...
We can see the market push up as high as 5900 and find support at 5800, 5785 or 5765-5750 or 5700.
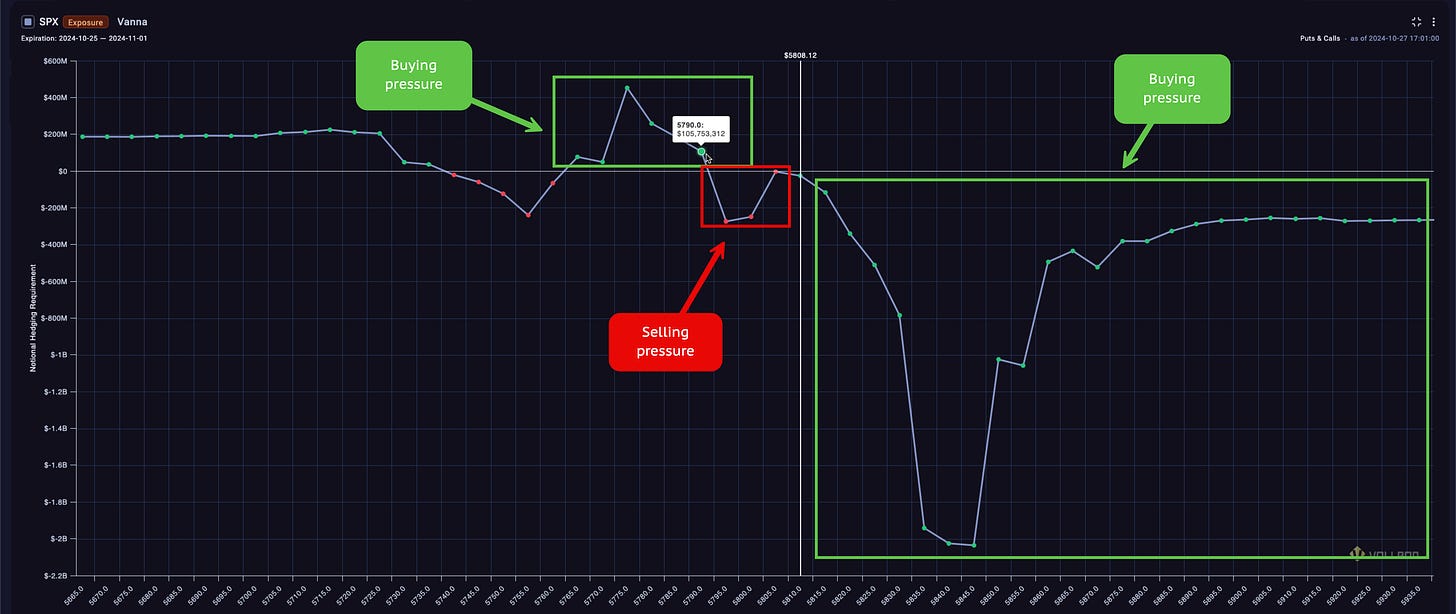
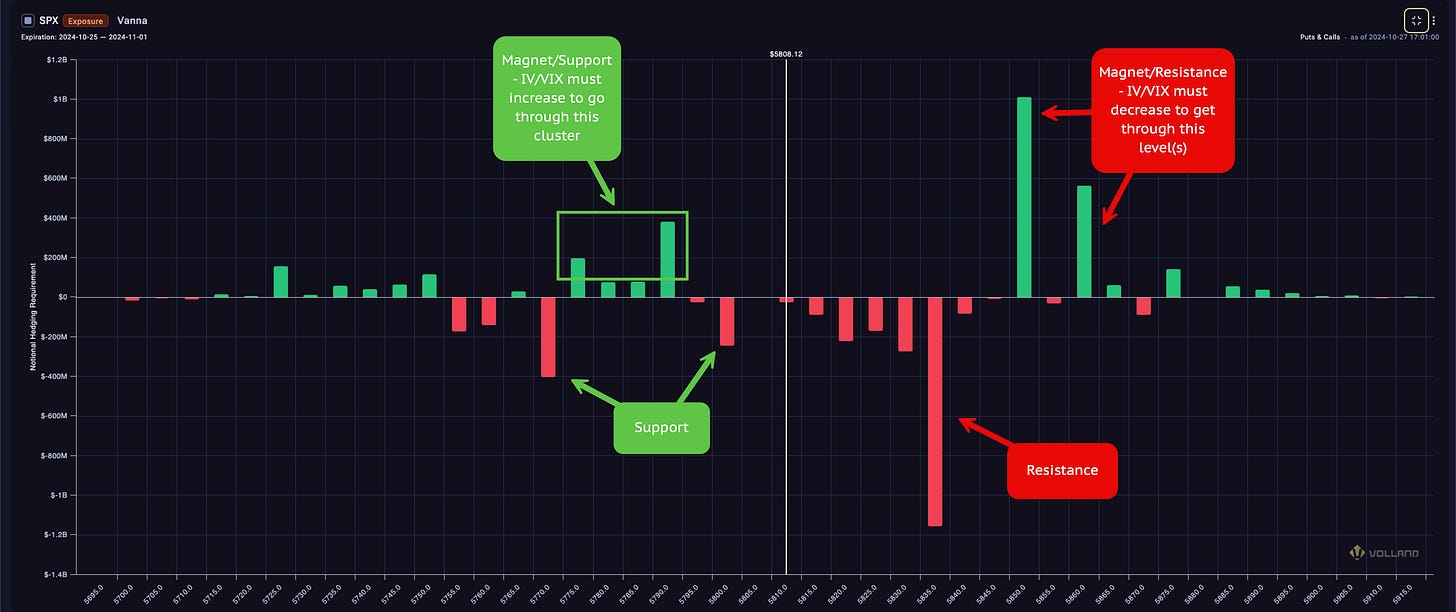
Let's now take a look at this from a weekly view...
You see a similar view, but you see a much more aggressive bullish trend
5790 starts to find buyers if we do see selling in futures
5760 and below can trigger the biggest selling on the week IF it were to occur
Plenty of buying pressure on dealers above spot
If we take a look at the weekly vanna strikes and chart we can zoom in on the specific strikes that are important...
Support:
5800-5790 - support and I would watch this zone and how the VIX reactions - will bring volatility or decrease it and that will be your trigger whether this holds or not
5770 - Major support on the week
Resistance:
5815-5830 - cluster of minor resistance - IF VIX can't go down or IV we will not get through this zone
5835 - resistance and we traded near this level a lot last week
5850 - magnet and major resistance - this is the first major area of supply and I would wait and assess what catalyst drives us above this level including the VIX/IV to decrease
Vanna Summary
If we now rap this up by reviewing the all expirations vanna strike chart we can see the following key levels across all timeframes are:
Support Levels:
5800 - support
5790 - magnet - positive vanna
5780 - magnet - positive vanna
5770 - support
5760-5750 - major support - 5750 large negative vanna
Resistance Levels:
5820-5825 - resistance
5835 - resistance
5850 - magnet
5860 - magnet
5870-5885 - resistance - 5885 large negative vanna
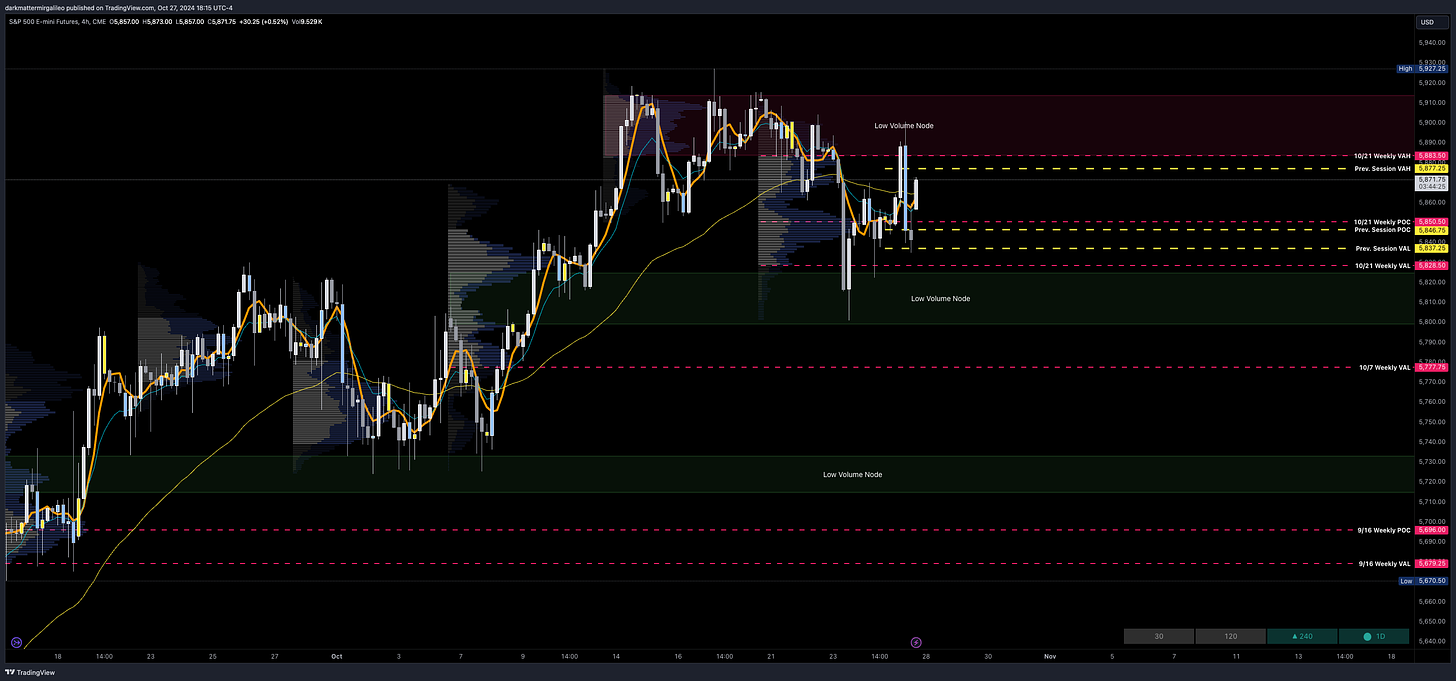
ES Volume Profile Overview
These are ES levels and NOT SPX - subtract 38-40pts to get SPX levels
TLDR
5883-5915 - resistance - last week's seller and the prior week sits here - so options data/Volland is going to guide us as we enter into this zone
5850-5828 - we developed a HVN throughout the week and its a clear interest to buyers
Key Levels
5883.50 - Last week's value area high - if we can't hold this we continue down last week's value area's then
5850.50 - last week's point of control
5828.50 - last week's value area low
5824-5800 - low volume node - major area of support - can't be bearish until we break that
How to Setup Volume Profile
If you are curious how we set our volume profiles and use them there is a great video from Captain that can be found here -
Dynamic Trade Plans
These trade plans are dynamic. So to get updates make sure you subscribe to Volland.
Get our weekly and daily plans while also learning how to use dealer positions to have better trading success.
Remember use promo code DARKMATTER10 to get 10% off your first month at Volland.
10/28 ES Weekly Trade Plan
Key Weekly Levels
5850 - resistance - if you are a bull you want to see this level recaptured and we continue to push otherwise I see chop or selling coming in...
5800 - support - vanna and gamma - let's see if it holds to push us towards 5885
5770 - support - major area of interest to the options market
5750 - support
Chop Bias:
We could face a similar situation as last week stuck between key levels
5835-5860 - is our resistance zone - watch for sellers here - and we need a clear catalyst to get through it - it is best to scalp in this zone
5800-5750 - is our support zone - we have found buyers here over the past 2 weeks keeping price up
Thus with this analysis I can't say a swing can occur until you break one of these sides and it is best to scalp or WAIT until we have clear direction above or below these zones. You can instead play those extremes - ie short 5860-5850 or long 5800 - but what I can't tell is when those extremes will trade. Thus I recommend scalping these or flying a fly/condor like trade with these zones as its wings.
Any updates to the plan or levels will be provided in our weekly room. Keep an eye on Volland and the VIX for trend continuation or reversals.
ES December contract value is approx. 38-40pts more than the SPX levels shared - so take ES minus 41pts to get SPX levels. To get SPY levels simply take the SPX levels and divide by 10.03.
As a reminder we have officially partnered with Volland - available at https://vol.land - providing our weekly and daily ES/SPX analysis to subscribers there.
Get our weekly and daily plans while also learning how to use dealer positions to have better trading success.
Remember use promo code DARKMATTER10 to get 10% off your first month at Volland.
My Trading Rules -
X Profile - https://x.com/DarkMatterTrade
YouTube Channel - https://www.youtube.com/channel/UC_6nM50Ebtg7iaylWZVFoLw
Disclaimer:
The stock market is risky, gains are not guaranteed. This is not about getting rich quick, but learn to educate yourself and make the necessary financial decisions on your own. This is not financial advice.

