SPX/SPY/ES Intraday Overview (TL;DR)
We have a gap up in the market with PCE data coming out prior to the market open along with FOMC Member Barr speaking and Consumer Sentiment and Inflation Expectations coming at 10am est.
AMZN may provide some relief for the bulls on shorter timeframes after a hit on its ER. Will it die like META does though? So far it is holding, but the intraday session trend and continuation of it will be set with the PCE data.
To keep this gap up bulls need to keep price above 4160 to target 4170 then 4180. Above 4180 targets 4190.
For the bears they want to defend 4160 max 4170 and start pushing price down to target 4145 then 4120.
If you haven’t subscribed already come and join us. For as little as $15/month we provide daily trade plans for intraday traders while also providing great educational content to our subscribers.
News Catalysts
8:30am est - PCE
9:00am est - FOMC Member Barr Speaks
10:00am est - Revised UoM Consumer Sentiment
10:00am est - Revised UoM Inflation Expectations
For more information on news events, visit the Economic Calendar
10/27 - SPX/ES/SPY Trade Plan
Bullish bias:
Above 4160 target 4170
If VIX continues going down then a breakout of 4170 targets 4180
If there is a breakout of 4180 target 4190
Bearish bias:
Below 4120 target 4105
If VIX continues going up then a breakdown of 4105 targets 4090
If there is a failed breakout of 4160 or 4170 target 4145 then 4120
As always keep an eye on Volland30 and the VIX for trend continuation or reversals.
Remember you can use this SPX trade plan to trade ES or SPY. ES value is approx. 20pts more than the SPX levels shared. To get SPY levels simply take the SPX levels and divide by 10.03.
SPX - The Why Behind the Plan
Key Levels
Above Spot:
4160 - negative vanna
4159 - 10/26 VAH
4170 - negative vanna
4180 - negative vanna
4190 - negative vanna
4186 - weekly and 10/25 POC
4200 - negative vanna
4206 - 10/25 VAH
4220 - negative vanna
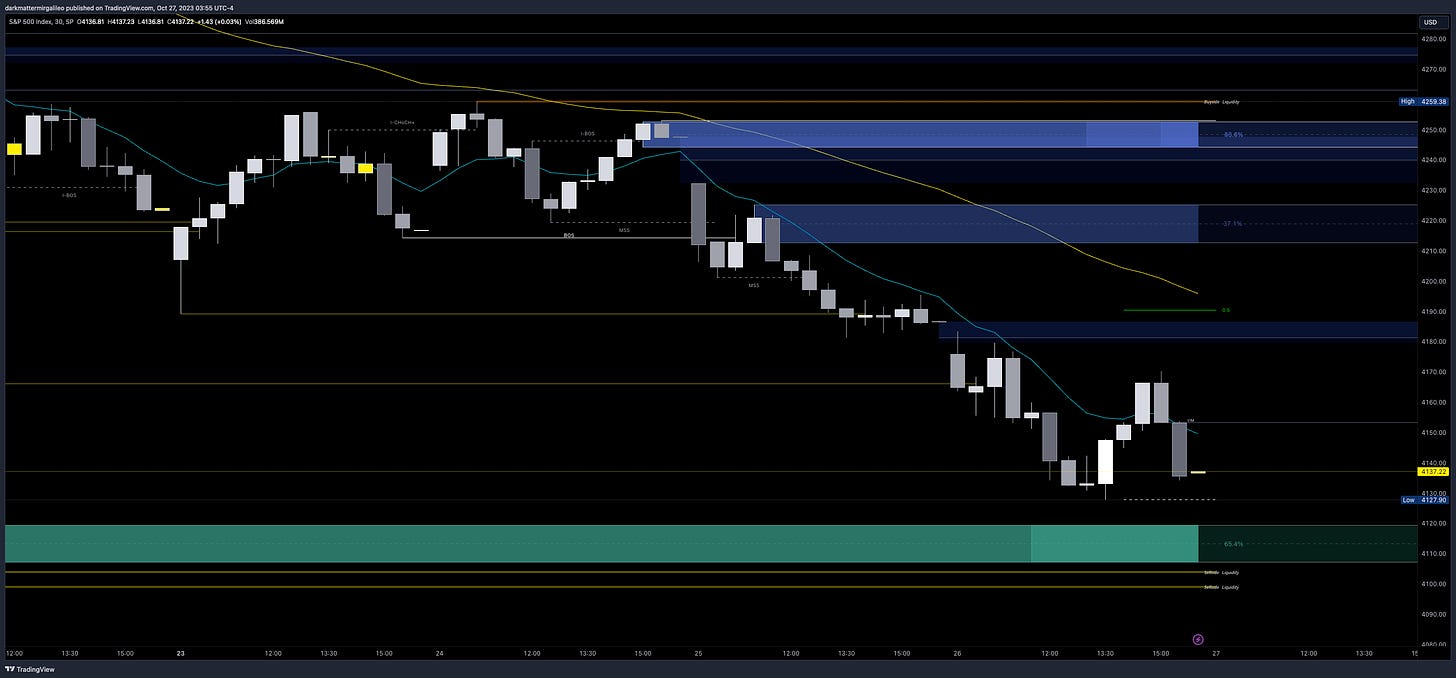
4212-4225 - OB (30min chart)
4219 midline
4230 - negative vanna
4230-4253 - OB (2hr, 4hr chart)
4241 midline
4244 - Our Q4 and October VAL
Below Spot:
4120 - negative vanna
4132-4103 - OB (1D chart)
4118 midline
4137 - 10/26 POC
4123 - key volume profile level
4105 - negative vanna
4106 - 5/22 VAL
4090 - negative vanna
4096 - This is May’s VAL
4070 - negative vanna
4060 - negative vanna
4050 - negative vanna
4049-4035 - OB (2hr chart)
4042 midline
Volume Profile
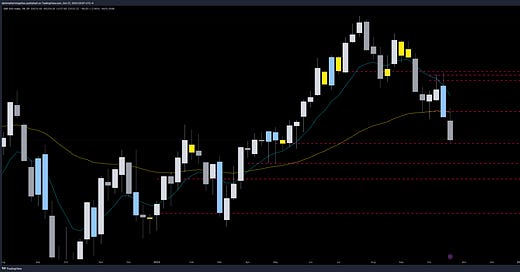
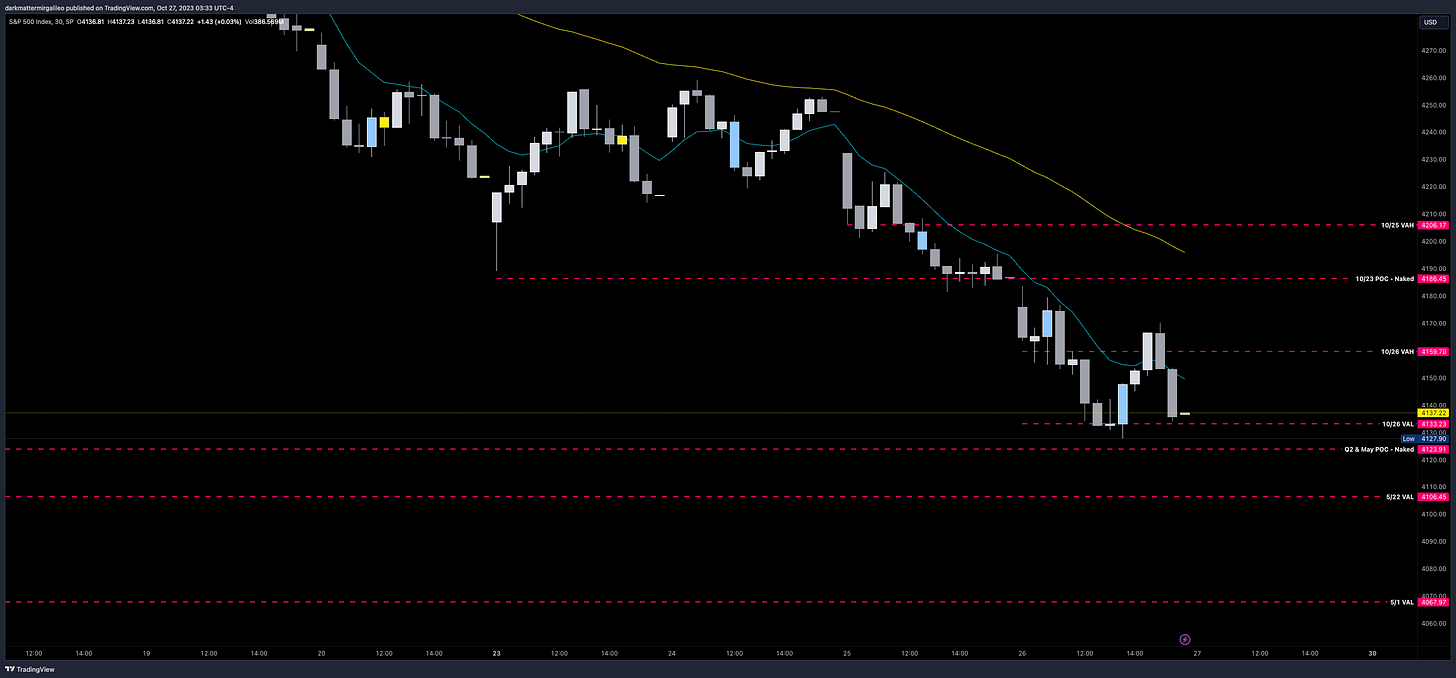
Let’s zoom out and take a look at the weekly chart. You can see this month alone we have made substantial damage where price is now seeking prices last seen in May.
So from a quarterly volume profile on the weekly chart some key levels are seen.
4123.91 - We missed this level by a few pts from today’s low. This IMO is one of the more critical levels we should have marked. The loss of this level and if it holds as resistance starts pushing price towards 4048.
4048 - This is where the Q2 VAL sits at. Likely target if 4123 doesn’t hold.
4244 - Our Q4 and October VAL. Could we be range bound within these levels?
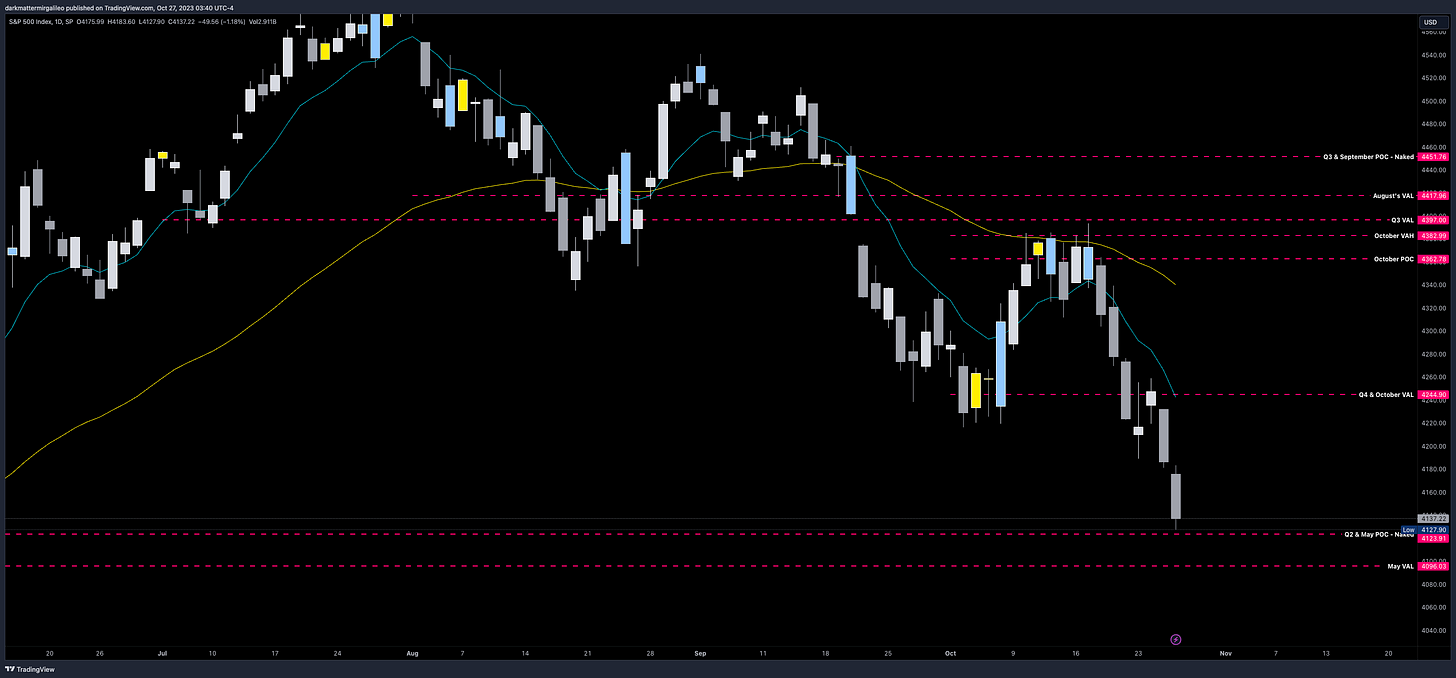
If we take a look at the daily chart and review the monthly volume profile we find the following levels…
4123 - This is May’s POC and we barely missed tagging this level in 10/26’s session
4096 - This is May’s VAL
4244 - October’s VAL
4362 - October’s POC
None of these levels should be traded as 1DTE - look for weeklies
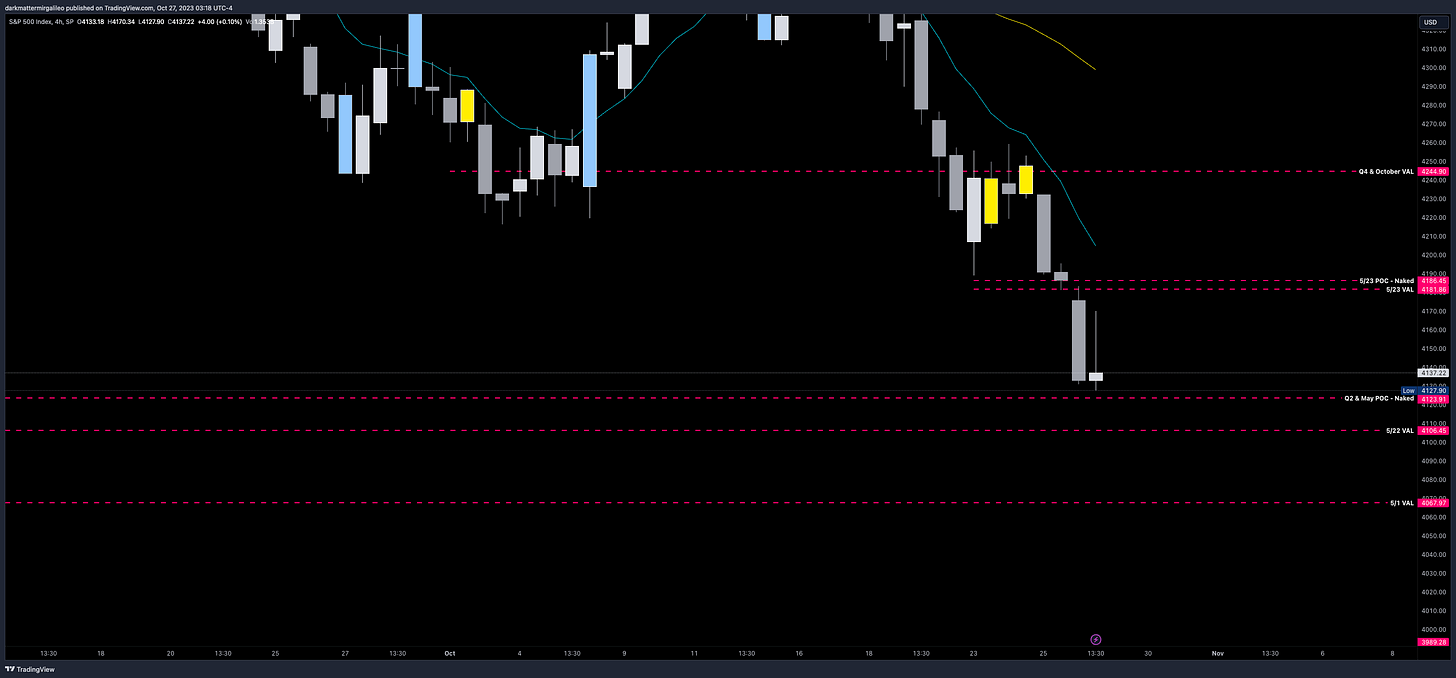
Let’s now look at the 4hr chart and review where the weekly volume profile levels show.
4106 - Should we lose the quarterly level at 4123 our first stop comes right here - this would be considered a 1DTE type of trade.
4067 - This level will be hunted by the bears as long as we are below 4106 on a daily close
4181 & 4186 - We have our weekly VAL and POC respectively sitting here.
On the smaller timeframe and intraday let’s go to our 30min chart where we will put our session volume profile on. Our levels of importance are…
4133 & 4137 - 4133 is the 10/26 session VAL. 4137 is 10/26’s POC. Below it we target 4123 - which is the Q2 & May POC and has not been breached yet.
4159 - This is the 10/26 session VAH and above 4133-4137 will be target. We have basically hit this level at least in overnight futures trading.
4186 - This is the 10/25 session POC and hasn’t been breached.
4206 - This is the 10/25 session VAH
Orderblocks (OB) and Fair Value Gaps (FVG)
These are smart money concepts and some areas I am looking to see how price reacts. I will give higher credence to OB’s whereas FVG’s could be areas of basing/consolidation if they break. I use Sonarlab’s indicator on Tradingview to plot these.
Resistance levels - at these levels I want to see if price rejects to short or consolidates for a push up. I couple this data with Volland, intraday option flows, and Dark Pool levels. Higher timeframe OB’s or FVG will be harder to break. OB’s are the stronger levels over FVG’s.
4212-4225 - OB (30min chart)
4219 midline
4230-4253 - OB (2hr, 4hr chart)
4241 midline
4318-4335 - OB (30min chart)
4327 midline
4361-4382 - OB (2hr, 4hr chart)
4372 midline
Support levels - at these levels I want to see if price rejects to long or consolidates for a push down. I couple this data with Volland, intraday option flows, and Dark Pool levels. Higher timeframe OB’s or FVG will be harder to break. OB’s are the stronger levels over FVG’s.
4132-4103 - OB (1D chart)
4118 midline
4049-4035 - OB (2hr chart)
4042 midline
3979-3960 - OB (4hr chart)
3965 midline
Volland Data
For a better understanding of the various greeks below I would suggest you visit the Volland YouTube Page. Volland provides unique data showing where dealers are positioned providing in my opinion a higher degree of conviction to where price may move to.
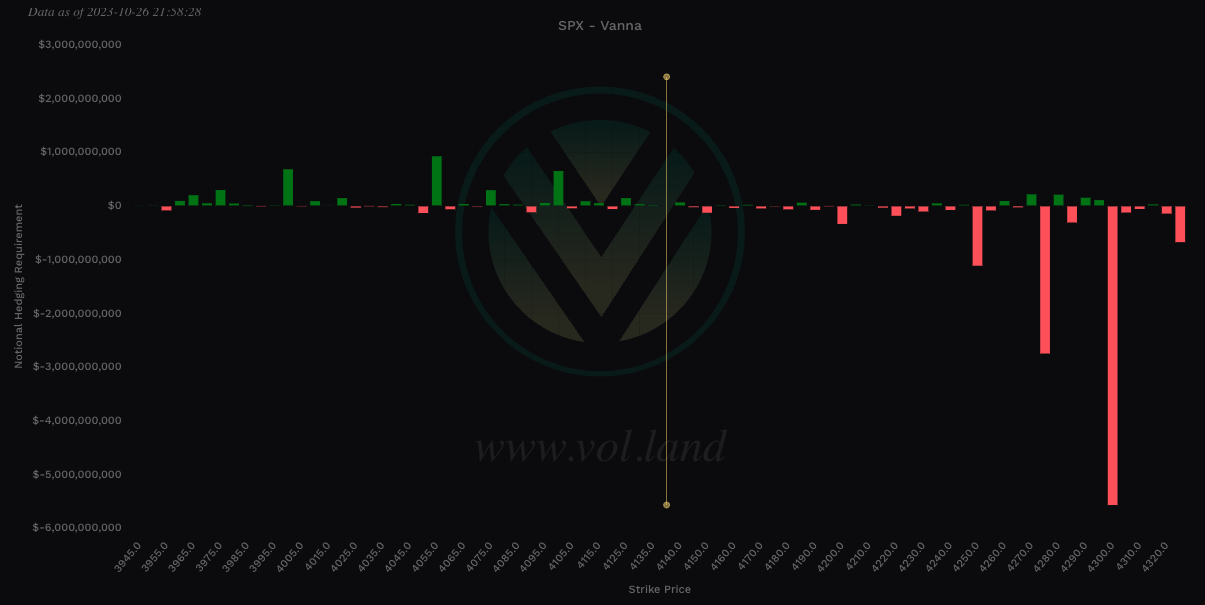
Vanna - Levels where price may repel or act as magnet
Remember for price to go above spot through a magnet or repellent VIX and IV must decrease or stay flat. For price to go below spot through a magnet or repellent VIX and IV must increase.
Positive vanna - will act as magnet
Negative vanna - will act as repellent
When price goes through a positive or negative level it will flip it - ie negative becomes positive and vice versa.
Above Spot:
4160 - negative vanna
4170-4180 - negative vanna
4170 - negative vanna
4180 - negative vanna
4190-4200 - negative vanna
4190 - negative vanna
4200 - negative vanna
4215-4230 - negative vanna
4220 - negative vanna
4230 - negative vanna
Below Spot:
4120 - negative vanna
4105 - negative vanna
4090 - negative vanna
4070 - negative vanna
4060 - negative vanna
4050 - negative vanna
Weekly Option Expected Move
SPX’s weekly option expected move is ~94 points. SPY’s expected move is ~9.45. That puts us at 4318.15 to the upside and 4130.15 to the downside. For SPY these levels are 430.64 and 411.74.
Remember over 68% of the time price will resolve it self in this range by weeks end.
TradingView Chart Access
For access to my chart laying out all of the above key levels please visit here.
To cover our basis…
Welcome to my Substack where I provide a daily SPX trading plan to help guide my intraday trading. The purpose of this letter is not to advice you on your trading or investment decisions. I am simply documenting my daily trading plan for myself to help with planning and execution. These are simply my opinions and the data sourced from the likes of vol.land, TradingView, Quant Data and others. The stock market is risky, gains are not guaranteed. This is not about getting rich quick, but learn to educate yourself and make the necessary financial decisions on your own. This is not financial advice.




Mays POC
what is at 4152 in SPX, the futures are getting support there. Dont see any levels in your chart for that price.