Weekly Market Overview
First and foremost expect some major volatility this week. Not only do we have monthly options expiring (OPEX), we also have some key data coming out this week including CPI on Tuesday, PPI & Retail Sales Wednesday, and then Unemployment Claims on Thursday.
For those who haven’t subscribed this is the kind of work we do here. For as little as $15/month we provide daily trade plans for intraday traders while also providing great educational content to our subscribers.
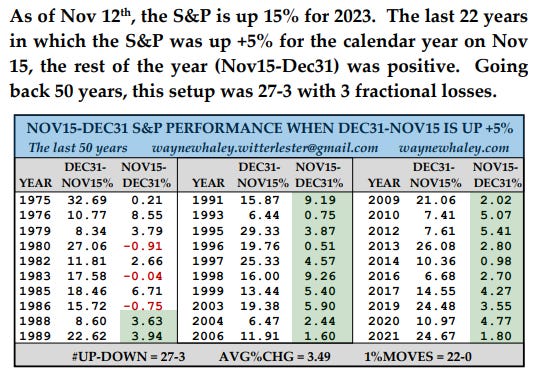
Let’s check in with Wayne Whaley who does such a tremendous job of taking past stock market data and guiding on its trend. Here is a new study he has done which states that if the S&P 500 is up +5% on November 15th than the rest of the year was positive. That means 27 times we were up over 3 other times we were down.

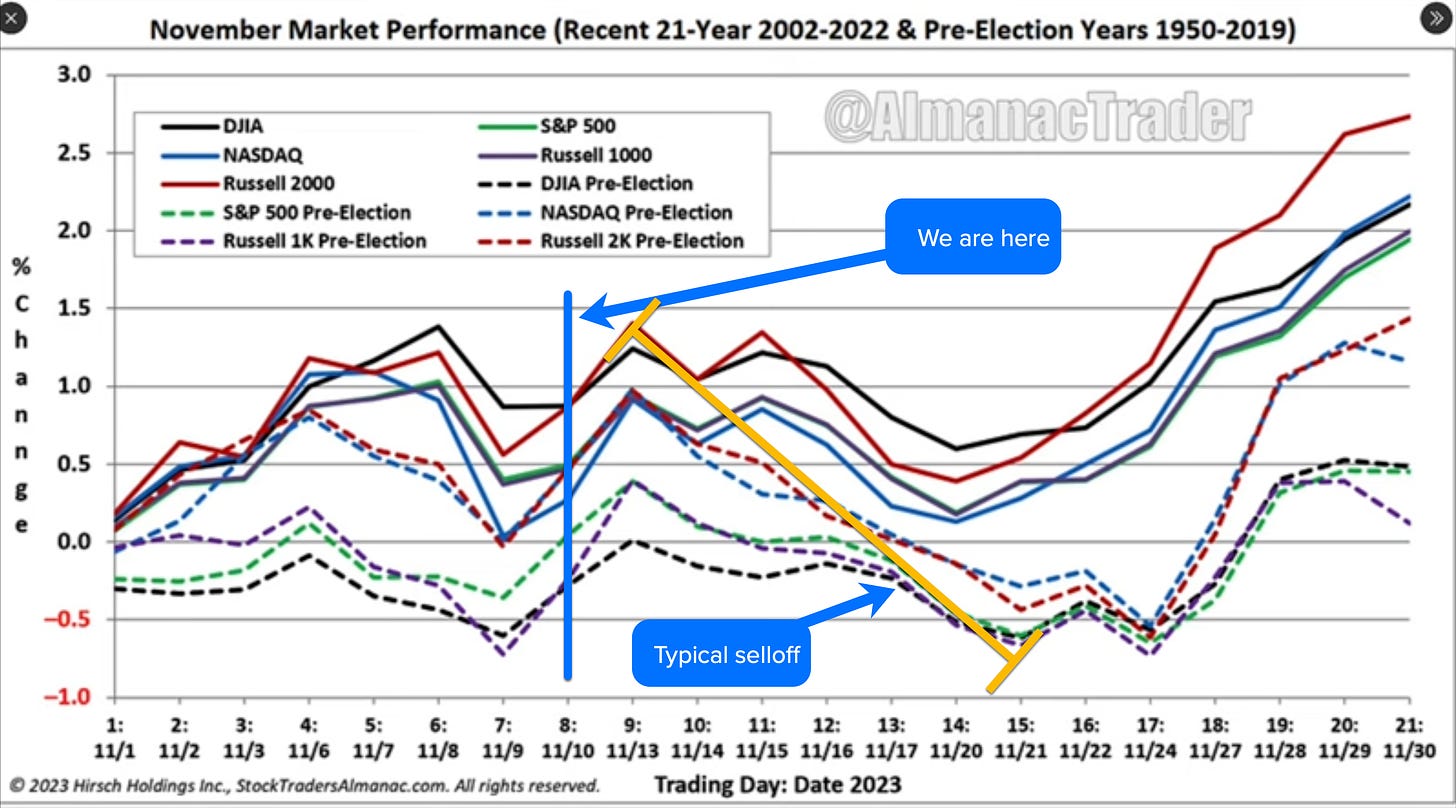
Additionally, let’s review seasonality. So far seasonality trends have held throughout the year and based on where we are at this week could be a bearish type of week where we trend down. You will see in the below chart where we are at in November and typically these next few trading days sees a small bump up only to selloff where post OPEX we start to consolidate and then breakout.
Let’s now review some of our key levels in SPX and some analysis on the charts. First and foremost the 10ema has crossed over the 50ema (bullish) on the daily chart - this was the last major timeframe where we had the 50ema over the 10ema (bearish). This cross which occurred late last week puts as at 4328.
Additionally the 4360-4350 zone gets my attention. We have a cluster of volume profile levels here and along with those an orderblock. Thus this zone becomes my bull vs bears LIS for the week. A close below we go down further and a hold above it pushes us higher.
Below 4360-4350 most likely targets 4300 and then 4230. So this level is key on the weekly to determine the trend and direction for the market over the short term.
Next up is the 4395-4380 zone. It is weaker than the 4360-4350 level, but intraday Monday I will be watching to see if we get a reaction to this zone and how it behaves. If we break below we target that 4360-4350 zone then.
The zone between 4420-4395 is complete chop IMO. I would only be playing breakouts and breakdowns or failed ones in this zone. I wouldn’t want to be caught in any reversals and I would keep my stop losses tight to avoid any major losses.
Above 4420 we then tread towards 4450 where we could face some resistance and consolidation. Should we slice through 4450 and close above it then the chase towards 4465 then 4480 occurs.
So in summary our key levels on the week are:
4480
4465
4450
4420-4391 - chop zone
4360-4350 - must hold for bulls
4330
Now let’s jump into the trade plan…
11/13 SPX/SPY/ES Intraday Overview (TL;DR)
We don’t have any news on the week so don’t be shocked if we just chop around. Remember the 4420-4391 zone is complete chop zone and I wouldn’t hold trades within this zone beyond their targets or I would wait to trade after we break this zone.
With that said, if you are a bull you want price above
Keep reading with a 7-day free trial
Subscribe to Dark Matter Trade to keep reading this post and get 7 days of free access to the full post archives.


