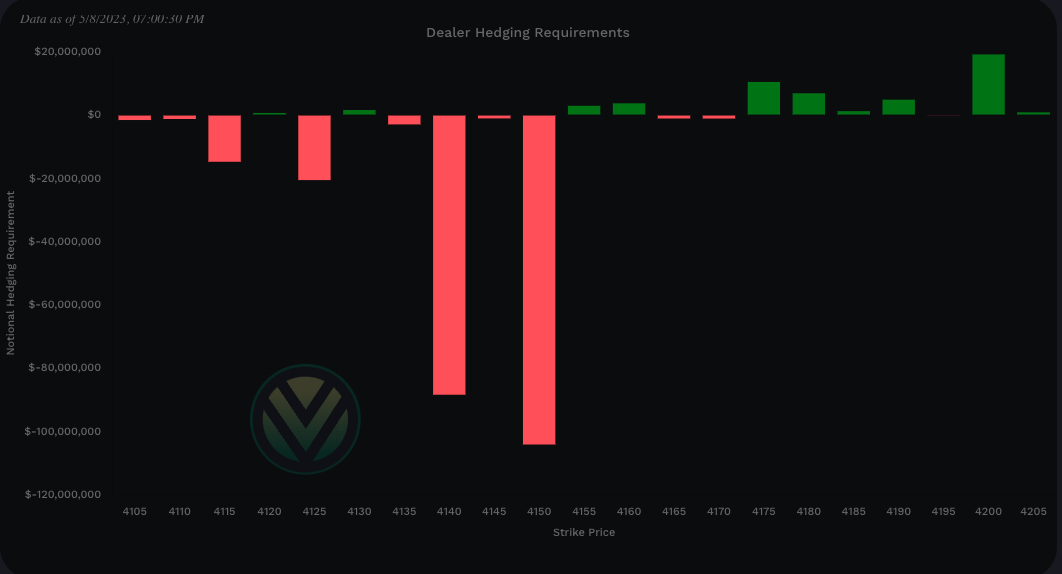
Good evening/day/morning traders. I was traveling back today so here is a quick recap of our last trading day last week…
Friday was another successful day for the trade plan. We had pre-market news come out where ES held 4093 which is approx. 4075 on SPX. From our trade plan we were only bearish if SPX traded below 4070 which it did not, triggering the following trades throughout the session:
Above 4080 target 4095
If there is a breakout of 4100 target 4115
Use VOLD indicator for trend continuation
We then had the failed breakdown of 4115 later in the session and then a break of it. Using our key levels published above 4115 targeted 4130 and a break of it targeted 4145. This is why it is important to mark these key levels, understand why they are important so that you can trade these levels and trends.
Remember, it all comes down to trading level to level, waiting to see what happens at these key levels. Just cause we didn’t break 4115 doesn’t mean it couldn’t come later in the session. Mark the levels and set alerts and understand your trade plan and targets prior to taking the trade. This will help you manage risk…
Congrats if you took all or one of these trades.
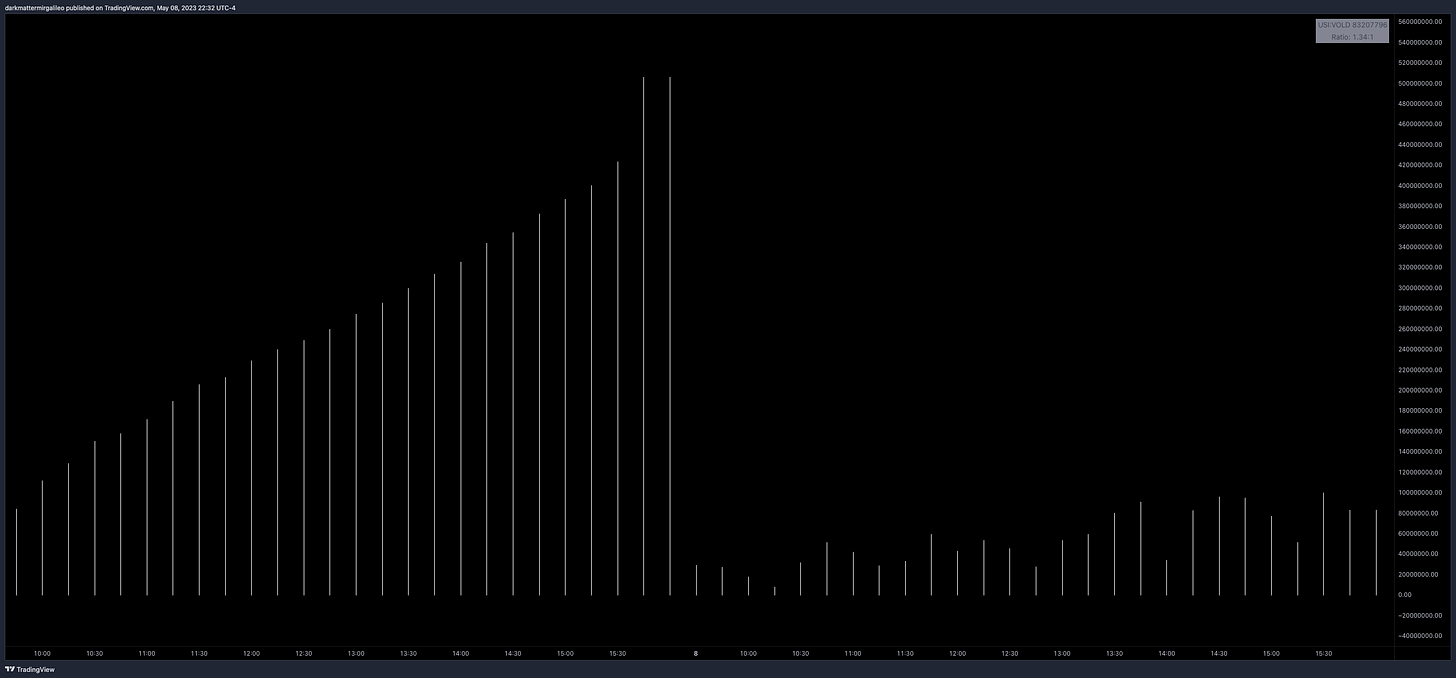
As a follow up on the VOLD indicator once again whether you were looking at this on the 30/15/5 min charts we had continued uptrend and our ratio was quite high - north of 5-8 ratio for most of the day. Indicating a bullish trend and as that VOLD ratio increased it gave us further conviction that more was to come. If you haven’t read our VOLD indicator write-up see below trade plan.
Now compare today’s VOLD, Monday, May 8 to Friday’s VOLD. Major difference right?
Let’s jump right into today’s trade plan.
I enjoy interacting and learning from other traders so continue to share your trades, ideas, and how you use this trade plan by messaging me on Twitter @DarkMatterTrade.
News Catalyst
8:30am est - FOMC Member Jefferson Speaks
12:05pm est - FOMC Member Williams Speaks
TBD - IBD/TIPP Economic Optimism
As a reminder we are still in earnings season with the following companies reporting this week.
For more information on news events, visit the Economic Calendar
SPX/ES/SPY Trade Plan
Remember you can use this SPX trade plan to trade ES or SPY. ES value is approx. 15pts more than the SPX levels shared below. To get SPY levels simply take the SPX levels below and divide by 10.03
Bullish bias:
Above 4140 target 4150
If there is a breakout of 4150 target 4165
Use VOLD indicator for trend continuation
If there is a failed breakdown of 4125-30 target 4140-45
Bearish bias:
Below 4135 target 4125
If there is a breakdown of 4120 target 4105
Use VOLD indicator for trend continuation
If there is a failed breakout of 4150 target 4135
SPX - The Why Behind the Plan
Key Levels
Above Spot - resistance:
4150 - negative vanna
4155-60 - positive gamma
4151-4168 - FVG (30min chart)
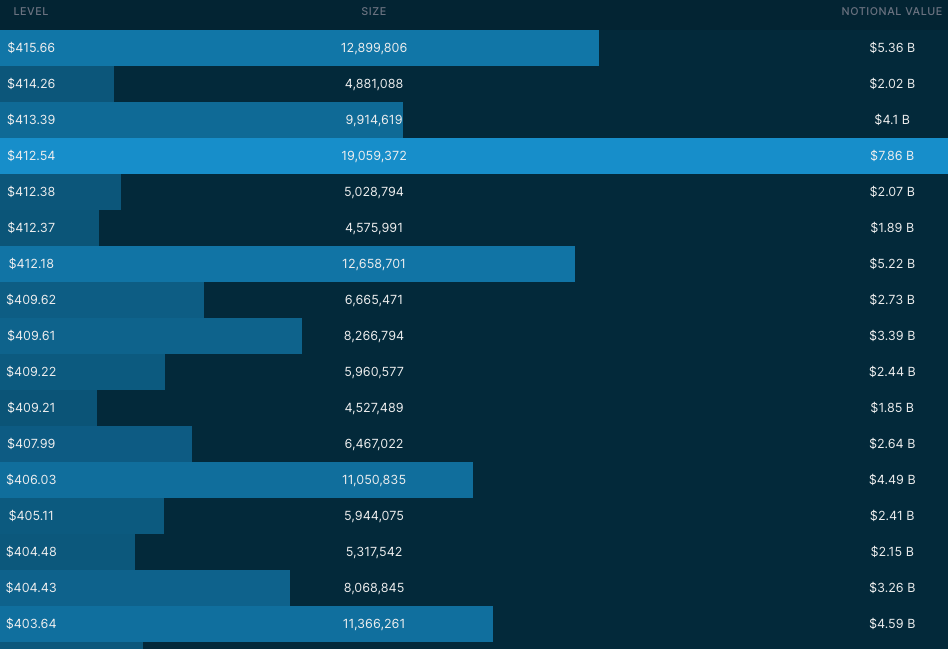
4145-4155 - (413.39, 414.26) - $6.12B
4165-70 - negative vanna
4175-4205 - positive gamma
4176-4200 - OB (2hr chart)
4170 - (415.66) - $5.36B
Below Spot - support:
4130 - negative vanna
4130 - positive gamma
4134-37 - (412.18-412.54) - $17.01B
4125 - negative vanna (0DTE)
4125 - positive gamma
4120 - negative vanna
4120 - positive gamma
4112-4095 - FVG (1hr chart)
4104-08 - (409.21-409.62) - $10.41B
Dark Pool Levels
The biggest change from yesterday’s session was the $2.64B dark pool print at the 4092 level. This should be a level we watch to see how price action reacts. We do have quite a bit dark pool below this level which could pin the market between 4100 and 4045.
Above Spot:
4145-4155 - (413.39, 414.26) - $6.12B
4170 - (415.66) - $5.36B
Below Spot
4134-37 - (412.18-412.54) - $17.01B
4104-08 - (409.21-409.62) - $10.41B
4072 - (406.03) - $4.49B
4045-55 - (403.64-404.48) - $10B
3999-89 - (397.73-398.76) - $6.02B
3977-68 (395.62-396.53) - $12.87B
Here is a summary chart from Quant Data that shows the key levels that have been bought up in dark pool prints since the beginning of March 1, 2023.
We need to pay attention to these dark pool levels. Mark them on your chart as key levels that we should pay attention to. Remember the levels where we see dark pool prints greater than $2-4B should peak our interest. I get my dark pool levels from Quant Data.
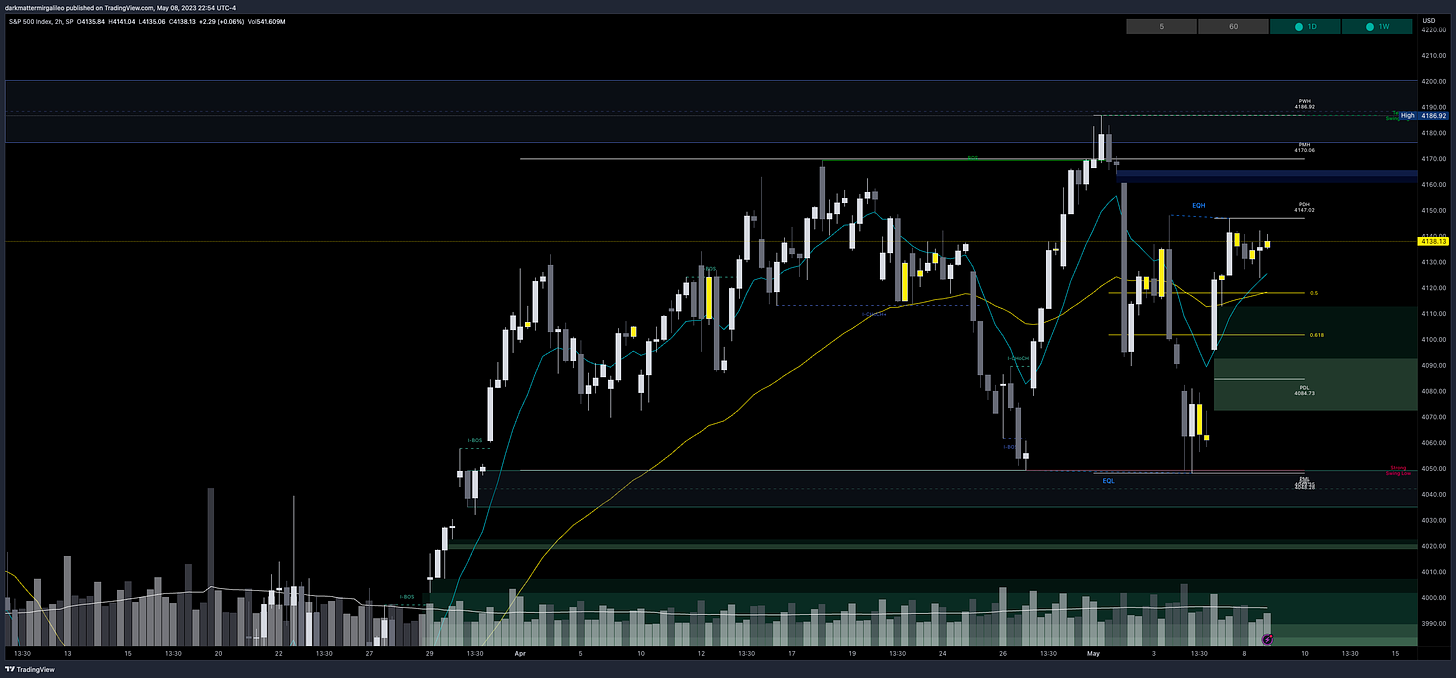
Orderblocks (OB) and Fair Value Gaps (FVG)
These are smart money concepts and some areas I am looking to see how price reacts. I will give higher credence to OB’s whereas FVG’s could be areas of basing/consolidation if they break.
Resistance levels - at these levels I want to see if price rejects to short or consolidates for a push up. I couple this data with Volland, intraday option flows, and Dark Pool levels. Higher timeframe OB’s or FVG will be harder to break. OB’s are the stronger levels over FVG’s.
4151-4168 - FVG (30min chart)
4176-4200 - OB (2hr chart)
4231-4242 - OB (1hr chart)
4242-4279 - FVG (2hr chart)
4274-4291 - OB (2hr chart)
Support levels - at these levels I want to see if price rejects to long or consolidates for a push down. I couple this data with Volland, intraday option flows, and Dark Pool levels. Higher timeframe OB’s or FVG will be harder to break. OB’s are the stronger levels over FVG’s.
4112-4095 - FVG (1hr chart)
4095-4072 - FVG (1hr chart)
4049-4035 - OB (2hr chart)
4042-4035 - OB (1hr chart)
4030-4019 - FVG (4hr chart)
4018-4007 - OB (1hr chart)
4007-3967 - FVG (2hr chart)
3967-3951 - OB (2hr chart)
Weekly Option Expected Move
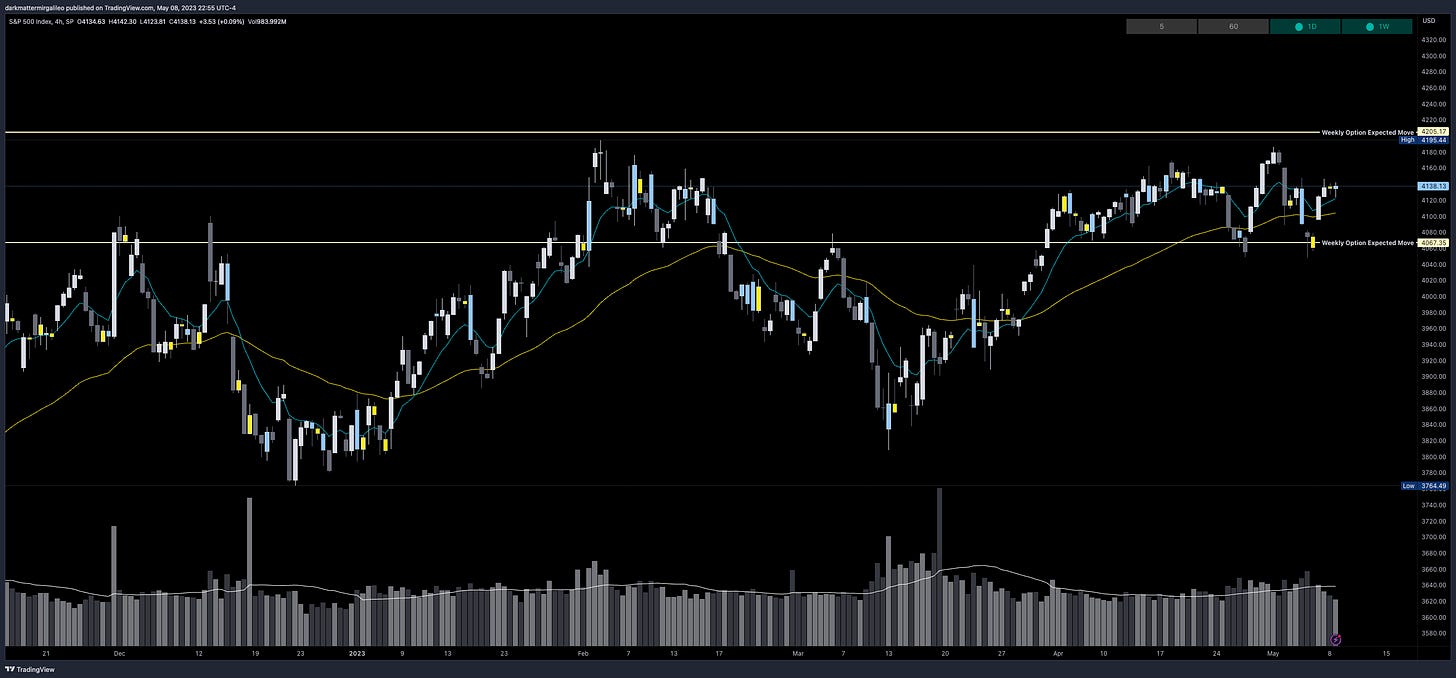
SPX’s weekly option expected move is ~68.91 points. SPY’s expected move is ~6.90. Remember over 68% of the time price will resolve it self in this range by weeks end.
Volland Data
For a better understanding of the various greeks below I would suggest you visit the Volland YouTube Page. Volland provides unique data showing where dealers are positioned providing in my opinion a higher degree of conviction to where price may move to.
Vanna - Levels where price may repel or act as magnet
Remember for price to go above spot through a magnet or repellent VIX and IV must decrease or stay flat. For price to go below spot through a magnet or repellent VIX and IV must increase.
Positive vanna - will act as magnet
Negative vanna - will act as repellent
When price goes through a positive or negative level it will flip it - ie negative becomes positive and vice versa.
Above Spot:
4140 - negative vanna
4150 - negative vanna
4165-70 - negative vanna
4210 - negative vanna
Below Spot:
4130 - negative vanna
4125 - negative vanna (0DTE)
4120 - negative vanna
Gamma and Delta-Adjusted Gamma (DAG)
Positive Gamma Above Spot - acts as resistance
Positive Gamma Below Spot - acts as support
Negative Gamma - becomes permissive to price as it moves there - aka neither resistance nor support - simply just chillin and watching what’s happening…
Above Spot:
4155-60 - positive gamma
4175-4205 - positive gamma
4200 is the largest gamma
Dealers must buy above 4145
Below Spot:
4130 - positive gamma
4125 - positive gamma
4120 - positive gamma
Dealers must sell below 4125
Charm
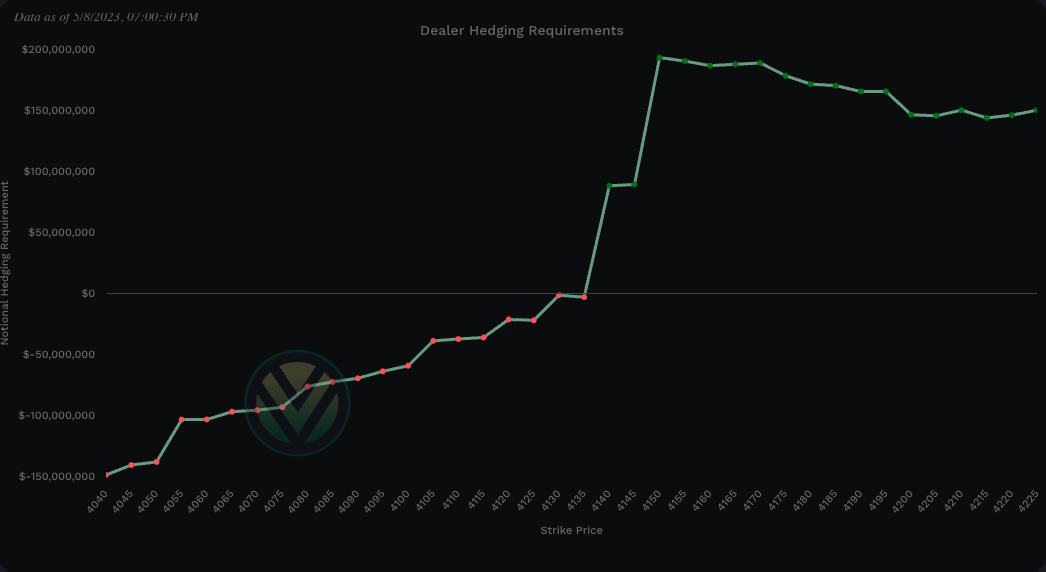
Charm total notional value is bullish - negative is bullish and positive bearish - take the total of the far left and far right values. Looking at the key levels charm shows key levels below spot at 4130 targeting 4120. 4150 could be the top of the range.
When reviewing Charm we also need to account for SPY’s charm. It is leaning bearish with 412 and 410 key levels below spot. Above spot 415 and 417 are key levels.
For the full charm effect to play out ideally we want to see SPX and SPY in sync.
To cover our basis…
Welcome to my Substack where I provide a daily SPX trading plan to help guide my intraday trading. The purpose of this letter is not to advice you on your trading or investment decisions. I am simply documenting my daily trading plan for myself to help with planning and execution. These are simply my opinions and the data sourced from the likes of vol.land, TradingView, Quant Data and others. The stock market is risky, gains are not guaranteed. This is not about getting rich quick, but learn to educate yourself and make the necessary financial decisions on your own. This is not financial advice.


