Good evening/day/morning traders. Another successful trade plan today yielded us the opportunity to #paytiently wait and react to the key levels taking a trade. Let’s recap today’s action.
If you are a bear you now know what key level we must break - 4180. Wow how that level the past two trading sessions has been bought up pushing the market back towards 4200. When that breaks bears can rejoice - just a little - until then this is a bulls kind of party.
While we could have taken the trade at the open at 4190 to go long targeting 4210 - 5 pts shy of our target - I have a personal rule on days where we have speakers or a big news catalyst - like the debt ceiling - I let the first half hour of the initial balance to fight it out and in the event the news catalyst breaks or has updates. By then you will typically have data from Quant Data, Vold indicator, and the 5min chart to see what the key levels are and how they are reacting.
On top of that we made a very early and aggressive push to the upside trying to target last sessions high, but were rejected and started the fast decline to 4180. I took the trade on the break of 4195 and rode this to the low of 4180. When we neared 4185 I immediately set my stop loss and kept pushing it up as we got closer to 4180 until it triggered. I know there will be times “oh I wish I kept it for more profit,” but I was happy. Up 25% in profit and nearing a key price target. If we had broken it I could always trade the break of 4175. Instead, stop loss triggered and SPX rallied from there.
I can’t emphasis that if you want to be a successful trader you need to…
Take profits and compound - stop going for homerun hits and 100% PnL’s - these are not as common as you think and the more successful traders over the years compound and keep growing their bank. Grow bank and you can take bigger shots for a larger profit target. Rinse and repeat
Paytiently waiting for levels and understanding why they are important. Without this it is almost like driving blind. This is why I started this trade plan to hold myself accountable and have a plan for each trading day. Without it I can’t act #paytiently and I might take trades with low reward and high risk
I have learned a lot over the years and have started to finally piece it together and have had my most successful consecutive months since starting this trading plan in February. Continue to stick with us and we will all become better traders and do it with an amazing group of people.
Let’s jump into the trade plan.
I enjoy interacting and learning from other traders so continue to share your trades, ideas, and how you use this trade plan by messaging me on Twitter @DarkMatterTrade.
News Catalyst
The debt ceiling will be a critical news catalyst. So if you are in a trade keep a tight leash on it as any news could rally or sell off the market rather quickly.
9:00am est - FOMC Member Logan Speaks
9:45am est - Flash Manufacturing PMI
9:45am est - Flash Services PMI
10:00am est - New Home Sales
10:00am est - Richmond Manufacturing Index
As a reminder we are still in earnings season with the following companies reporting this week.
For more information on news events, visit the Economic Calendar
SPX/ES/SPY Trade Plan
Remember you can use this SPX trade plan to trade ES or SPY. ES value is approx. 13pts more than the SPX levels shared below. To get SPY levels simply take the SPX levels below and divide by 10.01.
Bullish bias:
Above 4210 target 4225
If there is a breakout of 4235 target 4260
Use VOLD indicator for trend continuation
VIX should be decreasing
If there is a failed breakdown of 4195 or it holds target 4225
Use VOLD indicator for trend reversal
VIX should be decreasing
Bearish bias:
Below 4195 target 4180
If there is a failed breakout of 4225 target 4210
Use VOLD indicator for trend reversal
VIX should be increasing
If there is a breakdown of 4175 target 4160
Use VOLD indicator for trend continuation
VIX should be increasing
SPX - The Why Behind the Plan
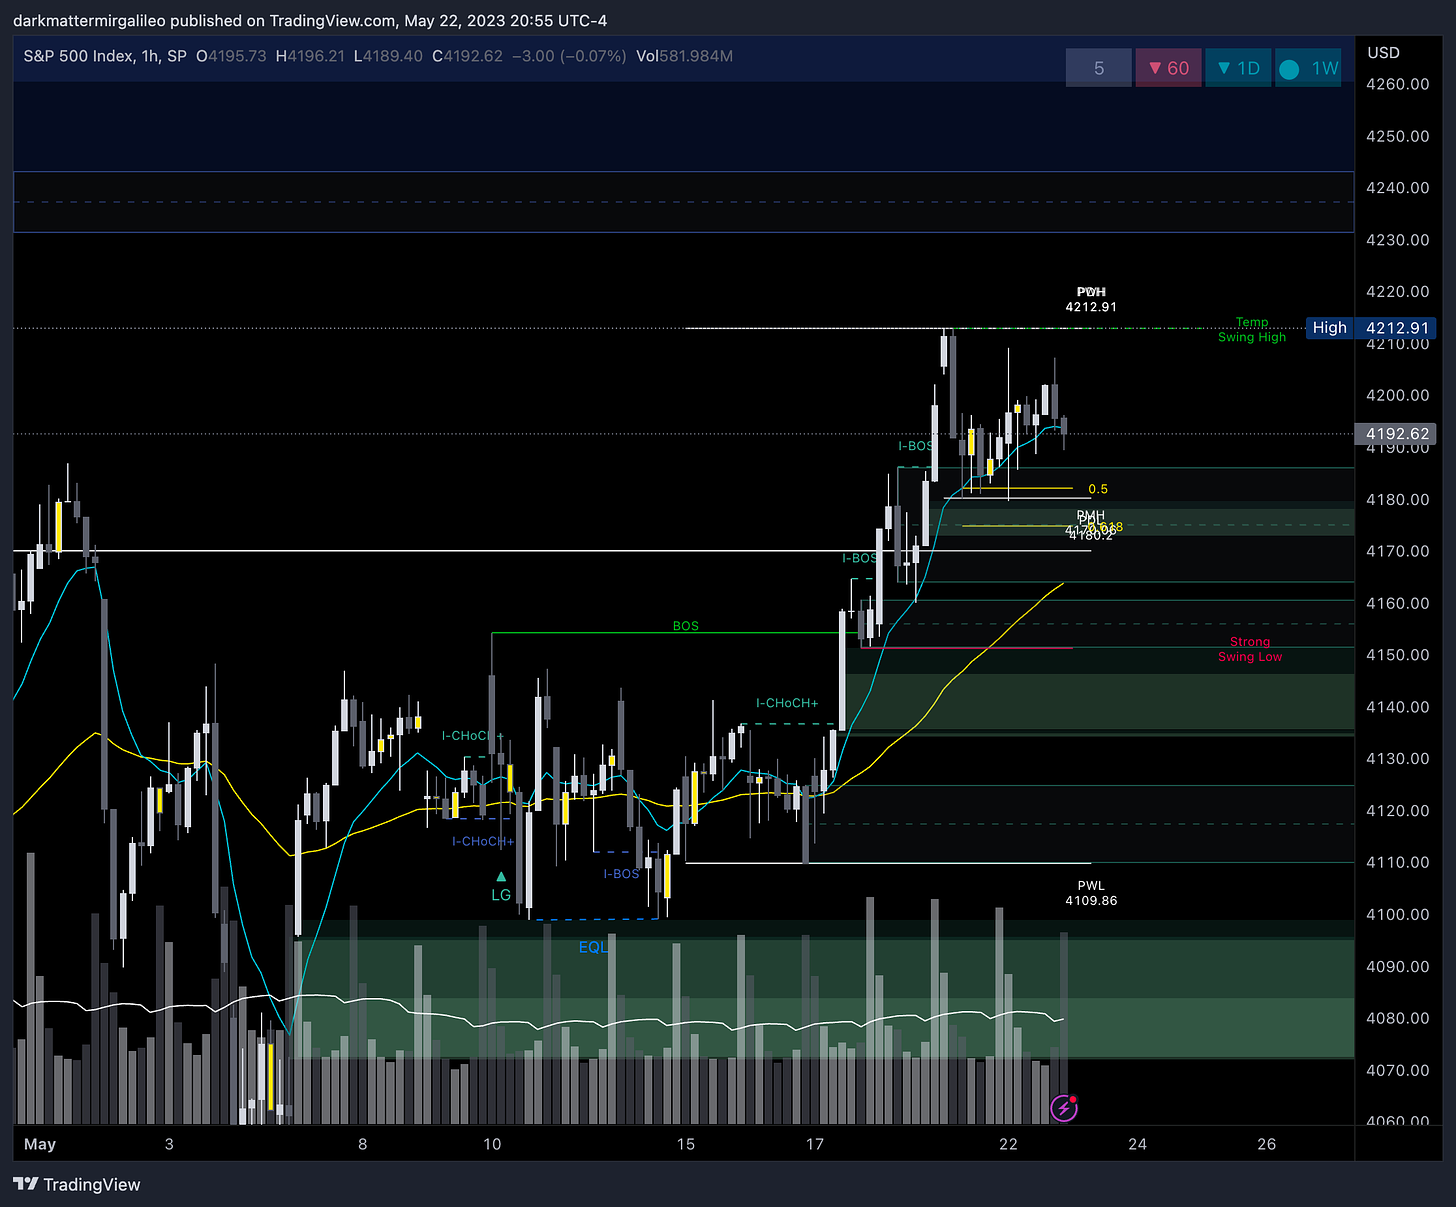
Key Levels
Above Spot:
4195 - negative vanna
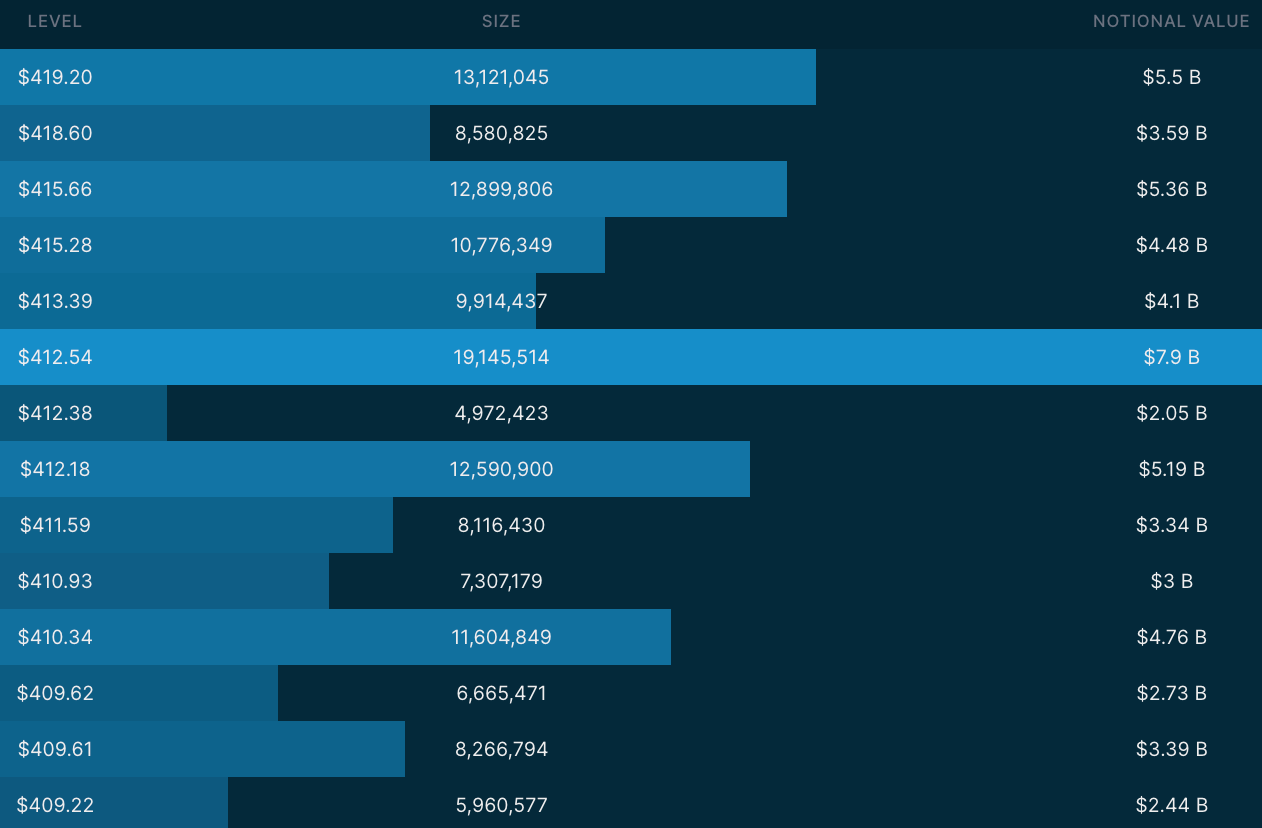
4196-90 - 419.20-418.60 - $9.09B
4205 - negative vanna
4200 - positive gamma
4210 - negative vanna
4215-20 - positive gamma
4225 - negative vanna
4230-35 - positive gamma
4231-4242 - OB (1hr chart)
4260 - negative vanna
4242-4279 - FVG (2hr chart)
4262 midline
Below Spot:
4175 - negative vanna
4175 - positive gamma
4186-4164 - OB (1hr chart)
4174 midline
4179-4173 - FVG (1hr chart)
4160 - negative vanna
4160 - positive gamma
4160-56 - 415.66-415.28 - $9.8B
4151-4134 - FVG (2hr chart)
4142 midline
4130 - negative vanna
4138-25 - 413.39-412.18 - $19.24B
4125-4110 - OB (2hr chart)
4117 midline
Dark Pool Levels
Minimal prints today in the dark pool. We did see an increase of $0.08B on the 419.20 level. This will be a key area to see if the dark pool ends up being a long or short. In the mean time it is a critical level that should have some significance on your chart though for any upside to hold. We will want to see this level turn from resistance to support and hold any retracements back to it.
4196-90 - 419.20-418.60 - $9.09B
4160-56 - 415.66-415.28 - $9.8B
4138-25 - 413.39-412.18 - $19.24B
4120-07 - 411.59-410.34 - $11.10B
4100-4096 - 409.62-409.22 - $8.56B
We need to pay attention to these dark pool levels. Mark them on your chart as key levels that we should pay attention to. Remember the levels where we see dark pool prints greater than $2-4B should peak our interest. I get my dark pool levels from Quant Data.
Orderblocks (OB) and Fair Value Gaps (FVG)
These are smart money concepts and some areas I am looking to see how price reacts. I will give higher credence to OB’s whereas FVG’s could be areas of basing/consolidation if they break.
Resistance levels - at these levels I want to see if price rejects to short or consolidates for a push up. I couple this data with Volland, intraday option flows, and Dark Pool levels. Higher timeframe OB’s or FVG will be harder to break. OB’s are the stronger levels over FVG’s.
4231-4242 - OB (1hr chart)
4242-4279 - FVG (2hr chart)
4262 midline
4274-4291 - OB (2hr chart)
Support levels - at these levels I want to see if price rejects to long or consolidates for a push down. I couple this data with Volland, intraday option flows, and Dark Pool levels. Higher timeframe OB’s or FVG will be harder to break. OB’s are the stronger levels over FVG’s.
4186-4164 - OB (1hr chart)
4174 midline
4179-4173 - FVG (1hr chart)
4171-4160 - OB (30min chart)
4151-4134 - FVG (2hr chart)
4142 midline
4125-4110 - OB (2hr chart)
4117 midline
4098-4072 - FVG (2hr chart)
4049-4035 - OB (2hr chart)
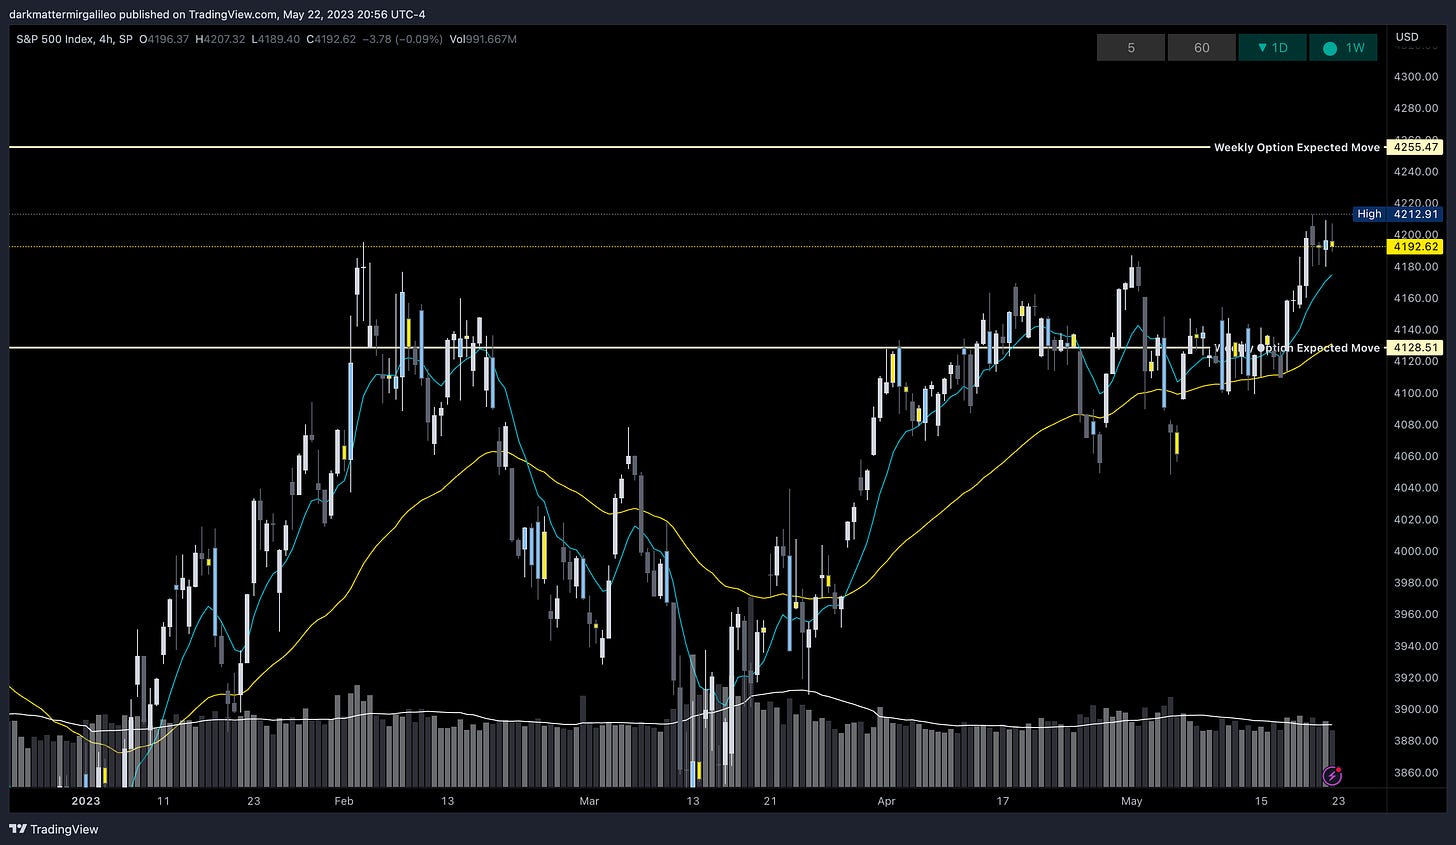
Weekly Option Expected Move
SPX’s weekly option expected move is ~63.48 points. SPY’s expected move is ~6.42. Remember over 68% of the time price will resolve it self in this range by weeks end.
Volland Data
For a better understanding of the various greeks below I would suggest you visit the Volland YouTube Page. Volland provides unique data showing where dealers are positioned providing in my opinion a higher degree of conviction to where price may move to.
Vanna - Levels where price may repel or act as magnet
Remember for price to go above spot through a magnet or repellent VIX and IV must decrease or stay flat. For price to go below spot through a magnet or repellent VIX and IV must increase.
Positive vanna - will act as magnet
Negative vanna - will act as repellent
When price goes through a positive or negative level it will flip it - ie negative becomes positive and vice versa.
Above Spot:
4195 - negative vanna
4205 - negative vanna
4210 - negative vanna
4225 - negative vanna
4260 - negative vanna
Below Spot:
4175 - negative vanna
4160 - negative vanna
4130 - negative vanna
4100 - negative vanna
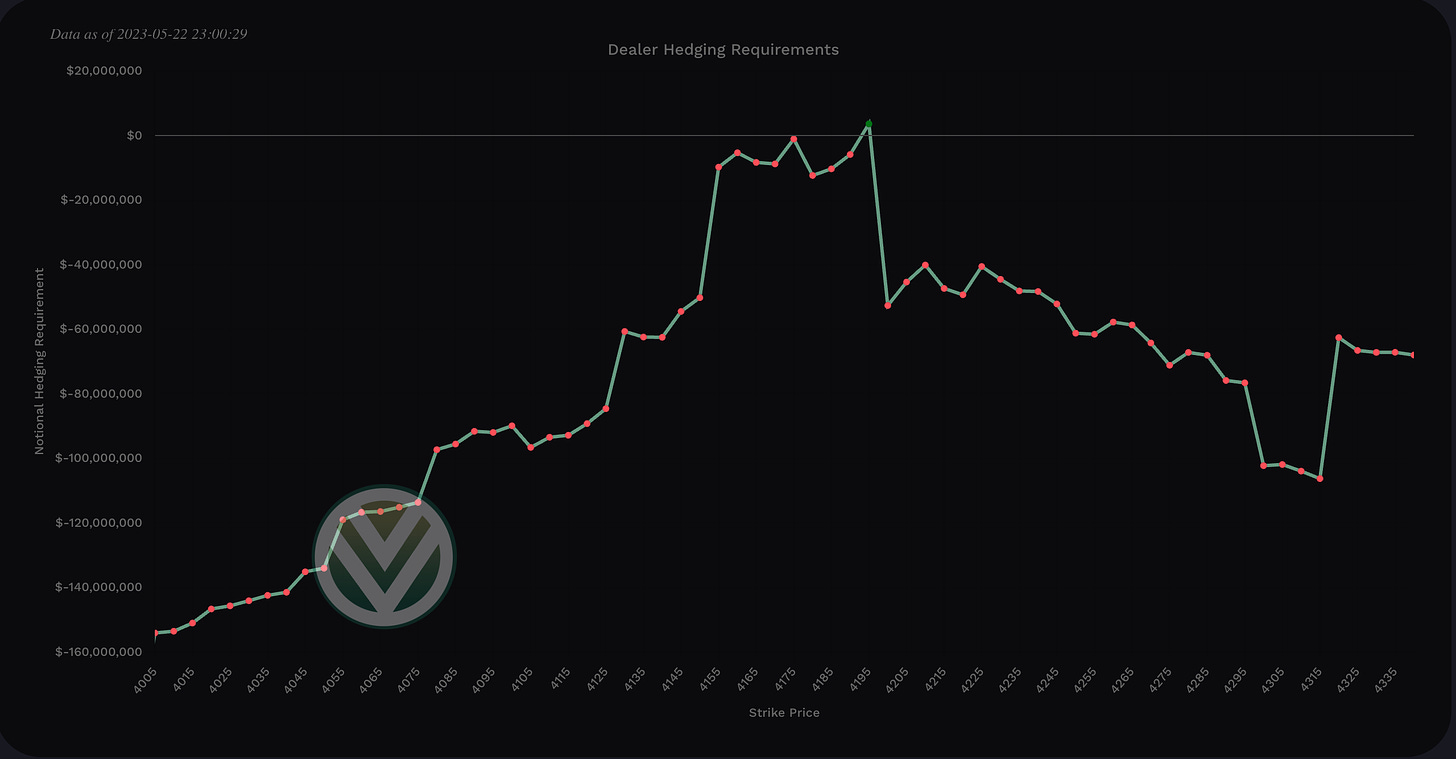
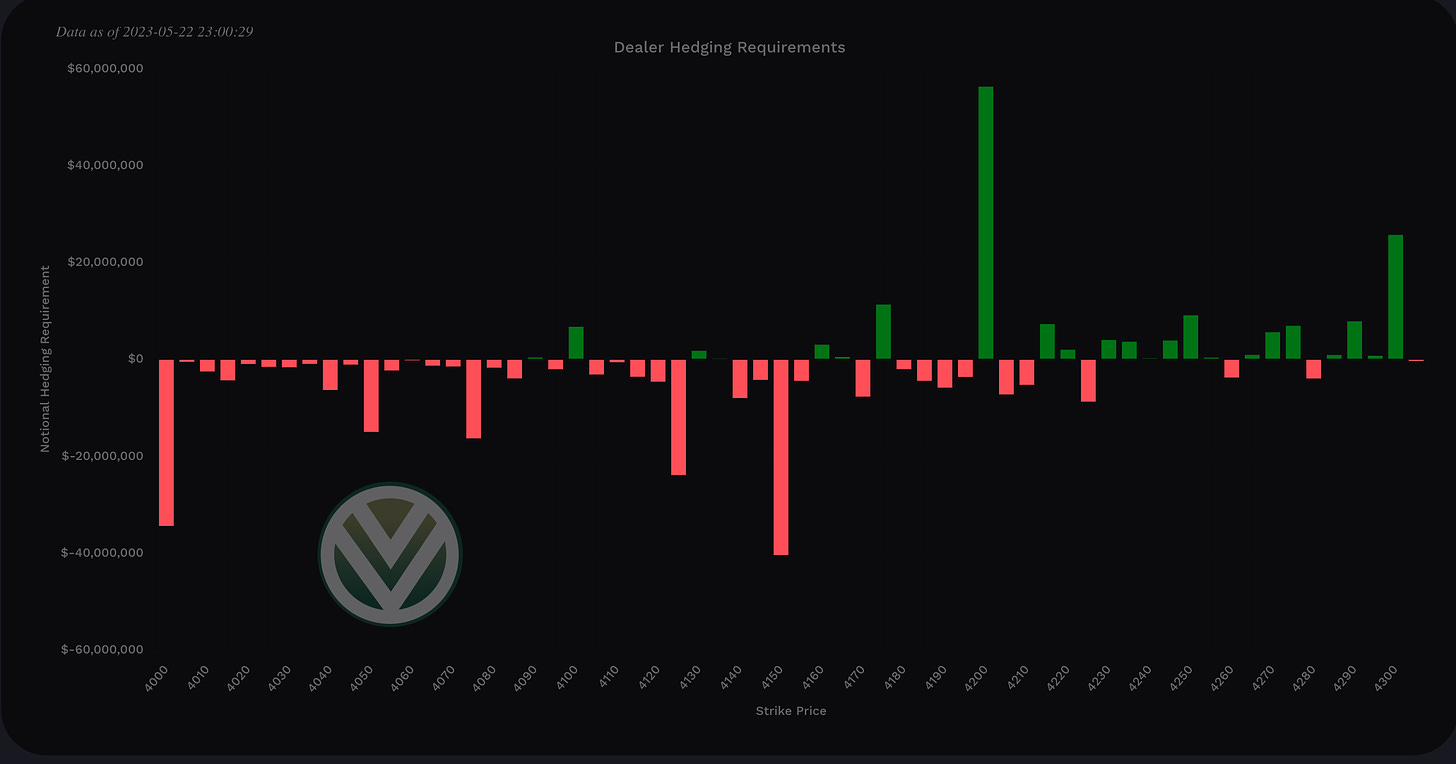
Gamma and Delta-Adjusted Gamma (DAG)
Positive Gamma Above Spot - acts as resistance
Positive Gamma Below Spot - acts as support
Negative Gamma - becomes permissive to price as it moves there - aka neither resistance nor support - simply just chillin and watching what’s happening…
Above Spot:
4200 - positive gamma
4215-20 - positive gamma
4230-35 - positive gamma
Dealers are neutral hedging at 4195, but must sell above 4200
Below Spot:
4175 - positive gamma
4160 - positive gamma
4100 - positive gamma
Dealers must sell below 4150
Charm
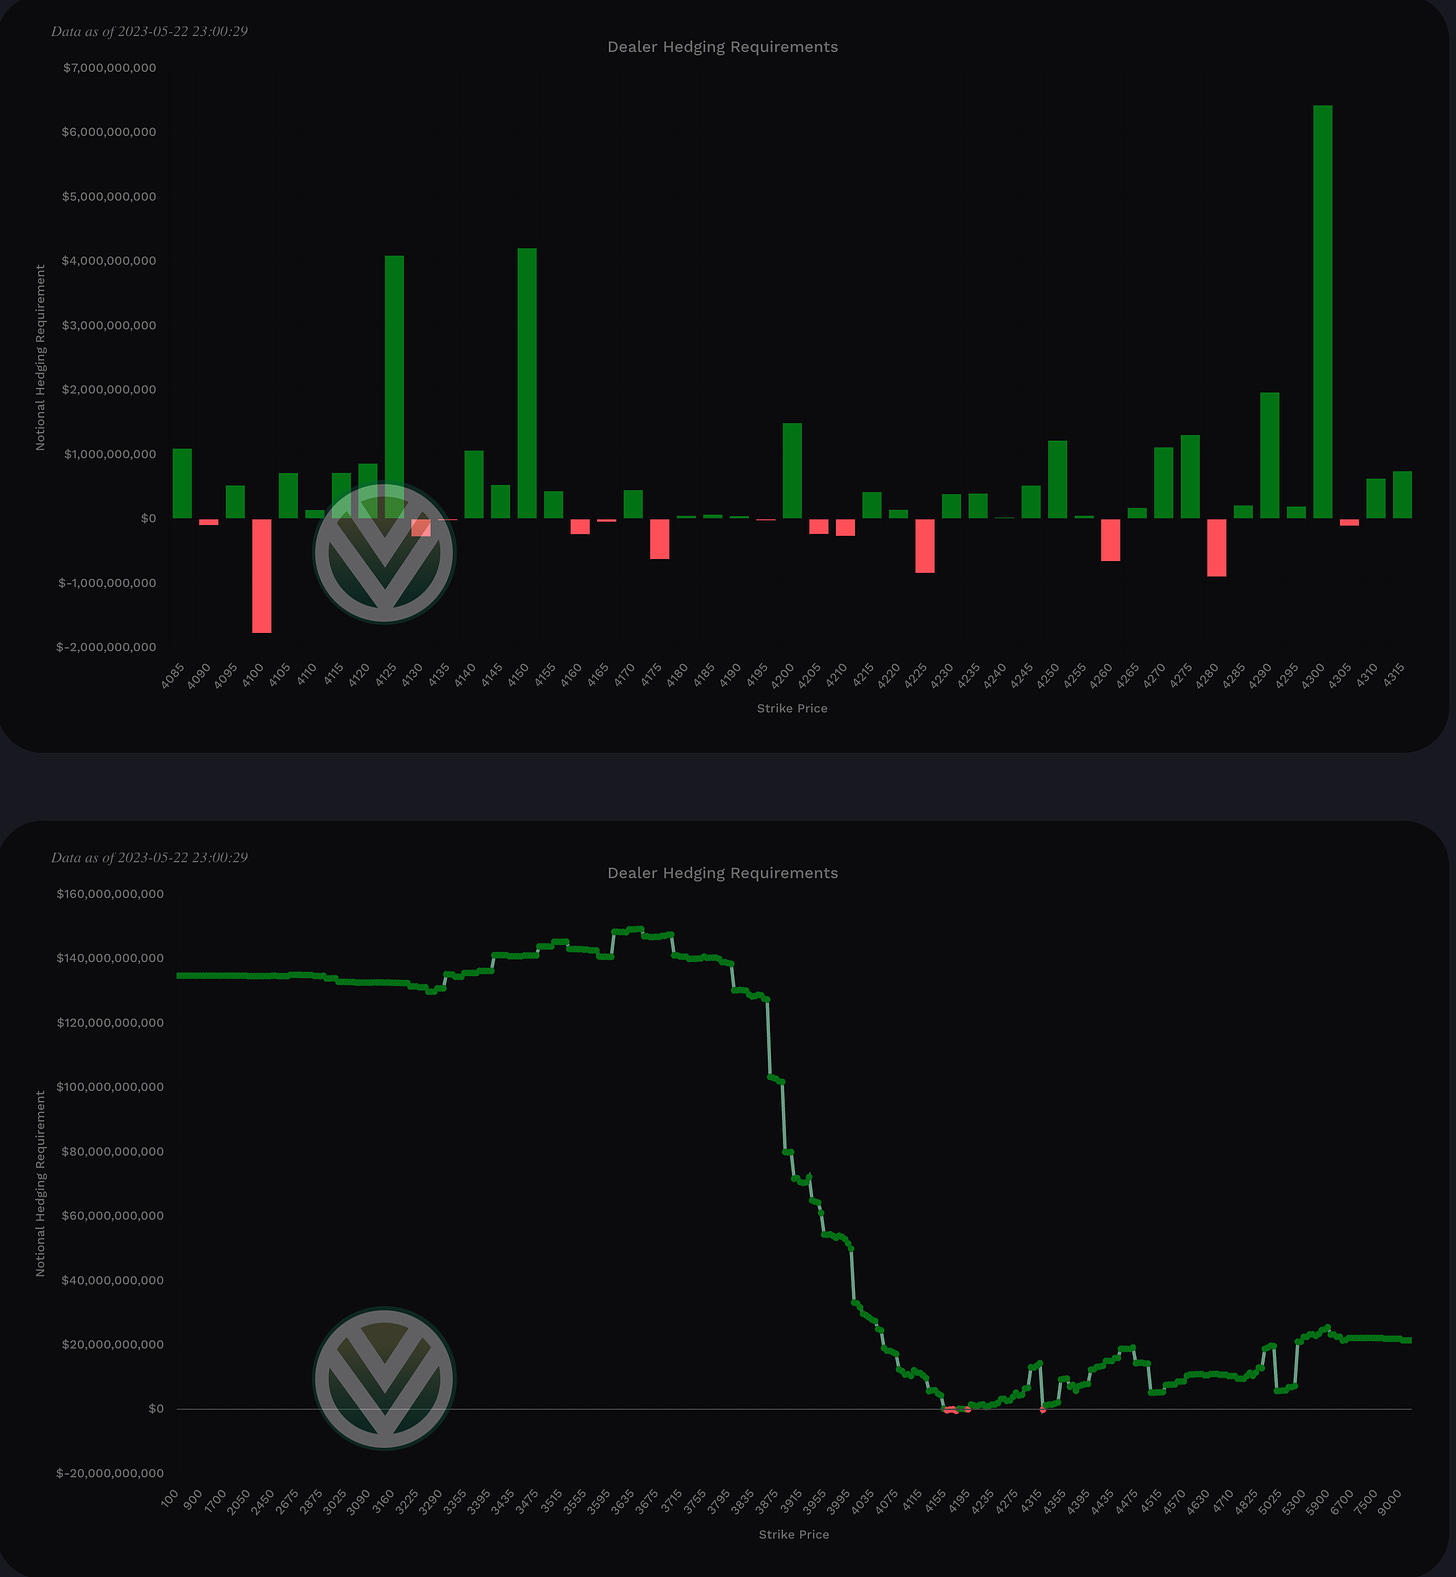
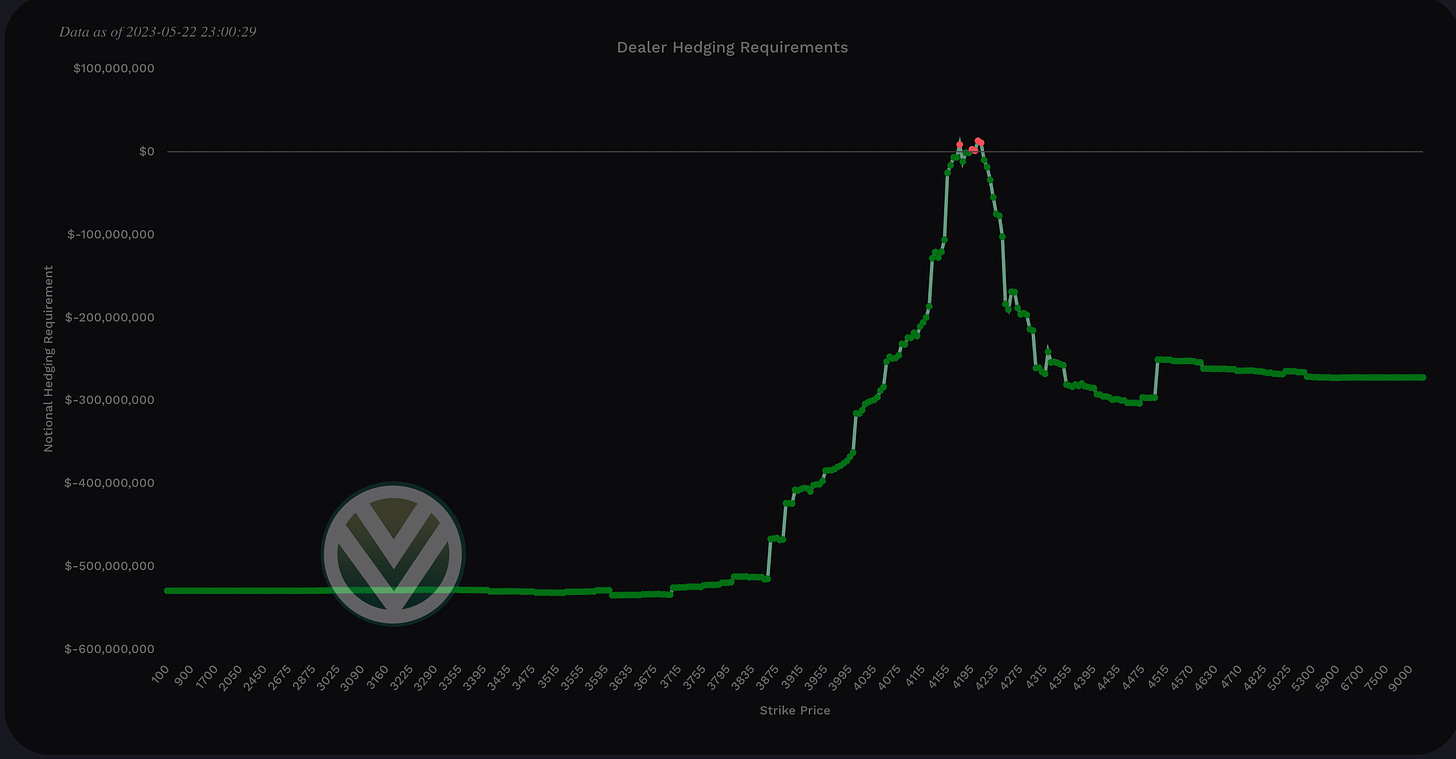
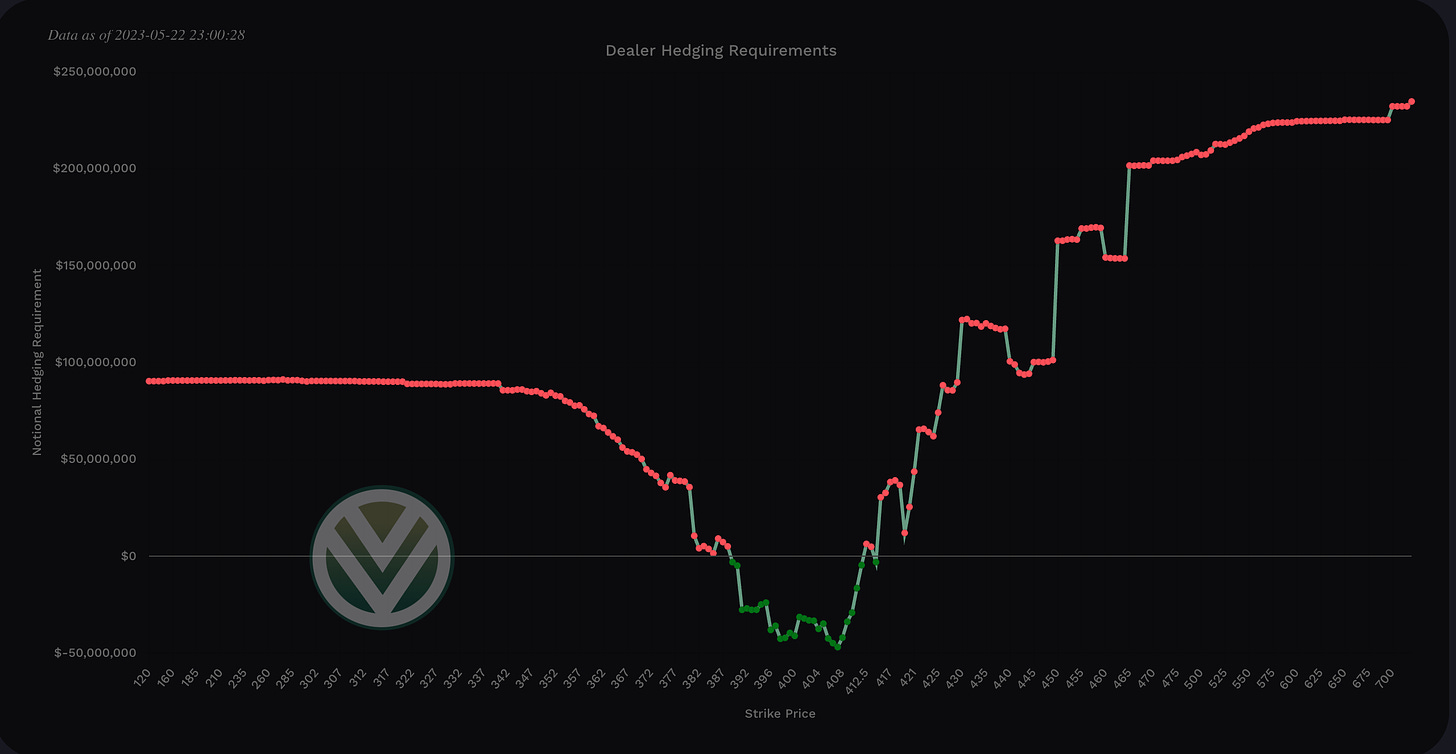
Charm total notional value is bullish - negative is bullish and positive bearish - take the total of the far left and far right values.
When reviewing Charm we also need to account for SPY’s charm. It is leaning bearish.
Note that the total notional value of SPX is 10x. Thus it’s charm will outweigh that of SPY’s. For the full charm effect to play out ideally we want to see SPX and SPY in sync.
To cover our basis…
Welcome to my Substack where I provide a daily SPX trading plan to help guide my intraday trading. The purpose of this letter is not to advice you on your trading or investment decisions. I am simply documenting my daily trading plan for myself to help with planning and execution. These are simply my opinions and the data sourced from the likes of vol.land, TradingView, Quant Data and others. The stock market is risky, gains are not guaranteed. This is not about getting rich quick, but learn to educate yourself and make the necessary financial decisions on your own. This is not financial advice.





👍👍👍