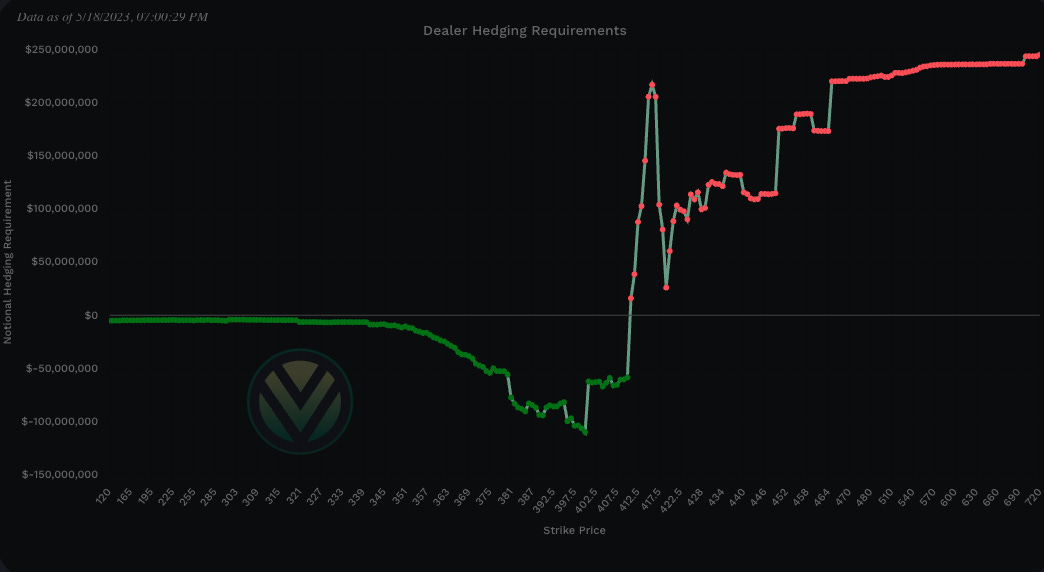
Good evening/day/morning traders. Back to trading and we had our trade plan today provide us with 4 different trade ideas that hit.
As a recap those trade ideas were:
If there is a failed breakdown of 4150 target 4170
Above 4170 target 4185
If there is a failed breakout of 4185 target 4170
If there is a breakout of 4185 target 4205
If you noticed in yesterday’s trade plan we were not bearish unless we were below 4150 and if there were any failed breakouts. This allowed us after the first half hour to take a long where we hadn’t traded a single lot below 4151 to go long until 4170. That broke taking us to 4185, before we faced a FOMC speaker selling off to 4160. That held and we could have taken a long again at 4170, but got the breakout of 4185 which targeted near the HOD at 4205.
This is why we have these key levels and using VOLD or other like indicators to determine the trend and whether we would have continuation of that trend after our levels hit.
Let’s jump into the trade plan.
I enjoy interacting and learning from other traders so continue to share your trades, ideas, and how you use this trade plan by messaging me on Twitter @DarkMatterTrade.
News Catalyst
8:45am est - FOMC Member Williams Speaks
9:00am est - FOMC Member Bowman Speaks
11:00am est - Fed Chair Powell Speaks
As a reminder we are still in earnings season with the following companies reporting this week.
For more information on news events, visit the Economic Calendar
SPX/ES/SPY Trade Plan
Remember you can use this SPX trade plan to trade ES or SPY. ES value is approx. 14pts more than the SPX levels shared below. To get SPY levels simply take the SPX levels below and divide by 10.02.
Bullish bias:
Above 4210 target 4235
If there is a breakout of 4235 target 4260
Use VOLD indicator for trend continuation
VIX should be decreasing
If there is a failed breakdown of 4175 target 4200
Use VOLD indicator for trend reversal
VIX should be decreasing
Bearish bias:
Below 4175 target 4160
If there is a failed breakout of 4200 or 4210 target 4175
Use VOLD indicator for trend reversal
VIX should be increasing
If there is a breakdown of 4175 target 4160
Use VOLD indicator for trend continuation
VIX should be increasing
SPX - The Why Behind the Plan
Key Levels
Above Spot:
4210 - negative vanna
4215 - positive gamma
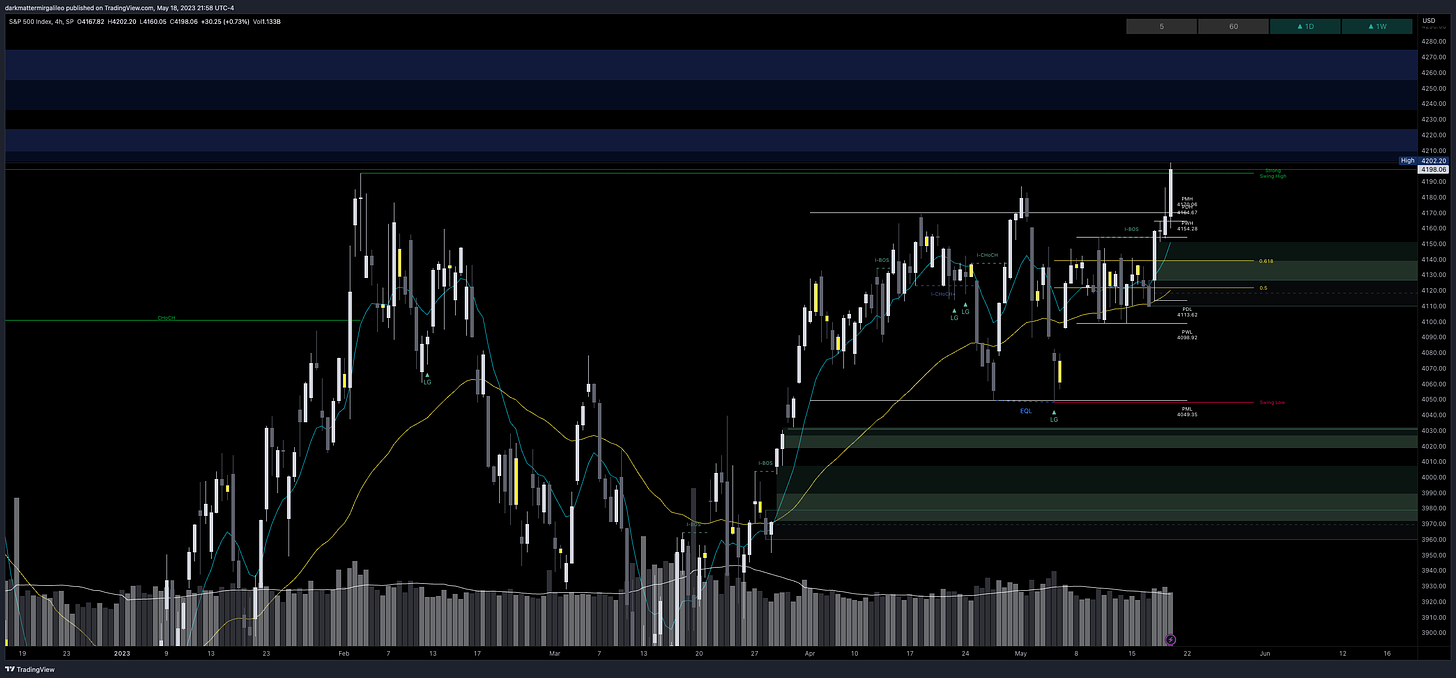
4202-4224 - FVG (4hr chart)
4210 midline
4235 - negative vanna
4240 - positive gamma
4231-4242 - OB (1hr chart)
4260 - negative vanna
4242-4279 - FVG (2hr chart)
4275 - negative vanna
4274-4291 - OB (2hr chart)
Below Spot:
4185 - negative vanna
4175 - negative vanna
4175 - positive gamma
4172-4160 - OB (30min chart)
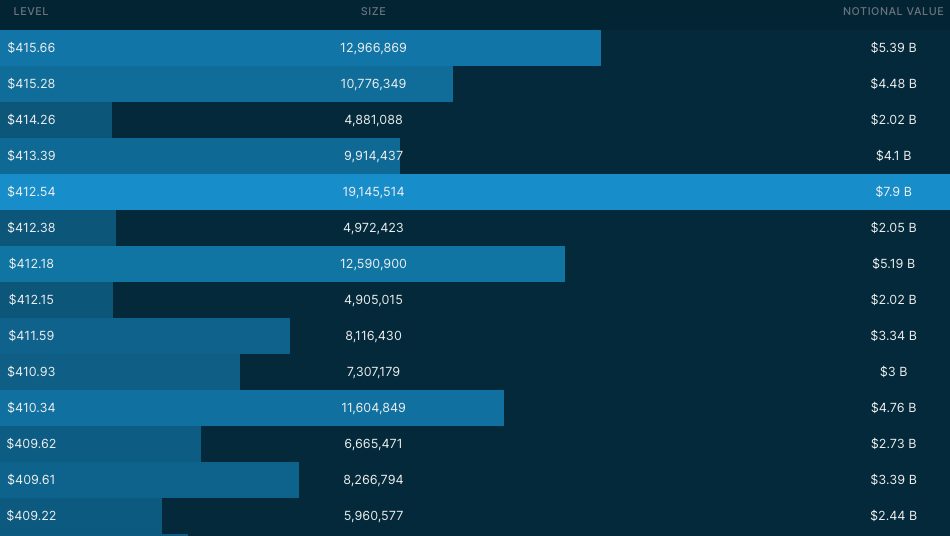
4170-65 - (415.66-415.28) - $9.87B
4160 - negative vanna
4150-4135 - FVG (2hr chart)
4155-45 - (413.39, 414.26) - $6.12B
4130 - negative vanna
4137-33 - (412.54-412.15) - $17.31B
4125-4110 - OB (2hr chart)
Dark Pool Levels
The 4165-70 zone attracted quite a bit of dark pool activity today adding over $4B. This should be a key level you mark on your charts to see if it holds and acts as support or breaks acting as resistance.
4170-65 - (415.66-415.28) - $9.87B
4155-45 - (413.39, 414.26) - $6.12B
4137-33 - (412.54-412.15) - $17.31B
4128-15 - (411.59-410.34) - $11.10B
4108-04 - (409.62-409.22) - $8.56B
4072 - (406.03) - $4.49B
We need to pay attention to these dark pool levels. Mark them on your chart as key levels that we should pay attention to. Remember the levels where we see dark pool prints greater than $2-4B should peak our interest. I get my dark pool levels from Quant Data.
Orderblocks (OB) and Fair Value Gaps (FVG)
These are smart money concepts and some areas I am looking to see how price reacts. I will give higher credence to OB’s whereas FVG’s could be areas of basing/consolidation if they break.
Resistance levels - at these levels I want to see if price rejects to short or consolidates for a push up. I couple this data with Volland, intraday option flows, and Dark Pool levels. Higher timeframe OB’s or FVG will be harder to break. OB’s are the stronger levels over FVG’s.
4202-4224 - FVG (4hr chart)
4210 midline
4231-4242 - OB (1hr chart)
4242-4279 - FVG (2hr chart)
4274-4291 - OB (2hr chart)
Support levels - at these levels I want to see if price rejects to long or consolidates for a push down. I couple this data with Volland, intraday option flows, and Dark Pool levels. Higher timeframe OB’s or FVG will be harder to break. OB’s are the stronger levels over FVG’s.
4172-4160 - OB (30min chart)
4166 midline
4150-4135 - FVG (2hr chart)
4125-4110 - OB (2hr chart)
4104-4098 - OB (15min chart)
4098-4072 - FVG (1hr chart)
4049-4035 - OB (2hr chart)
Weekly Option Expected Move
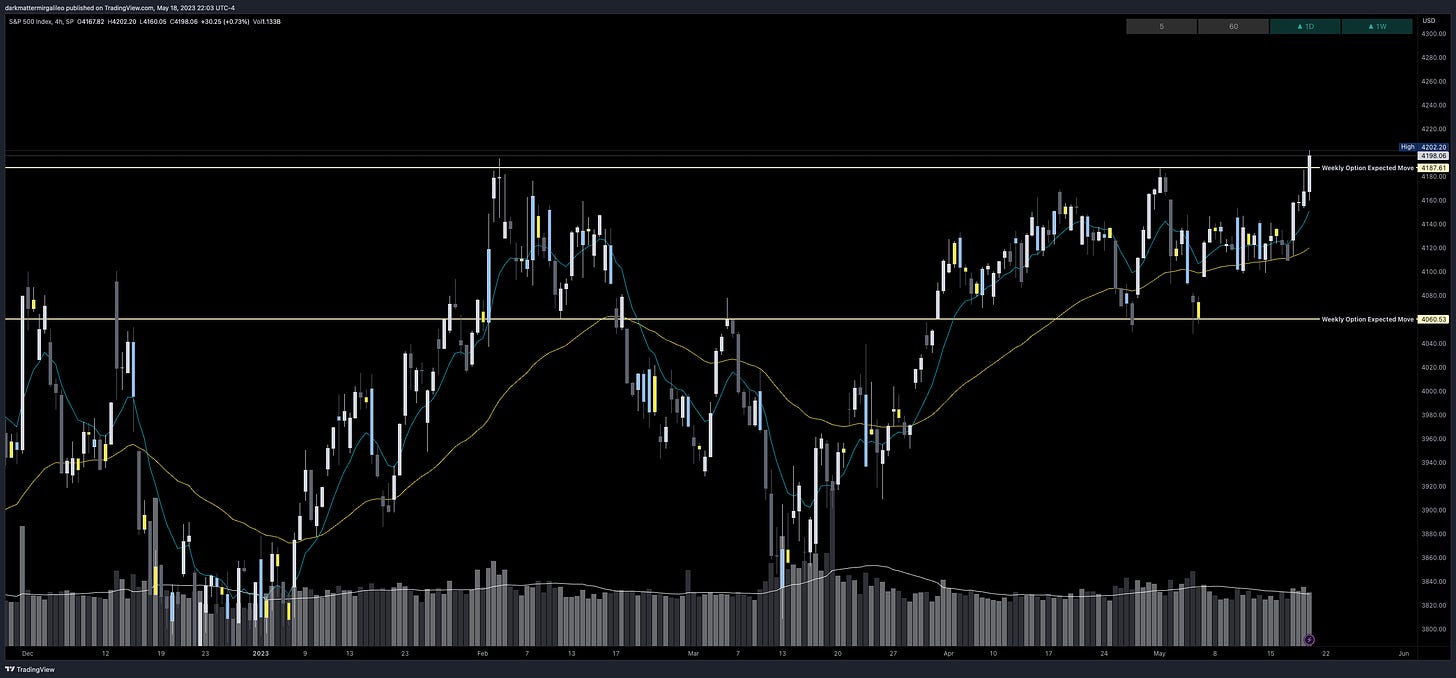
SPX’s weekly option expected move is ~63.54 points. SPY’s expected move is ~6.42. Remember over 68% of the time price will resolve it self in this range by weeks end.
Volland Data
For a better understanding of the various greeks below I would suggest you visit the Volland YouTube Page. Volland provides unique data showing where dealers are positioned providing in my opinion a higher degree of conviction to where price may move to.
Vanna - Levels where price may repel or act as magnet
Remember for price to go above spot through a magnet or repellent VIX and IV must decrease or stay flat. For price to go below spot through a magnet or repellent VIX and IV must increase.
Positive vanna - will act as magnet
Negative vanna - will act as repellent
When price goes through a positive or negative level it will flip it - ie negative becomes positive and vice versa.
Above Spot:
4210 - negative vanna
4235 - negative vanna
4260 - negative vanna
4275 - negative vanna
Below Spot:
4185 - negative vanna
4175 - negative vanna
4160 - negative vanna
4130 - negative vanna
4100 - negative vanna
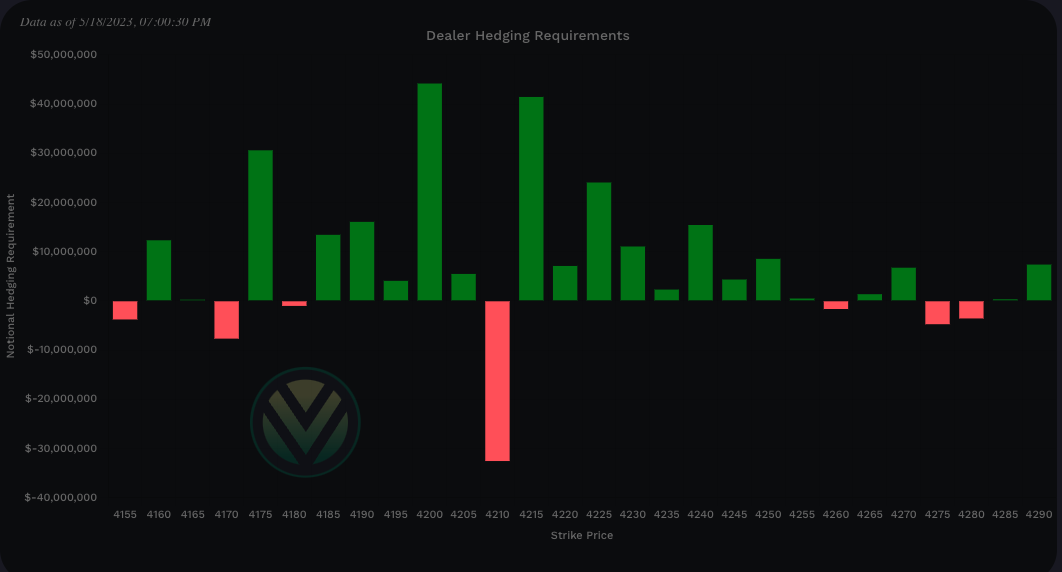
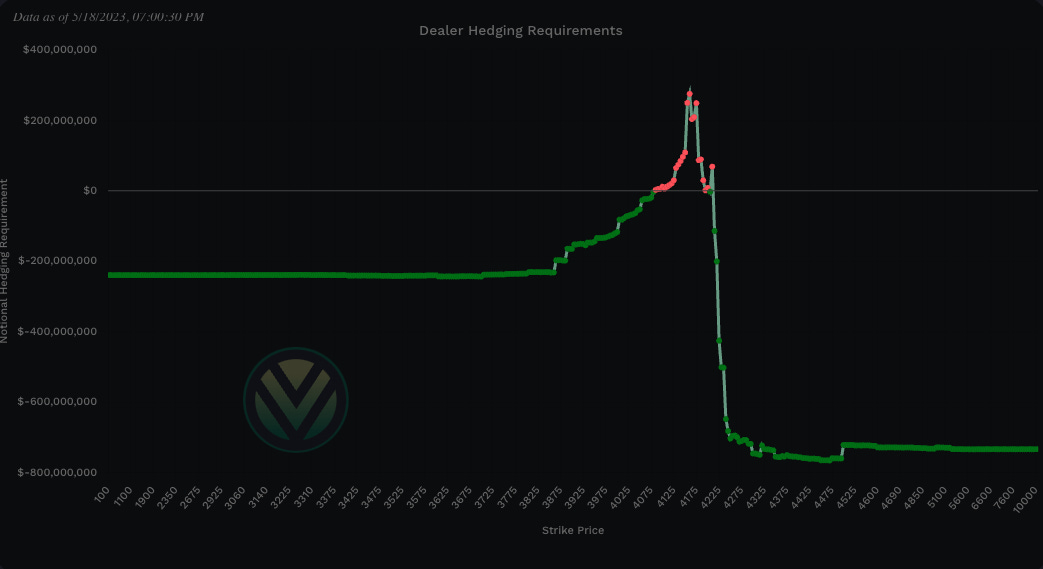
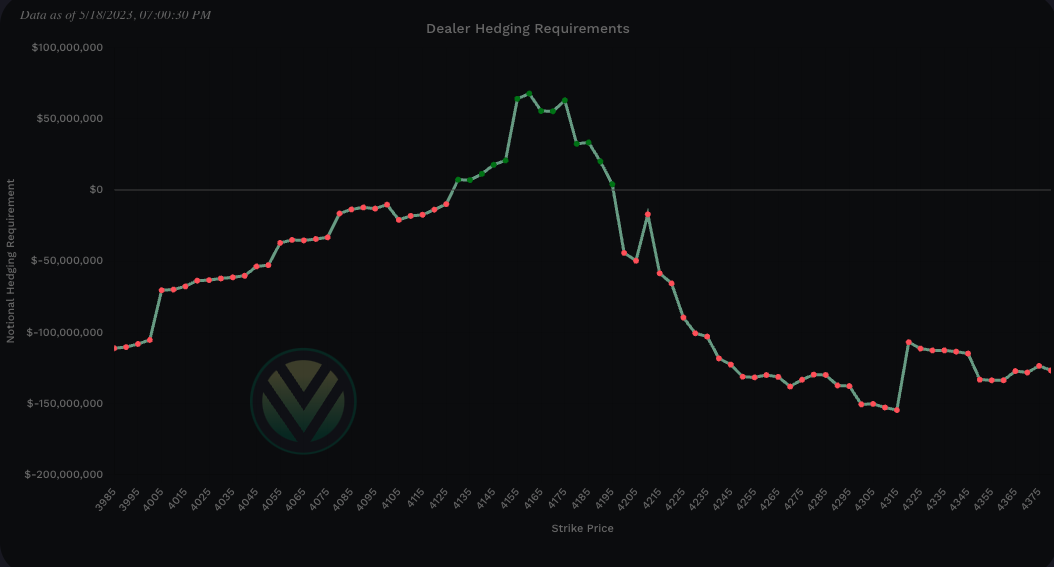
Gamma and Delta-Adjusted Gamma (DAG)
Positive Gamma Above Spot - acts as resistance
Positive Gamma Below Spot - acts as support
Negative Gamma - becomes permissive to price as it moves there - aka neither resistance nor support - simply just chillin and watching what’s happening…
Above Spot:
4215 - positive gamma
4225-30 - positive gamma
4240 - positive gamma
Dealers must sell all levels above spot till 4195
Below Spot:
4200 - positive gamma
4190 - positive gamma
4175 - positive gamma
4165 - positive gamma
Dealers must sell below 4125
Charm
Charm total notional value is bullish - negative is bullish and positive bearish - take the total of the far left and far right values.
When reviewing Charm we also need to account for SPY’s charm. It is leaning bearish.
Note that the total notional value of SPX is 10x. Thus it’s charm will outweigh that of SPY’s. For the full charm effect to play out ideally we want to see SPX and SPY in sync.
To cover our basis…
Welcome to my Substack where I provide a daily SPX trading plan to help guide my intraday trading. The purpose of this letter is not to advice you on your trading or investment decisions. I am simply documenting my daily trading plan for myself to help with planning and execution. These are simply my opinions and the data sourced from the likes of vol.land, TradingView, Quant Data and others. The stock market is risky, gains are not guaranteed. This is not about getting rich quick, but learn to educate yourself and make the necessary financial decisions on your own. This is not financial advice.


