March 6, 2024 SPX, ES, SPY Trade Plan
Market Recap
Hello team after an early bumpy ride to begin the day - and personally a bit of breaking my own rules of waiting until the 10 am news broke - I initially went long to capture a ride back towards 5120-5130 to then short.
I held a very tight stop loss and where I would flip my bias was a break of 5100. At 5095 I went short - approx 10:15am candle after the retest of 5100 failed. From there I rode it down to 5080 where I took profits per the trade plan…
If VIX continues going up then a breakdown of 5100 targets 5080
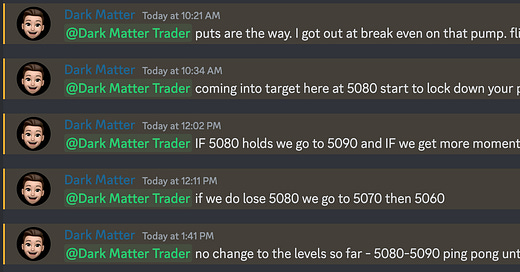
From here price went on to trade back towards 5090 where we faced further resistance and in the discord we called for this rally and potential ping pong zone between 5080-5090 until it broke. To the downside we provided 5070 and 5060 as targets and we got exactly that…
The end of the day was quite interesting and I can point it to a few reasons…
We hit a key technical level - last week’s VAL at 5066
We hit another key technical level - broke below last week’s candle
Created an engulfing candle
We tested near a key value area - February’s value area high
0DTE options flow shifted extremely fast and here’s how…
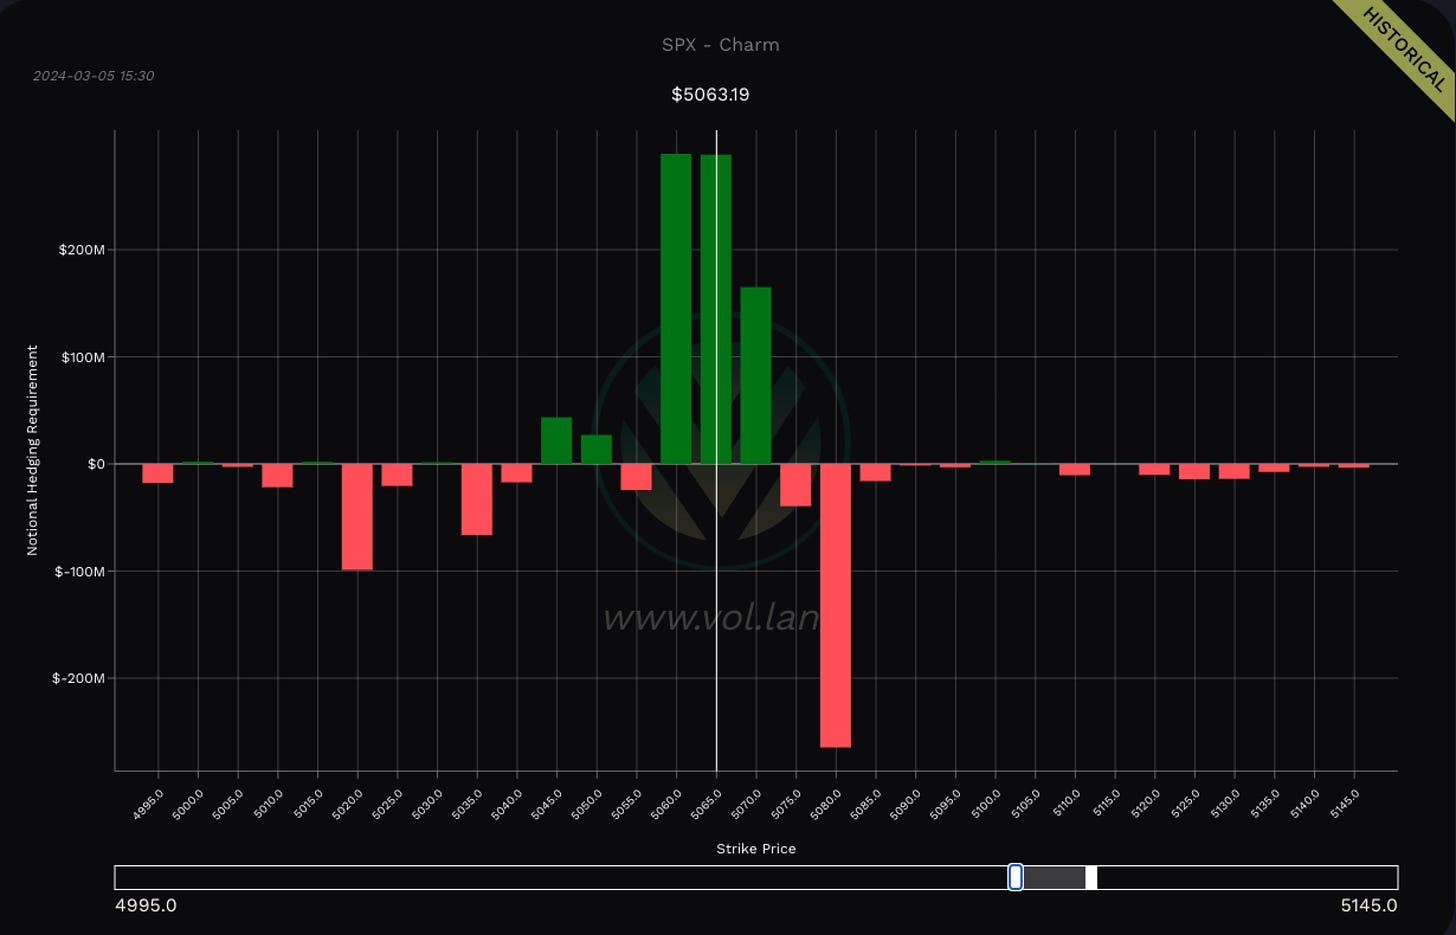
At 15:30 we had a bearish anti-gex paradigm as seen in the below options flow via Volland where 5060 is the target and balance between it and 5055 - our low was 5056…
Along with that do you see the large red bar at 5080? If I was trading and watching this in real time I bet once we hit that 5060 level the 0DTE paradigm turned into a sidal, which for having still a half hour of trading caused the dealers to hedge by pushing price back towards 5080 where the market and their books were at “balance”
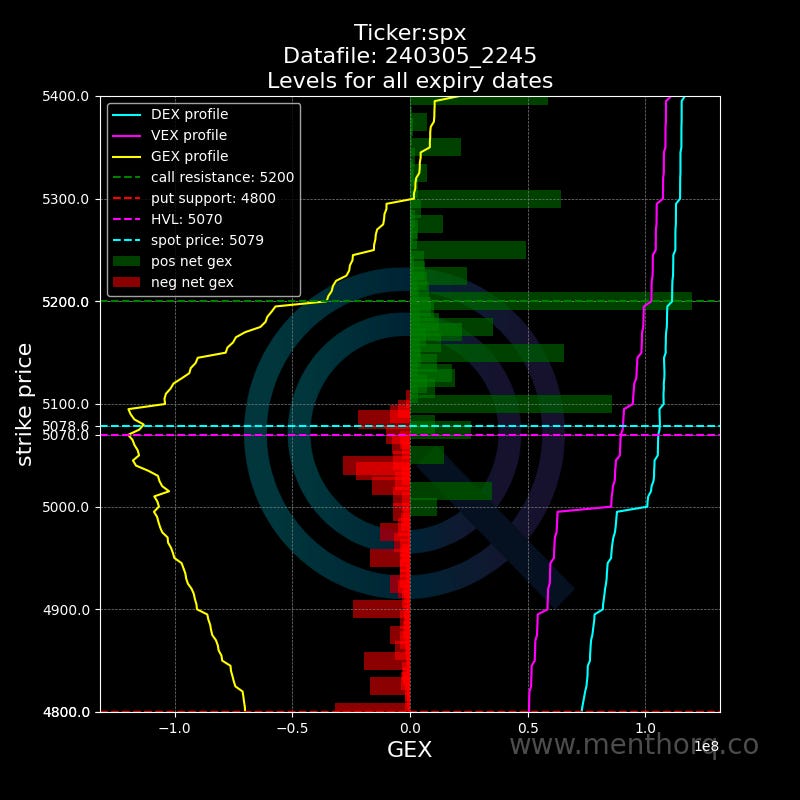
Here is an updated view on Gamma levels. See the yellow line which is the gamma profile this tells us if we are in a positive or gamma condition. During this run up we have been in a positive gamma profile and that means price will tend to magnet to the positive green bars aka buy the dip sell the rips…
In one day this yellow line has now diverted back to a neutral zone. Will continue to watch this but as we get into negative gamma territory dealers are more likely to assist in a selloff than to buy any dips…This is why we are not quite yet ready to jump full port into put swings until we see this profile shift as price could shift back upwards towards 5100 and then 5150 then 5200…
We can see from a 0DTE view, next day, and March expiry that short term we are still in a bearish market with a target low of 5035 and 5120 as its high.
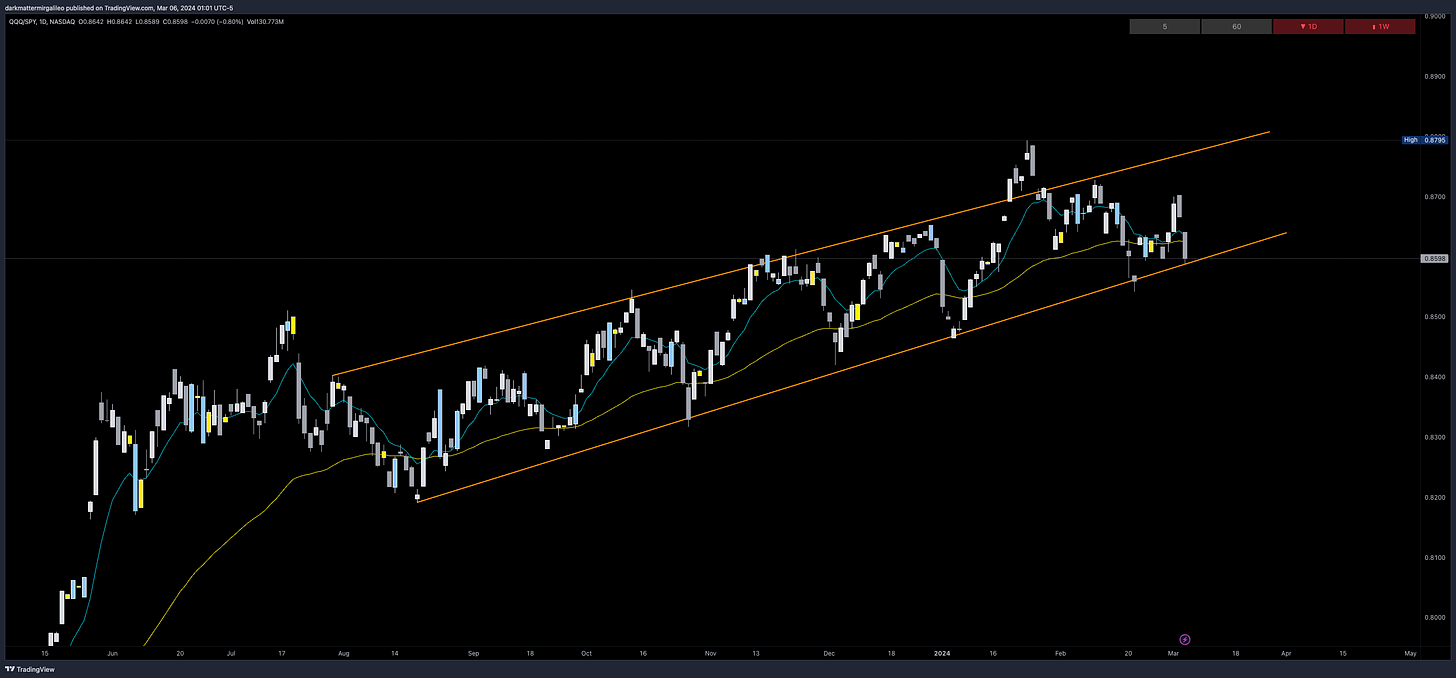
One additional chart I would add is the QQQ/SPY combo - it shows you the relative strength in these indices. Of note is this channel that price has traded in since last August. A break below this channel and a few consecutive closes below this channel could give us that additional confirmation on shorting on a larger timeframe.
With that recap let’s jump into our trade plan….
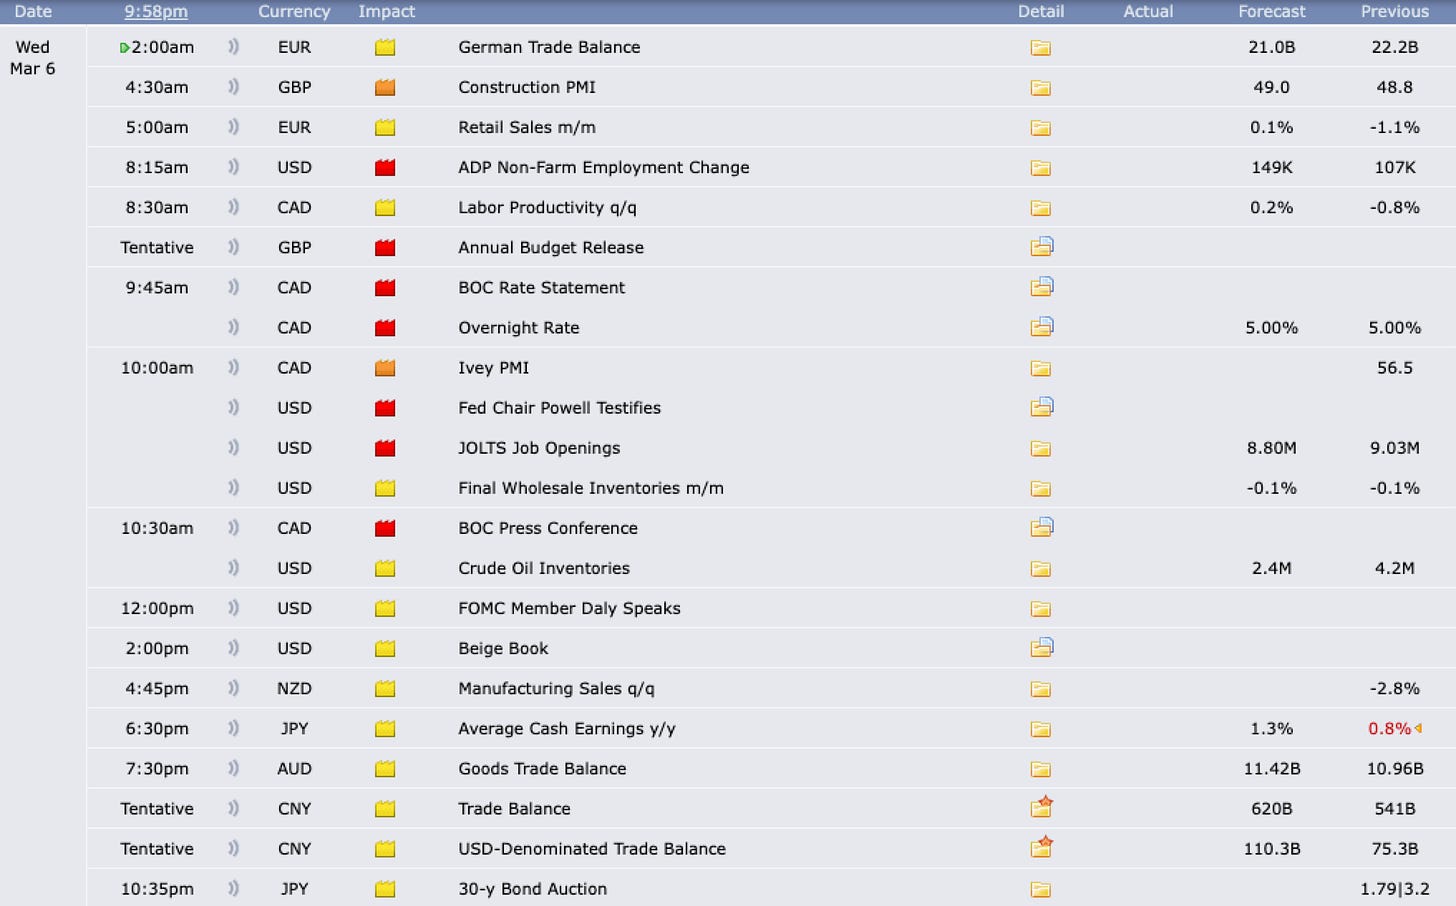
3/6 News Catalysts
We start premarket with ADP Non-Farm Jobs Data, followed by BOC’s Rate Statement after the open, JOLTS Job Openings, and then Powell’s testimony to the House Financial Services Committee.
For more information on news events, visit the Economic Calendar
Just a reminder for those not subscribed to the newsletter your access will end here for you.

You can still join us for the rest of the plan where we discuss key levels and entries to take and targets.

There is a 5 day free trial for access into our new Discord channel.
SUBSCRIBE
Keep reading with a 7-day free trial
Subscribe to Dark Matter Trade to keep reading this post and get 7 days of free access to the full post archives.

