Hello fellow traders hope you all had a great weekend and were able to enjoy some time with loved ones and find a break in between. I am well rested from a vacation and now time to kick into gear as we have a full action packed week.
Last session trading recap
Looking back on Friday and a call out that Gamma levels would most likely carry the market came true similar to how it did Thursday. With little hedging done by the dealers prior to the session, the dealers needed to support any moves the market gave it and boy did the bulls push and the bears got weak.
So looking at Friday’s Gamma levels and our trade plan that anything above 3995 takes you to 4030 and it did where we based for a bit of time before marching towards the next Gamma level at 4050.
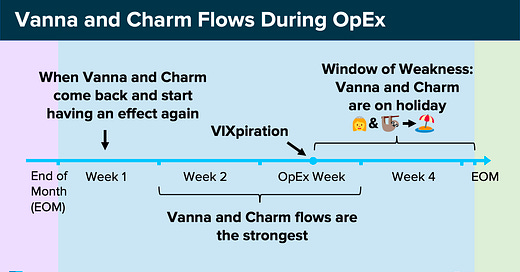
Reminder: Vanna and Charm come back and start to have an effect again. So don’t hedge your bets ONLY on Gamma like we did for the past two trading sessions. This is why Captain and myself work hard to learn about all of the intricacies of a strategy to catch as many of the surprises as possible. With that said, let’s jump into the trade plan.
I enjoy interacting and learning from other traders so continue to share your trades, ideas, and how you use this trade plan by messaging me on Twitter @DarkMatterTrade.
News Catalyst
This week will bring a lot of volatility. We avoid it Monday, but this week brings Powell’s testimony to the Senate Banking Committee, Jolts Job Openings, the Bank of Japan’s Monetary Policy Statement, and non-farm employment along with the average hourly earnings reports.
Stay nimble, be careful, and manage your risk around these events.
No major events for Monday
For more information on these news events, visit the Economic Calendar
SPX/ES/SPY Trade Plan
Remember you can use this SPX trade plan to trade ES or SPY.
Bullish bias:
Above 4075-80 target 4115
If there is a breakout of 4055-60 target 4075
If there is a failed breakdown of 4040 target 4055
If there is a failed breakdown of 4005-10 target 4035
Bearish bias:
Below 4040 target 4010
If there is a breakdown of 4005 target 3985
If there is a failed breakout above 4075 target 4060
SPX - The Why Behind the Plan
Volume Profile
Let’s review the volume profile and some key levels there. If you are unfamiliar with the Volume Profile I highly suggest reviewing some YouTube videos or reading this quick overview on it.
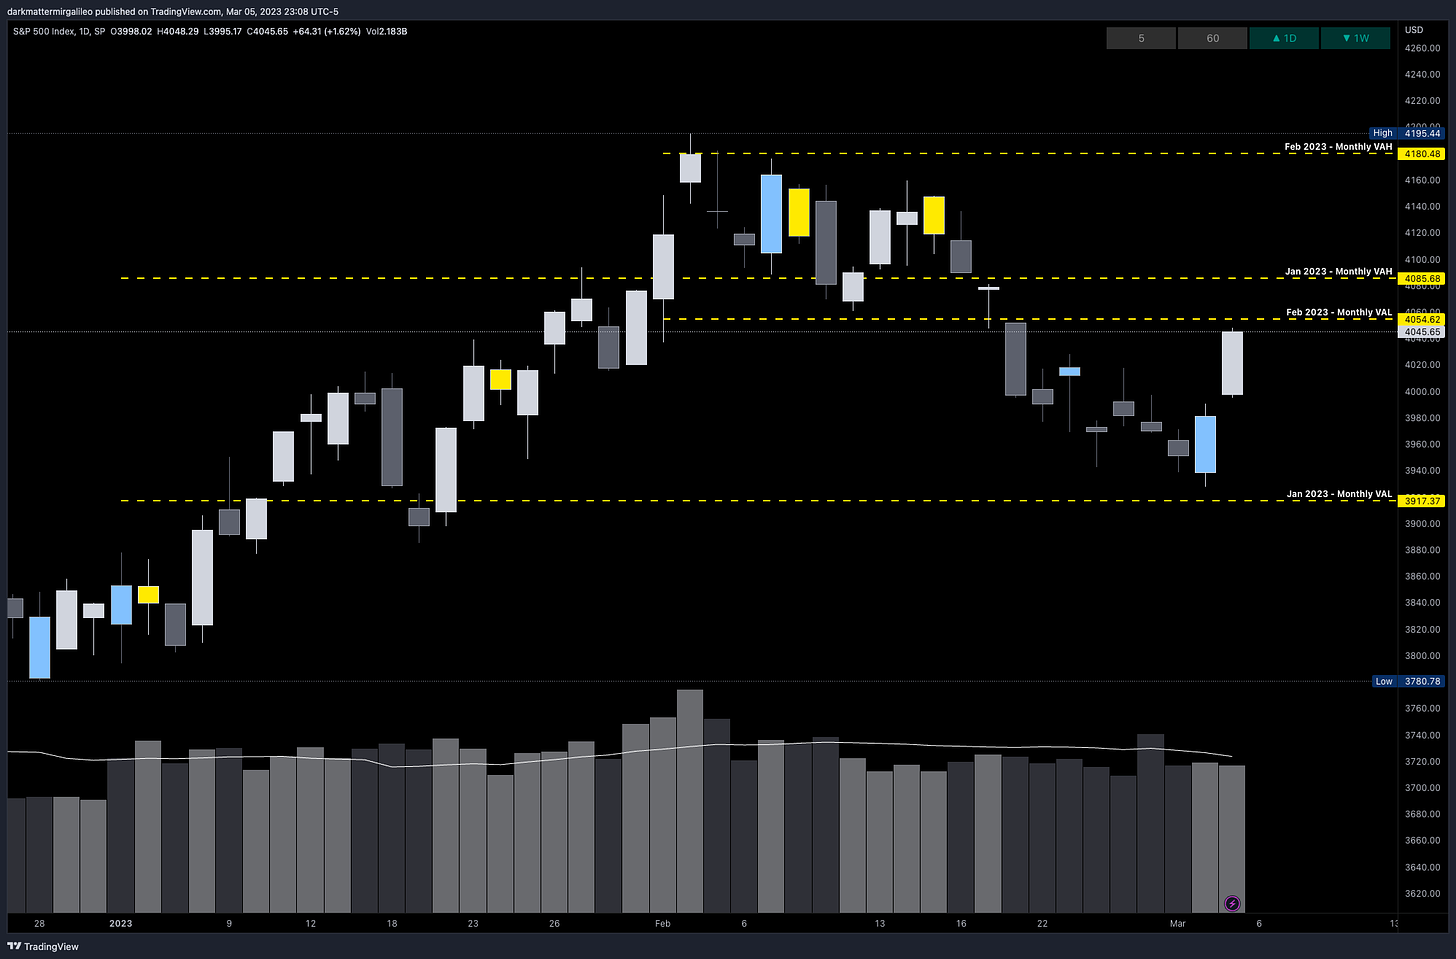
Monthly Levels:
4085-3917
We currently sit in January’s Value Area
4054
We are chasing February’s Value Area Low
This will be a key critical level for the rally to continue
4085
This is January’s Value Area High
A key critical level if the bulls want to continue higher or if sellers reemerge
4180
This is February’s Value Area High
A key critical level if the bulls want to continue higher or if sellers reemerge
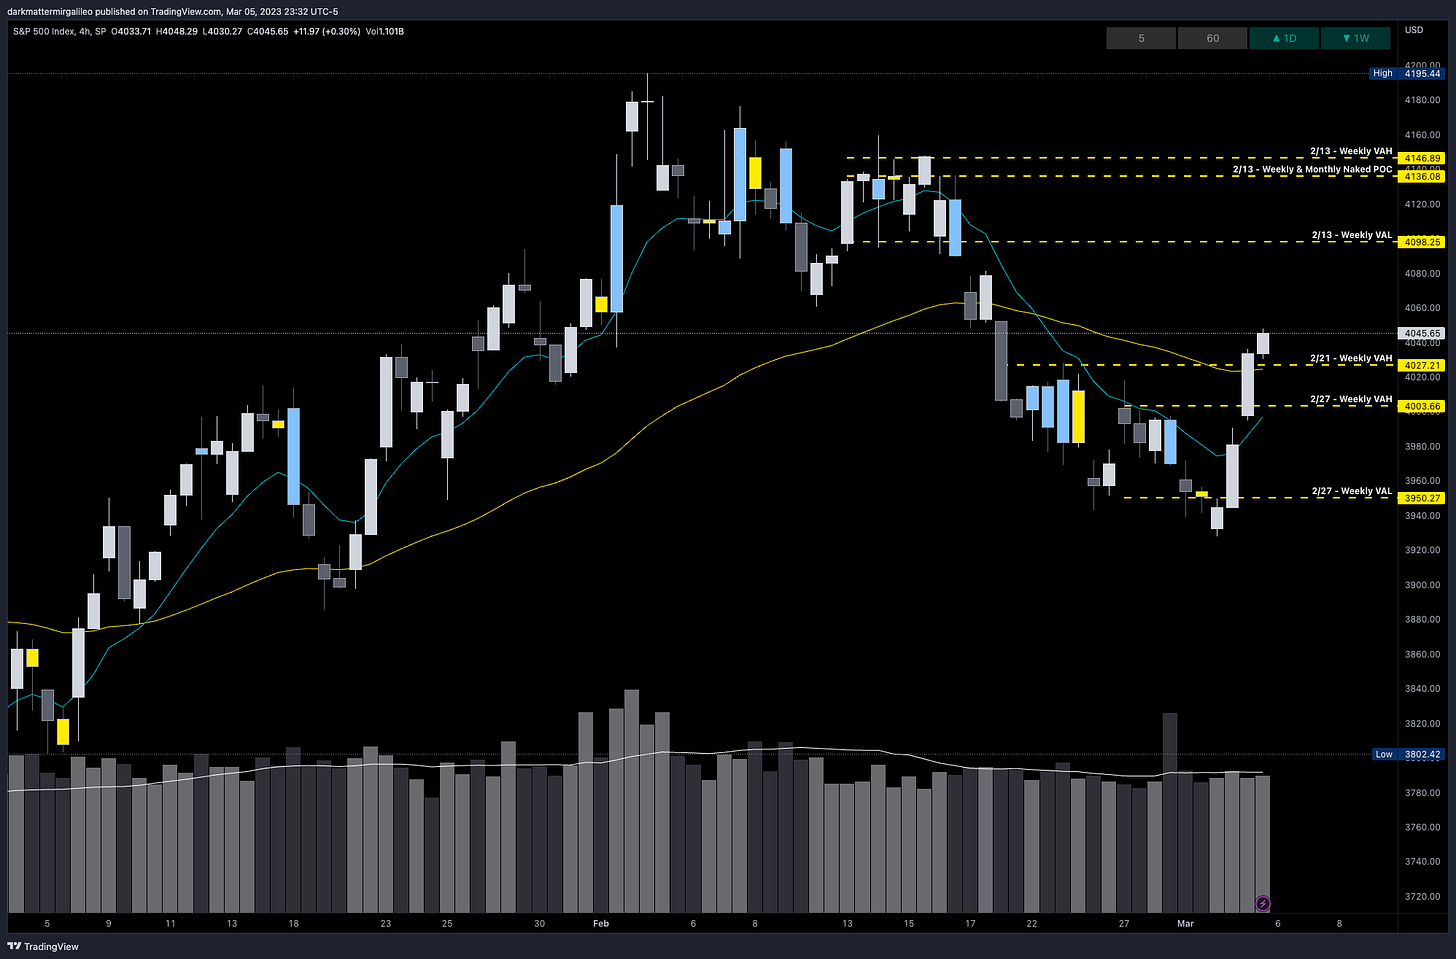
Weekly Levels:
4003
This is the 2/27 Weekly Value Area High
Could be a potential area for a retest and if holds a nice long opportunity
4027
This is the 2/21 Weekly Value Area High
Could be a potential area for a retest and if holds a nice long opportunity
4098
This is the 2/13 Weekly Value Area Low
A key critical level if the bulls want to continue higher or if sellers reemerge
4136
This level holds major weight
It is a naked point of control - hasn’t been tested and is a POC on the weekly and monthly volume profile
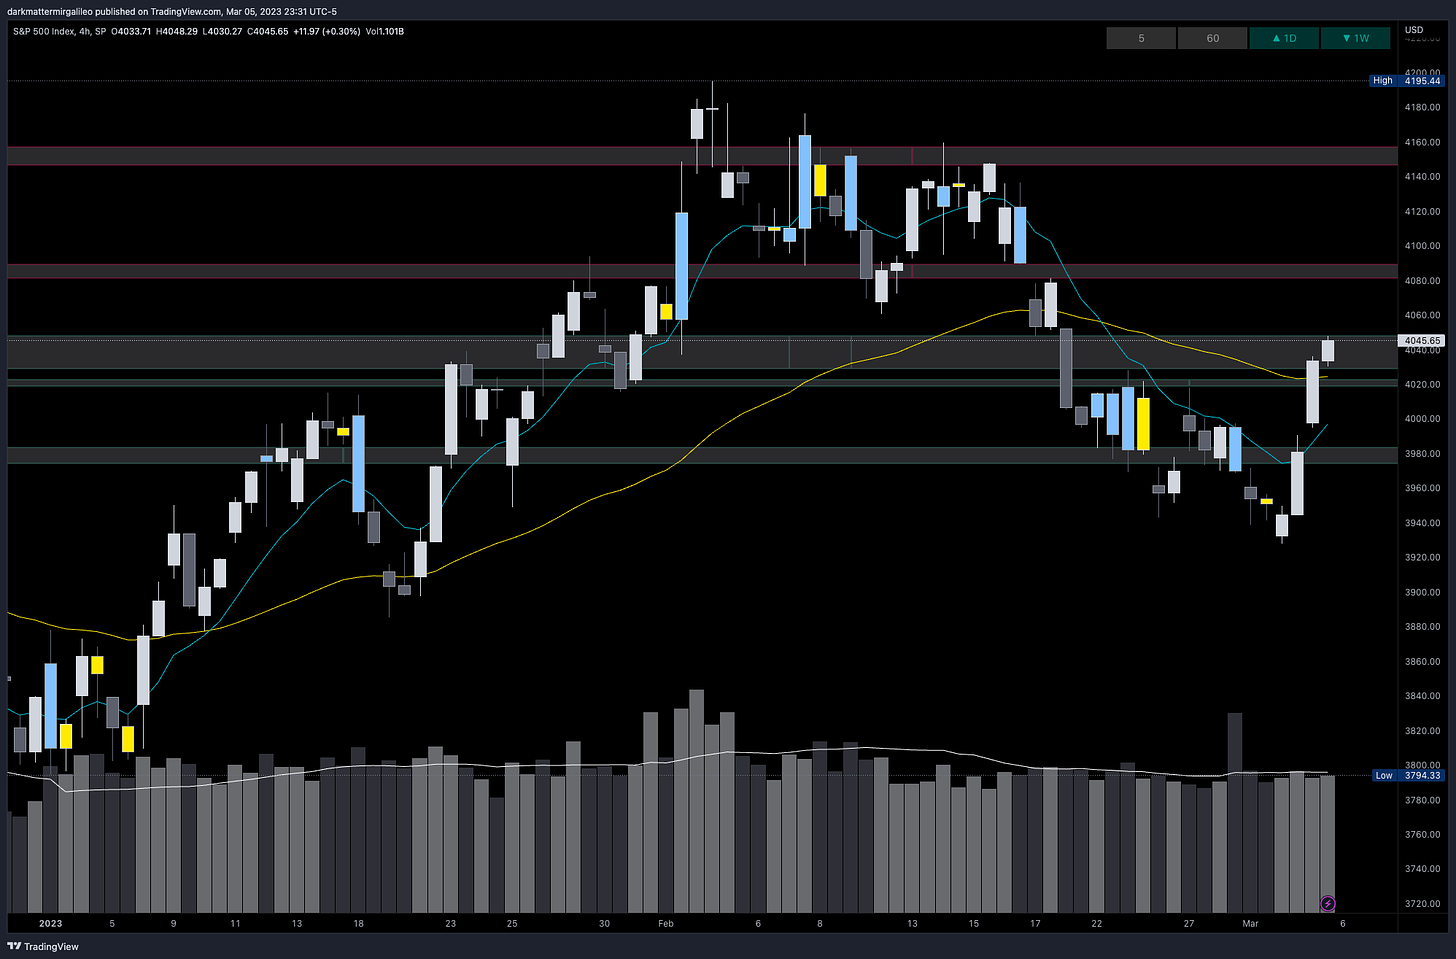
Low Volume Nodes:
These are important as they are typically where money maker’s or larger institutions come in. They typically will direct a reversal acting as support or resistance.
4029-4048
We are currently sitting in a low volume node where price did sell off during the EOD on Friday
This means we could go down just as easy as we can go up
4081-4089
This is the next LVN to the upside and where price could act as supply
4145-4157
Another LVN to the upside where price could act as supply
4018-4023
Could act as support
3983-3974
Trendlines
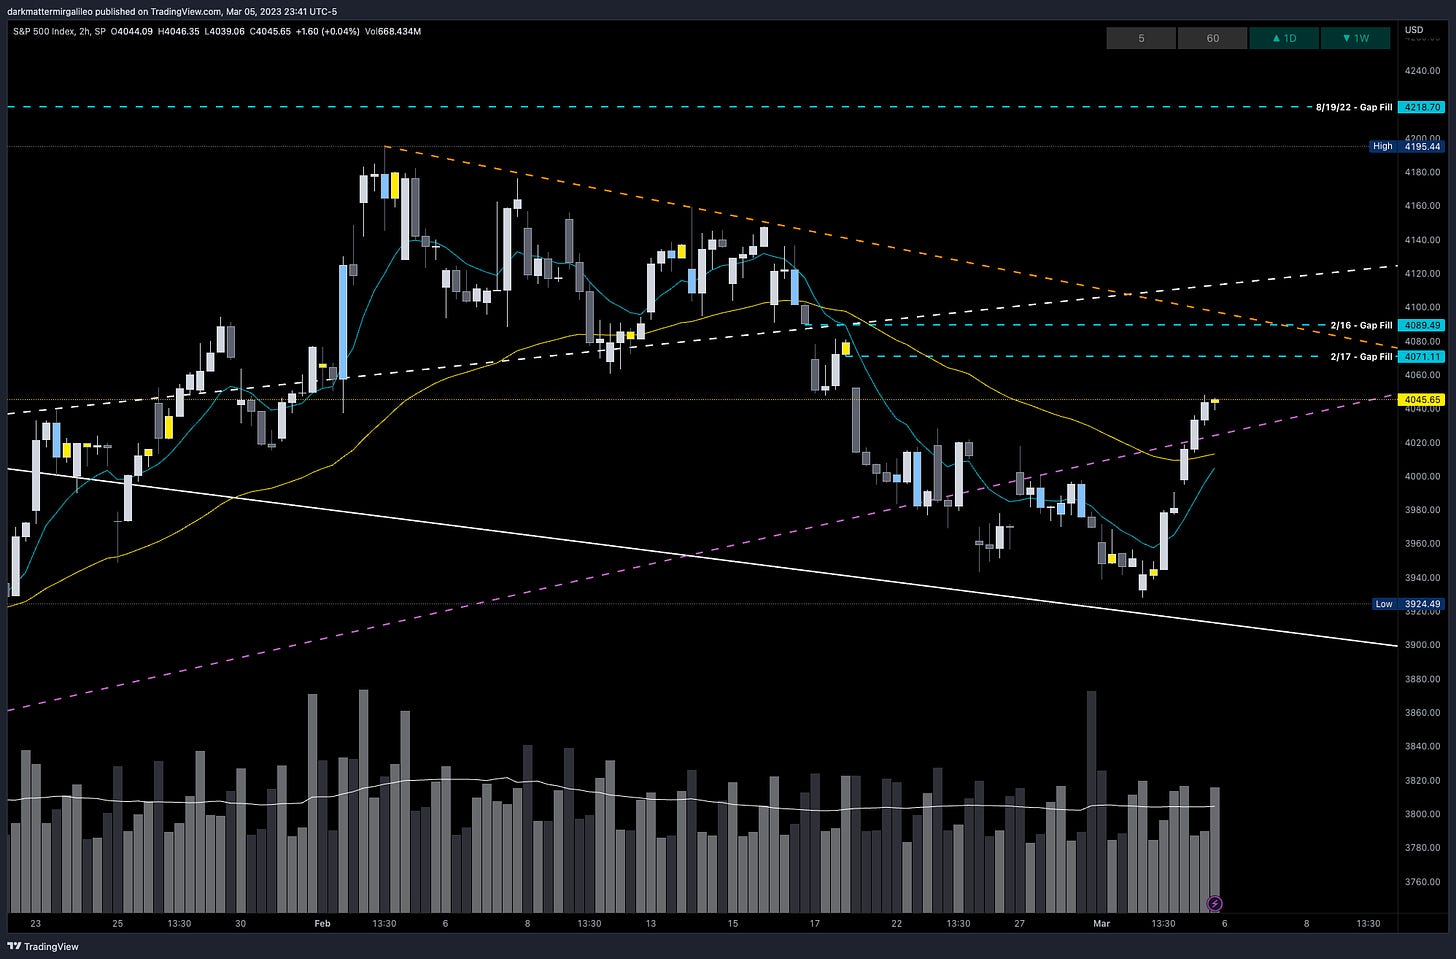
After the last two day’s of the market rallying we are now back above our October 2022 lows. On ES we did test our January 2022 ATH downtrend, but not on SPX - although it came close.
Orange - This is now our resistance trendline
Purple - This trendline is from our October 2022 lows
White Solid - this trendline is the down trendline from the ATH’s in January 2022; we broke above this trendline, but price seems to be making its way back to it
White Dotted - This is the Covid low trendline
We have gaps to fill at 4071, 4089, and 4218
Weekly Option Expected Move
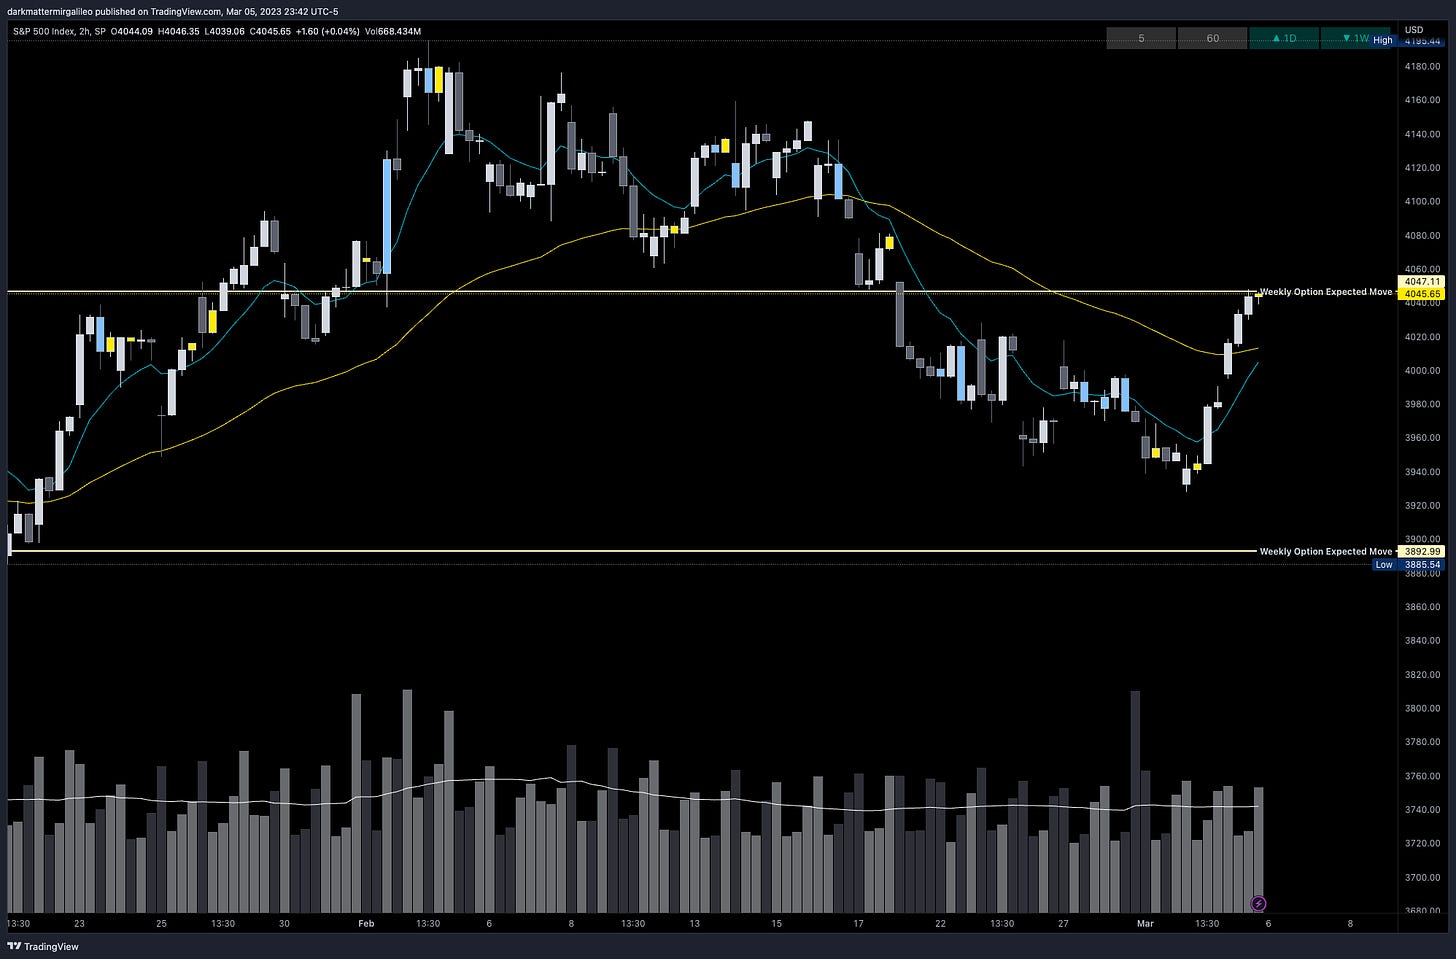
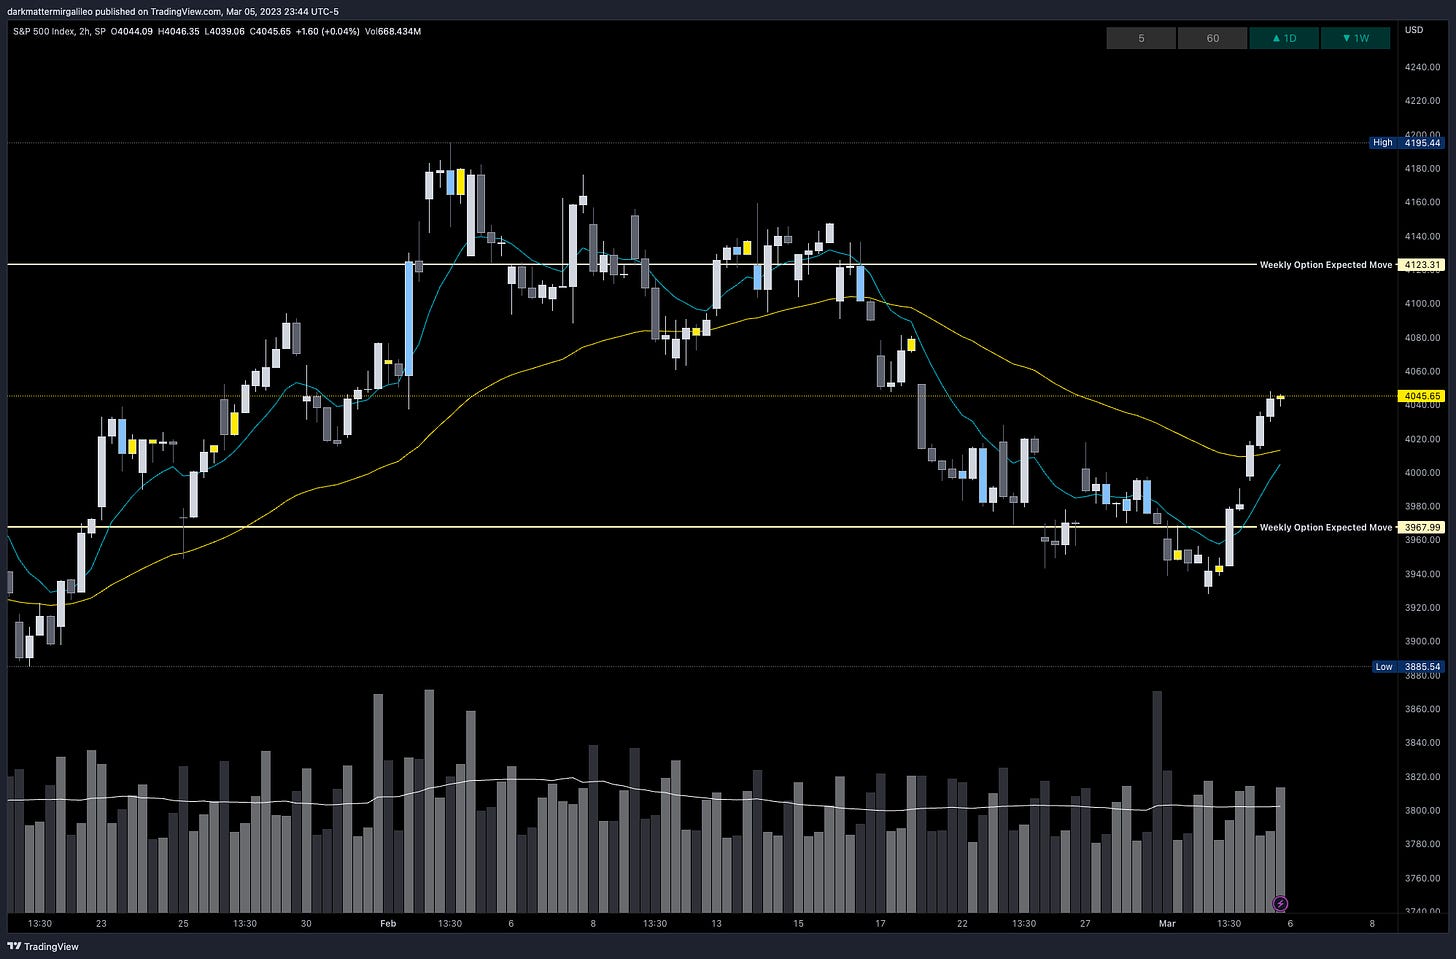
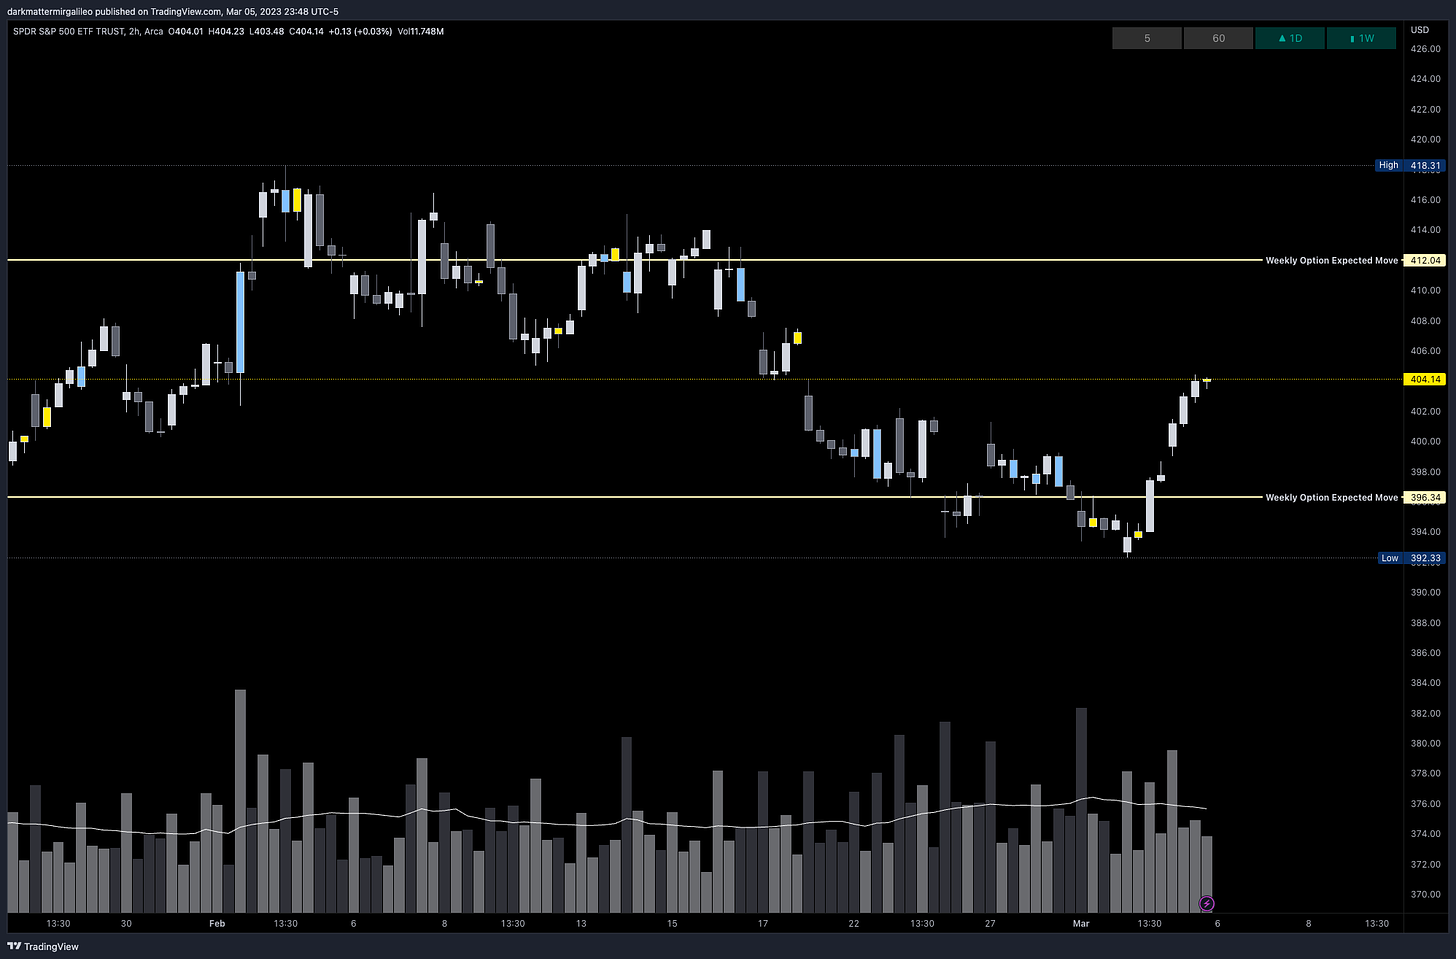
Last weeks weekly options expected move hit right to the upside. After coming close to tagging the downside move the rally took us all the way back up to the top end of the weekly options move. Just insane how often this works and we will continue to keep tracking it.
3/6 Expected Move:
SPX’s weekly option expected move is ~77.66 points. SPY’s expected move is ~7.85. Remember over 68% of the time price will resolve it self in this range by weeks end.
Let’s not predict, let’s jump into the dealer data below.
VIX Update
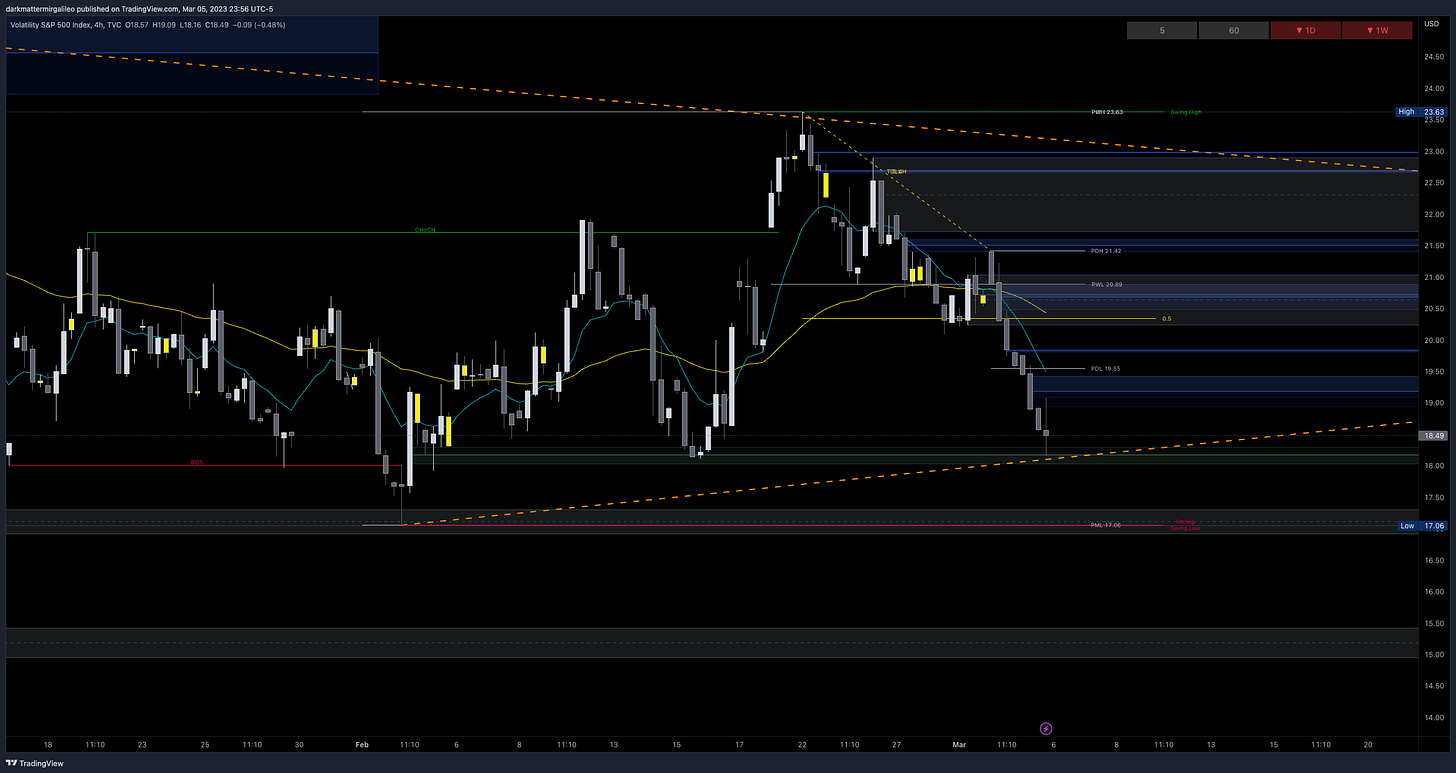
Let’s review the VIX chart. Basically fear in the markets deflated the end of the week…
We sold off into one of our support levels at 18.5 and right at our trendline from the lows of February.
If we cannot hold the 18.30-18.05 fair value gap, expect the VIX to test the orderblock at 17.30-16.93. Below that we see 15.44-14.95.
Above, 18.96-19.44 could provide resistance followed by 20.25-21.03.
Remember, typically VIX going down correlates with a uptrend in the market and vice versa for a downtrend in the market.
Vol.land Data
For a better understanding of the various greeks below I would suggest you visit the Volland YouTube Page. Volland provides unique data showing where dealers are positioned providing in my opinion a higher degree of conviction to where price may move to.
Vanna - Levels where price may repel or act as magnet
Remember for price to go above spot through a magnet or repellent VIX and IV must decrease or stay flat. For price to go below spot through a magnet or repellent VIX and IV must increase.
Above Spot:
4050 is a positive vanna - acting as magnet
4055-4060 are negative vanna’s - acting as repellent
4065-4070 are positive vanna’s - acting as magnet
4075 is a negative vanna - acting as repellent
4080-4115 are positive vanna’s - acting as magnet
In order to get through this area we need VIX to decrease
4120 is a negative vanna - acting as repellent
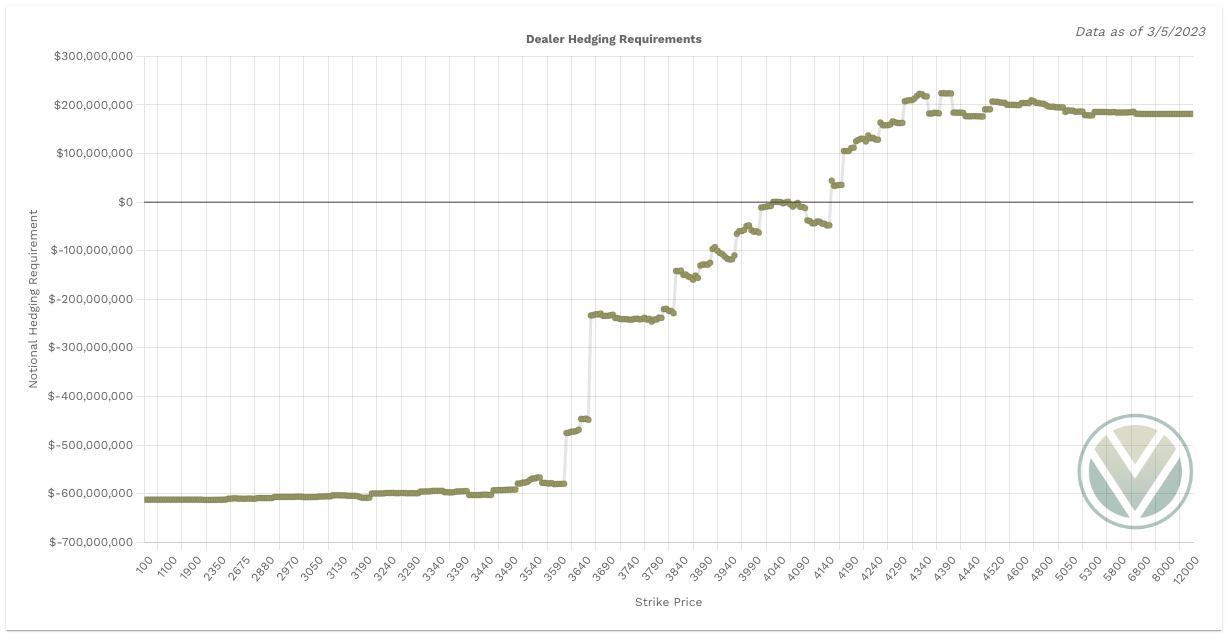
On the line graph, vanna is positive above 4060 all the way to 4145
Below Spot:
4045-4040 are negative vanna’s - acting as repellent
4035-4010 are positive vanna’s - acting as magnet
4005 is a negative vanna - acting as repellent
4000-3985 are positive vanna’s - acting as magnet
3980 is a negative vanna - acting as repellent
On the line graph, vanna is neutral until 4030 and becomes positive at 4025
This means price will magnet more to the downside as we break 4030
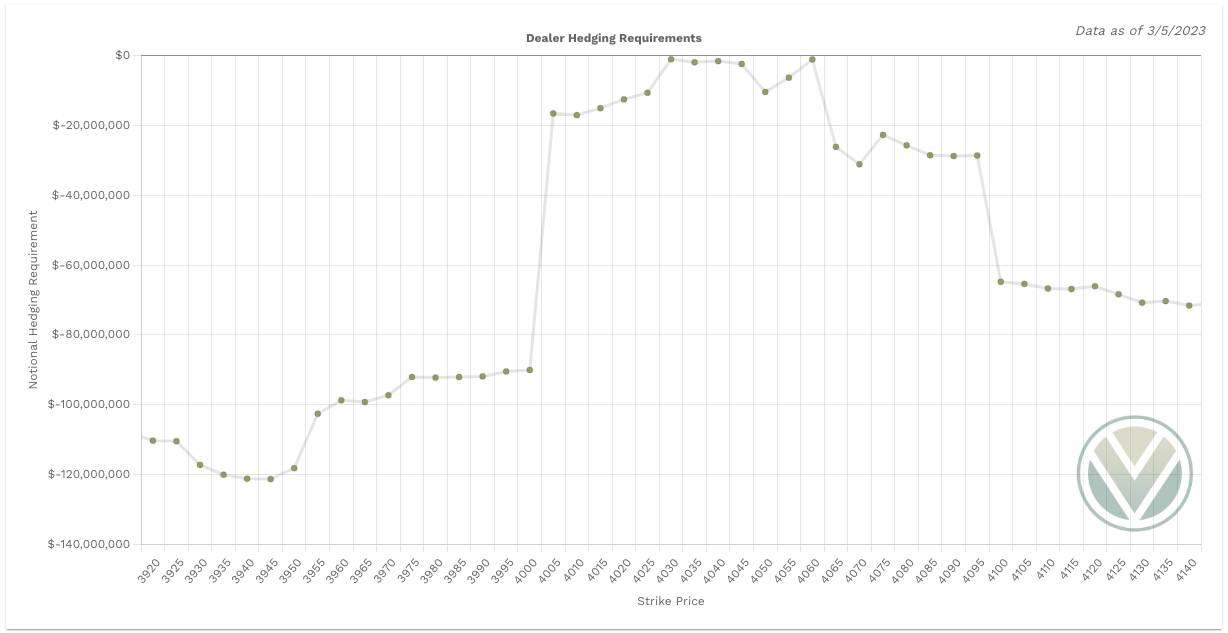
Gamma and Delta-Adjusted Gamma (DAG)
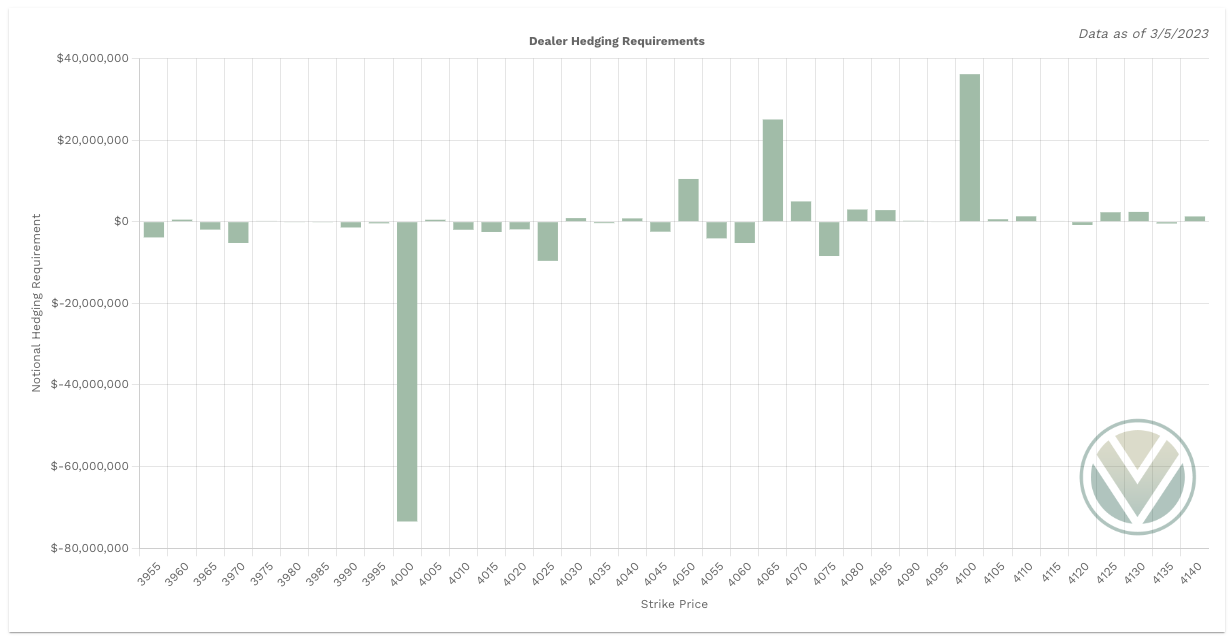
Above Spot:
4050 is a positive Gamma - acting as resistance
4065-70 is positive Gamma - acting as resistance
4080-85 is positive Gamma - acting as resistance
4100-15 is a positive Gamma - acting as resistance
4125-30 is a positive Gamma - acting as resistance
No price level shows dealer buying pressure
Below Spot:
4040 is positive Gamma - acting as support
4030 is positive Gamma - acting as support
4025-4010 is a cluster of negative Gamma
Since this zone has no dealer hedging requirements, the market is able to move freely in between it - doesn’t mean it travels up and down freely, just that dealers won’t impact the move
4005 is positive Gamma - acting as support
3960 is positive Gamma - acting as support
All price levels show an increase in dealer selling pressure
Charm
Charm has taken a more bullish tone on SPX. This could suggest a buying the dip mentality to the market.
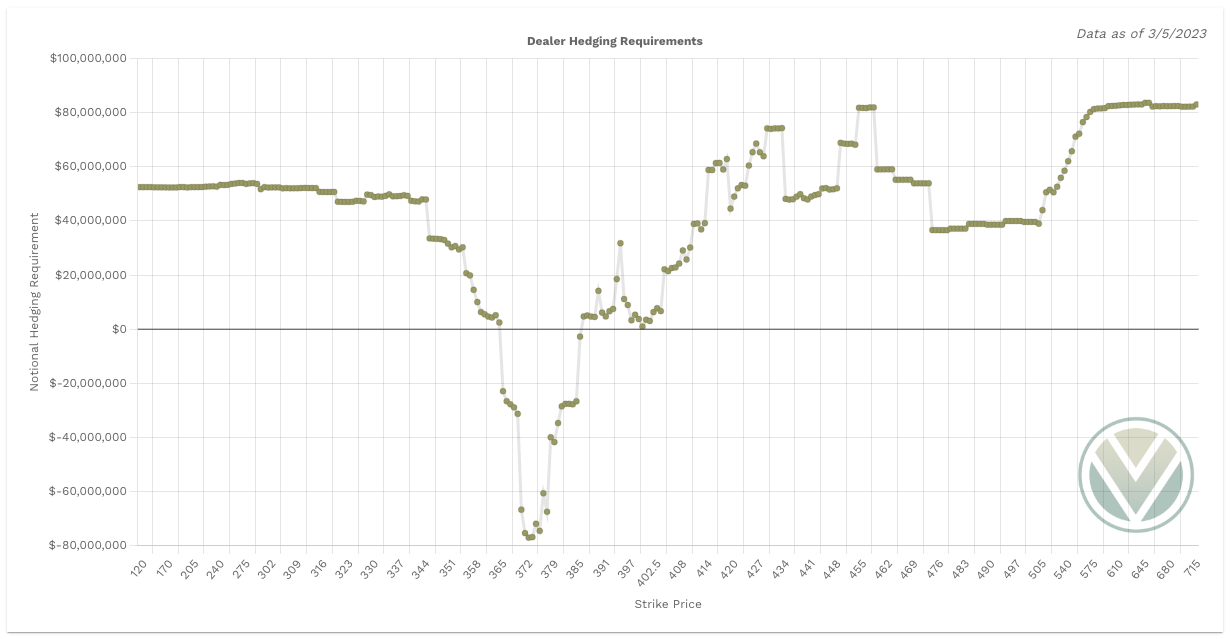
When reviewing Charm we also need to account for SPY’s charm. It is leaning bearish. Between the totals of SPY and SPX, SPX charm will outweigh SPY and thus I wouldn’t be shock if we see Charm kick in with a buy the drip market mentality.
Keep in mind the total notional value of SPX should be multiplied by 10 for comparison to SPY.
Final Take
Based on the data we could see a rally into the 4050-4060 zone where we might see some resistance. I want to be bullish above 4080, price action between 4050-4080 is chop and filled with traps to the upside or downside - it’s an area of contention. There are opportunities to scalp though - for example above 4060 will take you to 4075.
4005
4020
4040
4050
4060
4080
4090
4115
Reminder that Vanna and Charm flows are strongest starting this week into next week’s OPEX. Pay close attention to the Vanna levels and the potential direction Charm indicates for us.
Stay #paytient and react to the key levels - no predictions! Good luck traders.
I am going to share my key rules to intraday trading in the end of the plan moving forward to build better habits and allowing you to grow as a better trader.
My Intraday Trading Rules
I do not trade within the first half hour UNLESS I am in a trade from the prior session and looking to close the trade or we have a major gap or a key level already broken
I let the initial balance do its thing - I am just a small fish in a large ocean of traders so let's let them fight it out
I then wait for key levels targeting one level to the next and taking profits at each one.
If there are key levels that are 10pts apart that is when I have scalping mindset and anything above 10pts I want to give it the room to hit the price target with a 5 pt buffer to take profits once we reach within 5 pts of a target - I also tighten my stop loss once at 10-20% profit with the goal of never allowing trades to go red when I have a nice profit)
I supply options greeks with OB (order blocks) and FVG (fair value gaps) otherwise known as Smart Money Concepts
When I am scalping - ie targeting 10pt trade levels I will take profits and never go more than 10% red. Simple as that, know your trade plan strategy and the risk. When you are wrong you are wrong and reset
For 20pt trade level targets I will increase my stop losses to 20% and allow more of the trade to play in the event I entered too early
I try - key word try ha - avoid trading lunch hours defined as 12pm to 2 pm est. Money for the most part unless you are scalping - is made in the first 2 hours of the trading day and the last 2 hours
I always stick to two EMA’s on my chart and that’s the 10/50 EMA’s
When the 10ema is above 50ema we are bullish
When the 10ema is below the 50ema we are bearish
Go put these on your charts and when you view them on timeframes less than the daily timeframe you will see the power they provide
For scalpers out there the smaller timeframes provide great opportunities to scalp 5-10pt moves
There are more we could discuss including volume profile, low volume nodes that I think are great strategies to compliment option greeks. Maybe in the future we can include more details.
Trading is not for the unprepared. It is critical you abide to a strategy and checklist and walk into every trade with a plan. Without a plan you are simply gambling and have a better chance at the slot machines. There are more nuances to my weekly and daily checklists, but I think this provides a good read for now and we will/can continue adding to it.
To cover our basis…
Welcome to my Substack where I provide a daily SPX trading plan to help guide my intraday trading. The purpose of this letter is not to advice you on your trading or investment decisions. I am simply documenting my daily trading plan for myself to help with planning and execution. These are simply my opinions and the data sourced from the likes of vol.land, TradingView, Tradytics and others. The stock market is risky, gains are not guaranteed. This is not about getting rich quick, but learn to educate yourself and make the necessary financial decisions on your own. This is not financial advice.

