Good evening/day/morning traders. Yesterday’s trade plan was right on the spot with our bearish bias playing out after the first half hour after the opening session where we tagged the high of the day near 3980 and saw a sell off from there.
Last session trading recap
Overall great day as I was busy most of the day, but was able to trade the power hour. On these types of days when I am unable to trade the morning time, I don’t force it. Looking back at the chart our trade plan was dead on. We said…
Below 3985 target 3970
You basically could have traded this idea twice today within the first 4 hours of the trading session and the second time taking us to 3950.
Again, my trades came end of the day where SPX held the trendline from this months low - it continues to be a spot of interest and a trendline to add to your charts - see below for more details. With that trendline and Net Flow data from Quant Data I was able to close on $500 profit with the majority of those profits coming after the 4pm bell where I closed out my calls and locked in my profits.
I also felt safe with calls using one of our trade idea of a failed breakdown. Additionally if a zone is retaken like 3965 was I am looking to long it then with a tight stop loss in the event I am wrong…This market is a ping pong game, clear one sided trend days are hard to come by and the market acts more like a kangaroo more times than not. So be ready to play both sides and keep these key levels in mind.
If there is a failed breakdown of 3965-70 or 3985 target 4005
I then waited and saw some of the ER’s from MU and LULU and waited for a dip and bought into more calls during the after hours and am holding those overnight.
Remember…Stay #paytient, compound, the gains will ultimately come. Put in the work, prepare, and it will pay off.
I enjoy interacting and learning from other traders so continue to share your trades, ideas, and how you use this trade plan by messaging me on Twitter @DarkMatterTrade.
News Catalyst
Light day of news…
10am est - Pending Home Sales
For more information on news events, visit the Economic Calendar
SPX/ES/SPY Trade Plan
Remember you can use this SPX trade plan to trade ES or SPY. ES values are approx. 30pts more than the SPX levels shared below.
Bullish bias:
Above 3980 target 4000
If there is a breakout of 4000 target 4015
If there is a breakout of 4015-20 target 4030
Bearish bias:
If there is a failed breakout of 4030 target 4000
If there is a failed breakout of 4005 target 3975
If there is a breakdown of 3970 target 3950
SPX - The Why Behind the Plan
Key Levels
Alright, let’s take a bit of time to clean up our key levels…
3970-50 is a critical zone for the bulls to hold in the interim. This zone has been hammered with dark pools all week and this zone has acted as a major support zone where price has reversed from.
4005 then 4025-30 continues to be a key level for the bulls to break through to push towards 4050 then 4065.
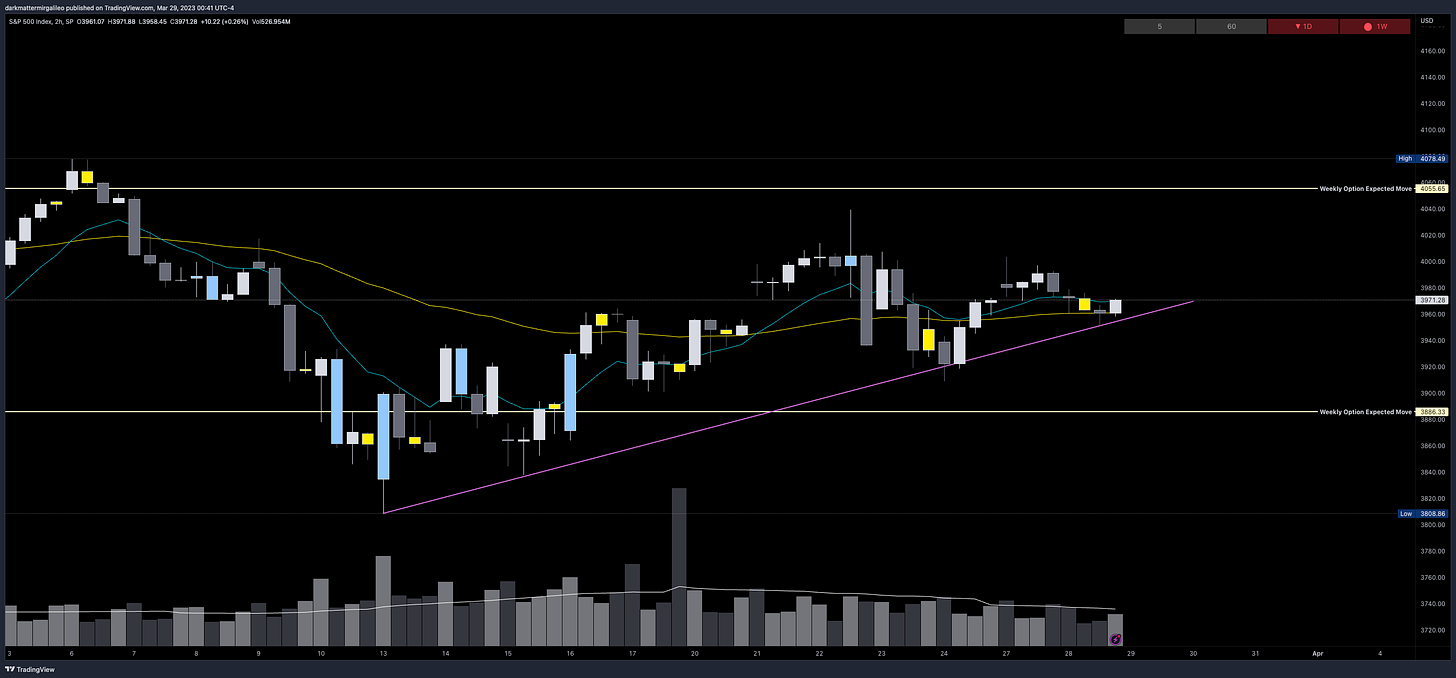
Mark this trendline from the lows of this month. We have now tagged and held this uptrend 6 times it has been tagged. When it breaks that will be a key level for a bearish tone and might not hold another test…
Below Spot:
3901-3890 - FVG (30min chart)
3910-15 - key dark pool level
3930-3901 - OB (4HR chart)
3960-3965 - OB (15min chart)
3950-70 - key dark pool level
3950 - negative vanna
Above Spot:
3979-3986 - FVG (30min chart)
3996-4031 - bearish OB (1HR chart)
4000 - 2/27 weekly VAH
4028 - 2/21 weekly VAH
4000 - positive vanna
4054 - February’s VAL
Dark Pool Levels
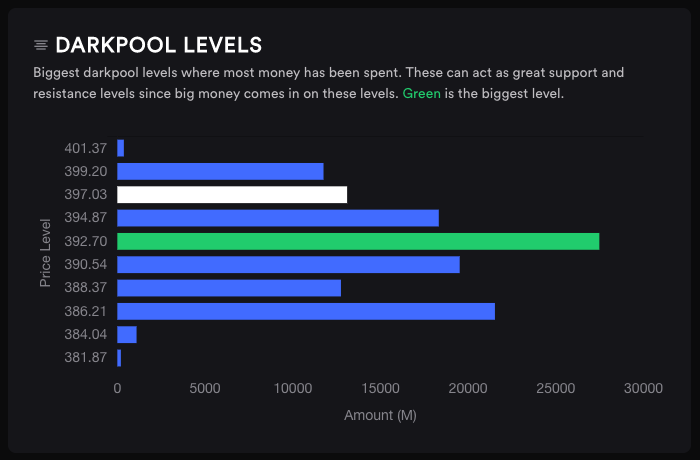
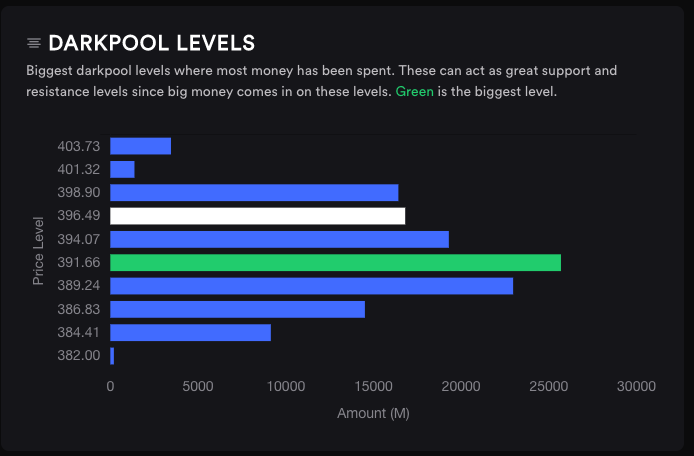
We need to pay attention to some key levels that have Dark Pool buildup. Mark them on your chart as key levels that we should pay attention to. Note I combine my dark pool analysis from multiple sources as I don’t get a clear picture from just one always - for this I use Quant Data and Tradytics.
3950-70 - (395.62) - Over $5.5B has been printed at this zone
$3B was reported on Friday
$1.5B was reported on Monday
$1B was reported Tuesday
3940-45 - (393.40) $1.81B was reported on Friday
3910-15 - (390.11) a key dark pool level that kept the market supportive
I like the below chart view from Tradytics and will keep a view of it from the previous day so we can monitor the changes to the levels…
Orderblocks (OB) and Fair Value Gaps (FVG)
These are smart money concepts and some areas I am looking to see how price reacts. I will give higher credence to OB’s whereas FVG’s could be areas of basing/consolidation if they break.
Resistance levels - at these levels I want to see if price rejects to short or consolidates for a push up. I couple this data with Volland, intraday option flows, and Dark Pool levels. Higher timeframe OB’s or FVG will be harder to break.
3979-3986 - FVG (30min chart)
3996-4031 - OB (1HR chart)
Support levels - at these levels I want to see if price rejects to long or consolidates for a push down. I couple this data with Volland, intraday option flows, and Dark Pool levels. Higher timeframe OB’s or FVG will be harder to break.
3966-3971 - FVG (15min chart)
3960-3965 - OB (15min chart)
3940-3932 - OB (15min chart)
3930-3901 - OB (4HR chart)
3901-3890 - FVG (30min chart)
3874-3843 - OB (1HR chart)
Volume Profile
Let’s review the volume profile and some key levels there. If you are unfamiliar with the Volume Profile I highly suggest reviewing some YouTube videos or reading this quick overview on it.
Some keywords to be aware of:
VAH = value area high
VAL = value area low
POC = point of control
None of our volume profile levels changed as we have continued trading in this tight range. For these levels I would suggest you review the 3/28 trade plan.
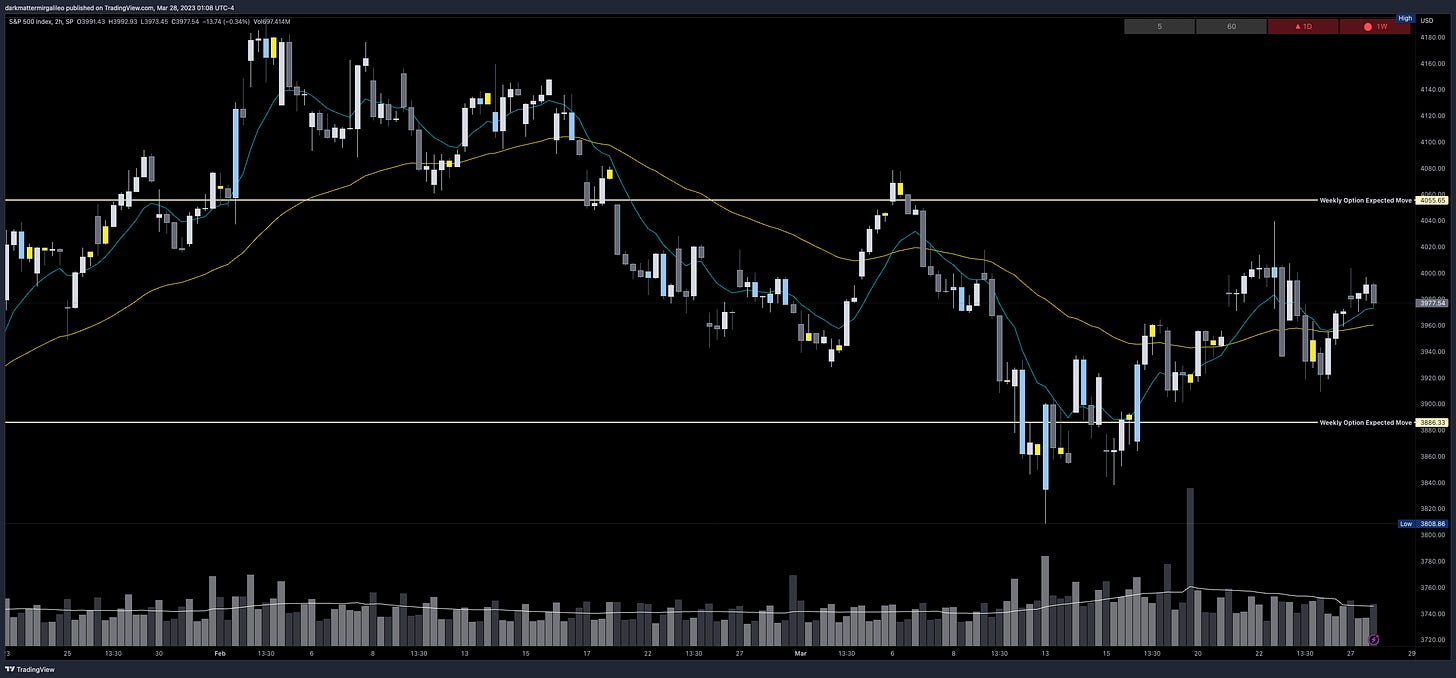
Weekly Option Expected Move
SPX’s weekly option expected move is ~84.66 points. SPY’s expected move is ~9.15. Remember over 68% of the time price will resolve it self in this range by weeks end.
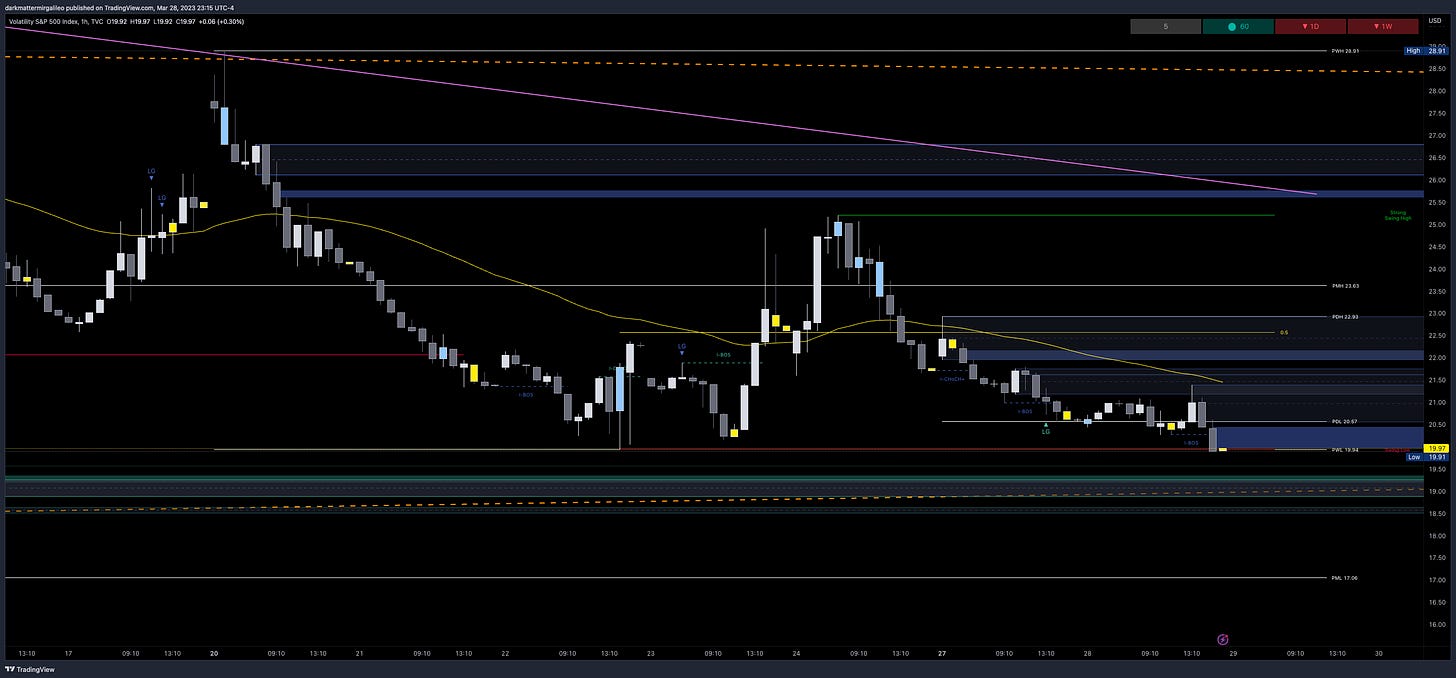
VIX Update
Let’s review the VIX chart. VIX continued it’s selloff after hitting an OB on the 4hr chart. We are now trading near a key bullish OB.
Key levels…
Above Spot:
19.97-20.45
20.55-21.41
Below Spot:
19.37-19.27
19.27-18.89
18.64-18.50
Remember, typically VIX going down correlates with a uptrend in the market and vice versa for a downtrend in the market.
Vol.land Data
For a better understanding of the various greeks below I would suggest you visit the Volland YouTube Page. Volland provides unique data showing where dealers are positioned providing in my opinion a higher degree of conviction to where price may move to.
Vanna - Levels where price may repel or act as magnet
Remember for price to go above spot through a magnet or repellent VIX and IV must decrease or stay flat. For price to go below spot through a magnet or repellent VIX and IV must increase.
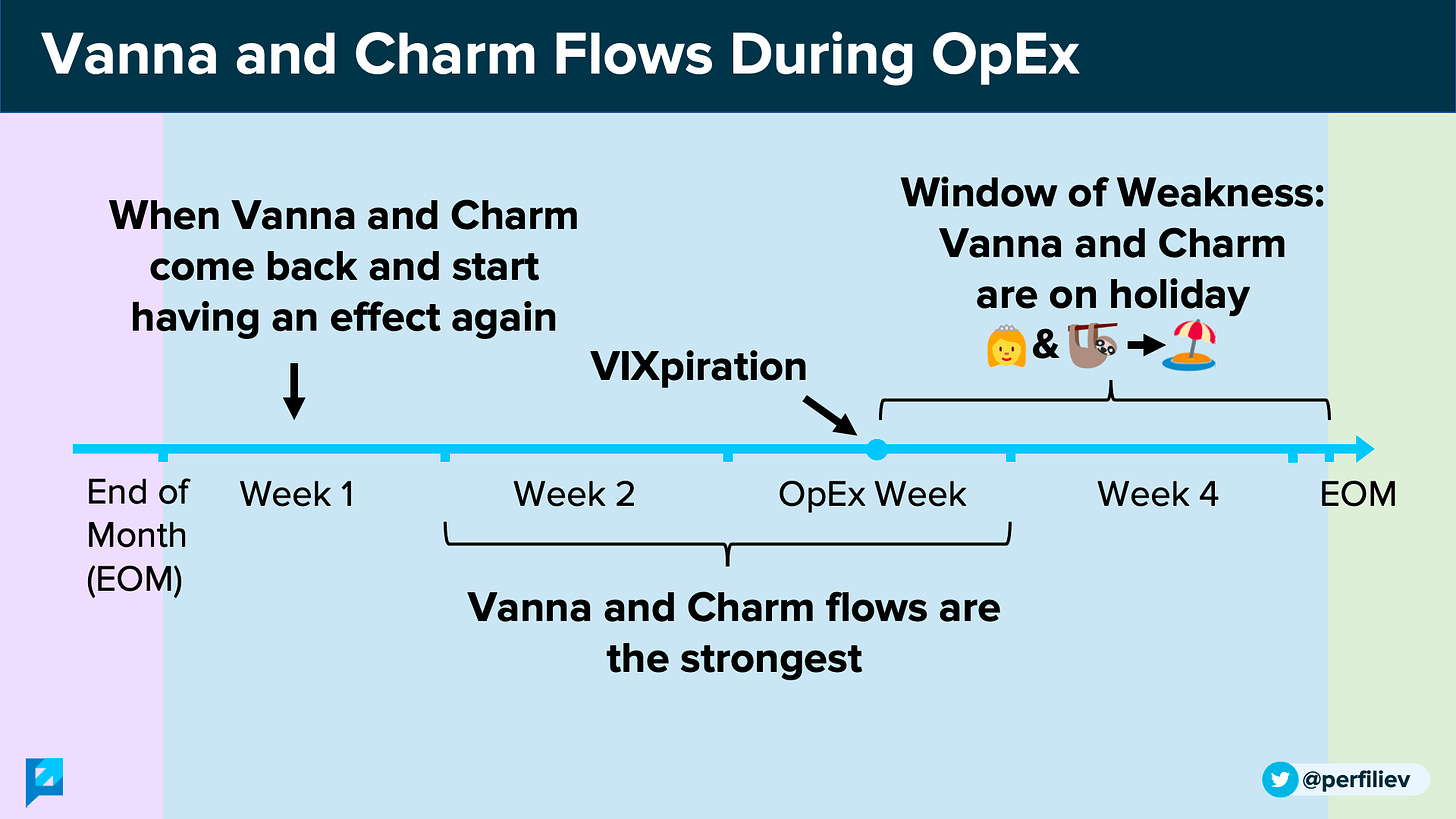
As we are in a window of weakness with Vanna so we cannot solely rely on these levels. It is imperative that for the next two weeks we look at key Gamma levels, orderblocks, dark pools and the VIX.
Positive vanna - will act as magnet
Negative vanna - will act as repellent
When price goes through a positive or negative level it will flip it - ie negative becomes positive and vice versa.
Above Spot:
3975 - positive vanna
3995 - negative vanna
4000 - positive vanna
4005-20 - negative vanna
4015 largest of the cluster
Below Spot:
3970 - negative vanna
3960 - negative vanna
3955 - positive vanna
3950 - negative vanna
3930 - positive vanna
3925 - negative vanna
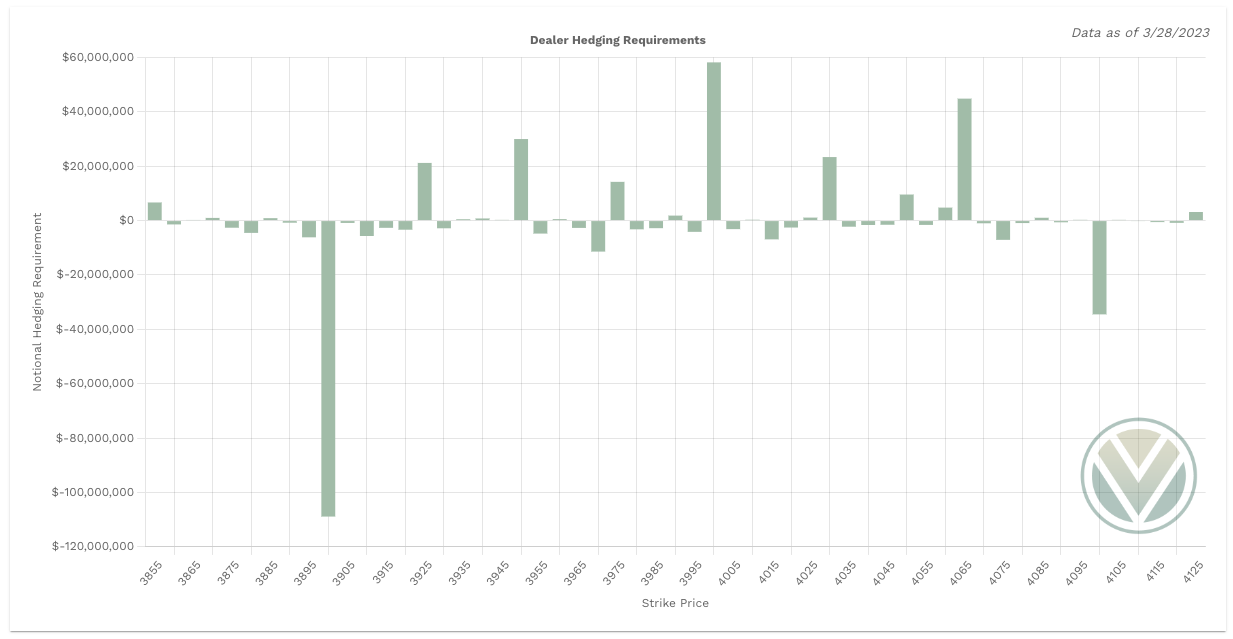
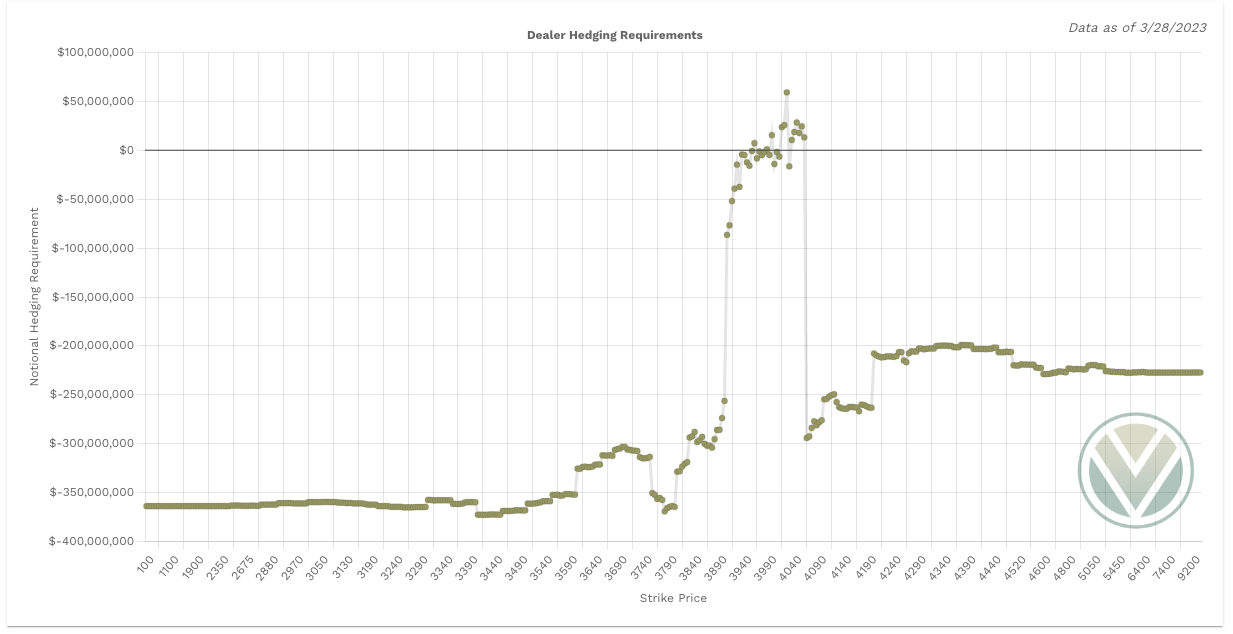
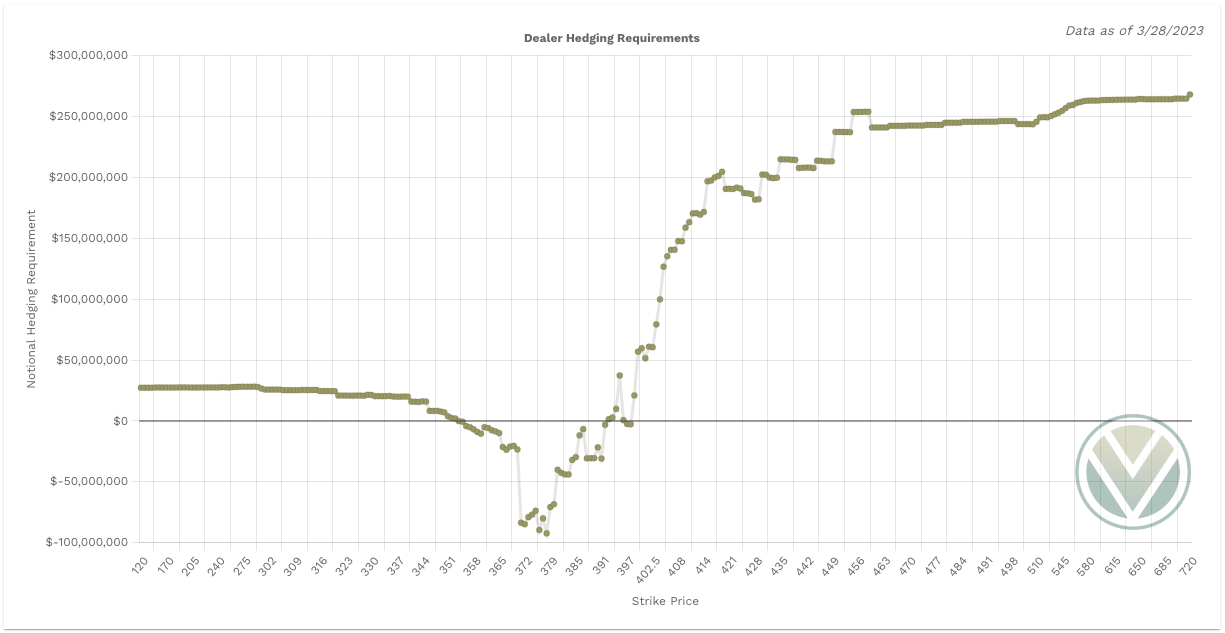
Gamma and Delta-Adjusted Gamma (DAG)
Positive Gamma Above Spot - acts as resistance
Positive Gamma Below Spot - acts as support
Above Spot:
3975 - positive Gamma
3990 - positive Gamma
4000 - positive Gamma
4005-20 is negative Gamma
If price floats through this zone dealers will not impact price as they are neutral to these levels - no buying or selling
What we will want to be looking for are 0DTE Volland or Options Flow Data to guide us through these levels for further upside
4025-30 is positive Gamma
Dealers must buy between 3950-3905
Below Spot:
3950 - positive Gamma
3925 - positive Gamma
Dealers must sell above 3955 and below 3900
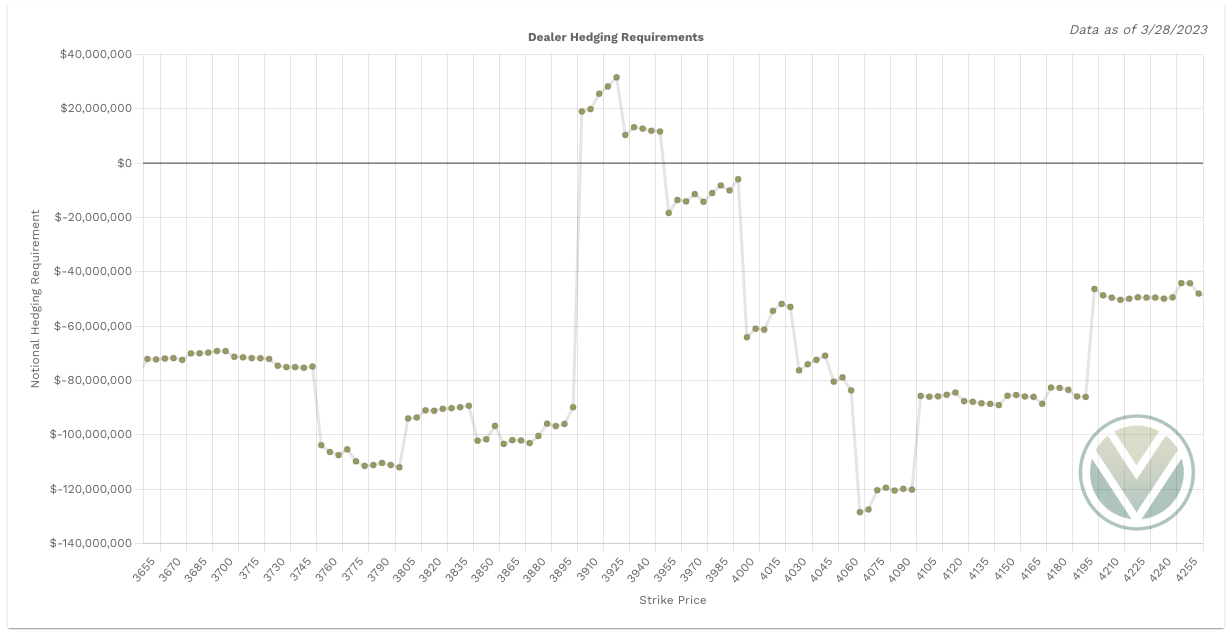
Charm
While Charm is on “vacation” I will continue to share the data just for observation purposes.
Charm is more negative on SPX. This suggests that Charm will have little a more bullish impact on SPX.
When reviewing Charm we also need to account for SPY’s charm. It is leaning bearish. This value has grown the past two days towards the positive side which is a bearish signal.
Between the totals of SPY and SPX, SPX charm will outweigh SPY. When they are in sync that further adds to the charm impact. Keep in mind the total notional value of SPX should be multiplied by 10 for comparison to SPY.
Final Take
Based on futures as of writing we are right around 3990 and right in the middle of our bullish bias idea 1. Let’s see how the open goes and while the day might not end in green I think there is a good chance we break that 4005 level we failed at earlier in the week. Could this turn into a green day followed by a sharp selloff Friday? It could and we need to be careful with longs near the top end of the 4005 levels should we get there and take profits when available and stop losses tight.
Stay #paytient and react to the key levels - no predictions! Good luck traders.
Reminder, this is an unusual trading month where we have an additional week of weakness in Vanna and Charm. So pay extra close attention to the Gamma levels and any key volume profile value area’s and points of control, along with bullish/bearish orderblocks, and dark pools. They will compliment our dealer data for this week.
I am going to share my key rules to intraday trading in the end of the plan moving forward to build better habits and allowing you to grow as a better trader.
My Intraday Trading Rules
I do not trade within the first half hour UNLESS I am in a trade from the prior session and looking to close the trade or we have a major gap or a key level already broken
I let the initial balance do its thing - I am just a small fish in a large ocean of traders so let's let them fight it out
I then wait for key levels targeting one level to the next and taking profits at each one.
If there are key levels that are 10pts apart that is when I have scalping mindset and anything above 10pts I want to give it the room to hit the price target with a 5 pt buffer to take profits once we reach within 5 pts of a target - I also tighten my stop loss once at 10-20% profit with the goal of never allowing trades to go red when I have a nice profit)
I supply options greeks with OB (order blocks) and FVG (fair value gaps) otherwise known as Smart Money Concepts
When I am scalping - ie targeting 10pt trade levels I will take profits and never go more than 10% red. Simple as that, know your trade plan strategy and the risk. When you are wrong you are wrong and reset
For 20pt trade level targets I will increase my stop losses to 20% and allow more of the trade to play in the event I entered too early
I try - key word try ha - avoid trading lunch hours defined as 12pm to 2 pm est. Money for the most part unless you are scalping - is made in the first 2 hours of the trading day and the last 2 hours
I always stick to two EMA’s on my chart and that’s the 10/50 EMA’s
When the 10ema is above 50ema we are bullish
When the 10ema is below the 50ema we are bearish
Go put these on your charts and when you view them on timeframes less than the daily timeframe you will see the power they provide
For scalpers out there the smaller timeframes provide great opportunities to scalp 5-10pt moves
There are more we could discuss including volume profile, low volume nodes that I think are great strategies to compliment option greeks. Maybe in the future we can include more details.
Trading is not for the unprepared. It is critical you abide to a strategy and checklist and walk into every trade with a plan. Without a plan you are simply gambling and have a better chance at the slot machines. There are more nuances to my weekly and daily checklists, but I think this provides a good read for now and we will/can continue adding to it.
To cover our basis…
Welcome to my Substack where I provide a daily SPX trading plan to help guide my intraday trading. The purpose of this letter is not to advice you on your trading or investment decisions. I am simply documenting my daily trading plan for myself to help with planning and execution. These are simply my opinions and the data sourced from the likes of vol.land, TradingView, Quant Data and others. The stock market is risky, gains are not guaranteed. This is not about getting rich quick, but learn to educate yourself and make the necessary financial decisions on your own. This is not financial advice.


