Good Sunday traders. Welcome to another week of trading with the Dark Matter team!
This week as if the banking concerns were not enough brings us even more volatility as a slew of different data points hit us this week, starting with CPI on Tuesday, PPI Wednesday, EU Monetary Policy Thursday, and wrapping it up Friday with Consumer Sentiment.
As always, don’t predict. We don’t move the markets, we don’t have inside information, so don’t expect to predict any tops or bottoms. Simply look at the data, understand the key levels AND why they are key levels then react to them.
For my engineering friends in tech it’s simply said in IF This Then That statements.
Last session trading recap
This tweet will provide you with a recap of our trade from Friday and I also want to give a shoutout to one of our readers who had a killer Friday using Volland Data, our trade plan, and the Volland Discord netting over $26k in profit! Congrats and I am so stoked to see other readers are making their own trade plans and going into each trading session with a plan. This really makes me happy to see!

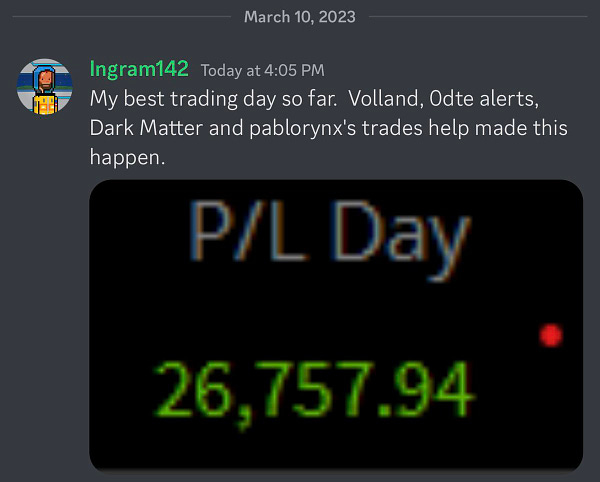

I enjoy interacting and learning from other traders so continue to share your trades, ideas, and how you use this trade plan by messaging me on Twitter @DarkMatterTrade.
News Catalyst
Lots of news this week. Monday will heavily be driven by any SVB or other bank related news. We do have a mild to no impact news catalyst day otherwise.
10am est - Consumer Inflation Expectation
For more information on these news events, visit the Economic Calendar
SPX/ES/SPY Trade Plan
Remember you can use this SPX trade plan to trade ES or SPY.
Note - I wrote this plan a bit prior to futures and the breaking FED news. The bullish bias for the most part has hit and trade idea 3 as a bullish bias is high risk, but if VIX goes down it can happen with no Gamma resistance above.
Bullish bias:
Above 3875 target 3900
If there is a breakout of 3905 target 3920
If there is a breakout of 3930 target 3940-45
Bearish bias:
Below 3915 target 3900
If there is a failed breakout of 3920-25 target 3900
If there is a breakdown of 3900 target 3875 then 3850 then 3825
I would add/enter as each target breaks until 3825
SPX - The Why Behind the Plan
Volume Profile
Let’s review the volume profile and some key levels there. If you are unfamiliar with the Volume Profile I highly suggest reviewing some YouTube videos or reading this quick overview on it.
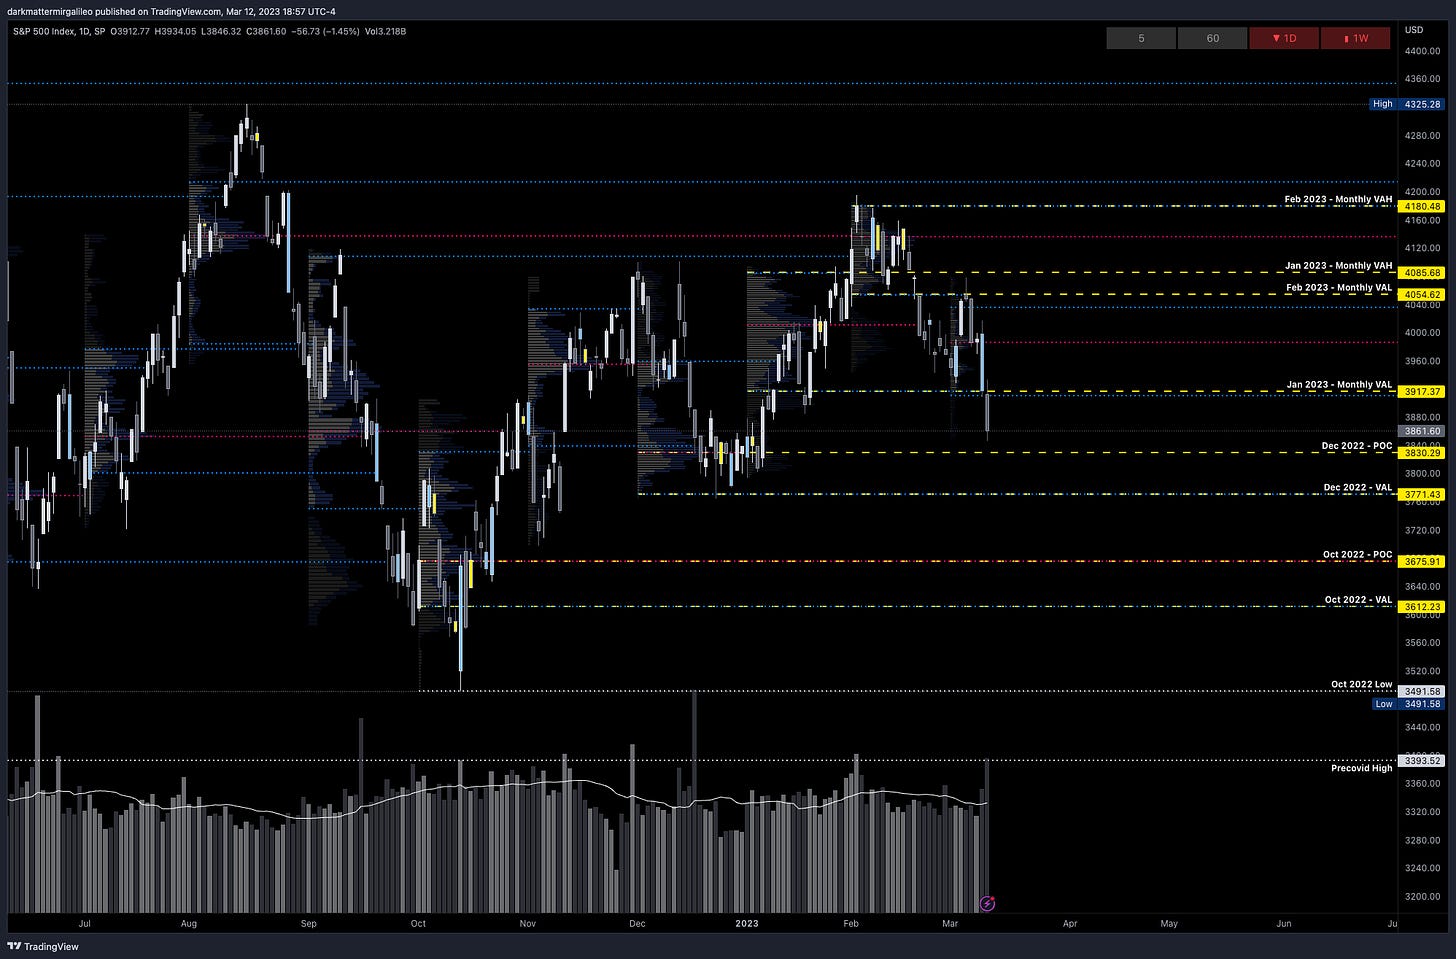
Monthly Levels:
3917 - Currently we sit below January’s value area - albeit futures overnight did get back in this value area before selling off - so far rejecting this value area
3830 - Below January’s VAL, we have a point of control sitting from December
3771 - This is December’s value area low (VAL)
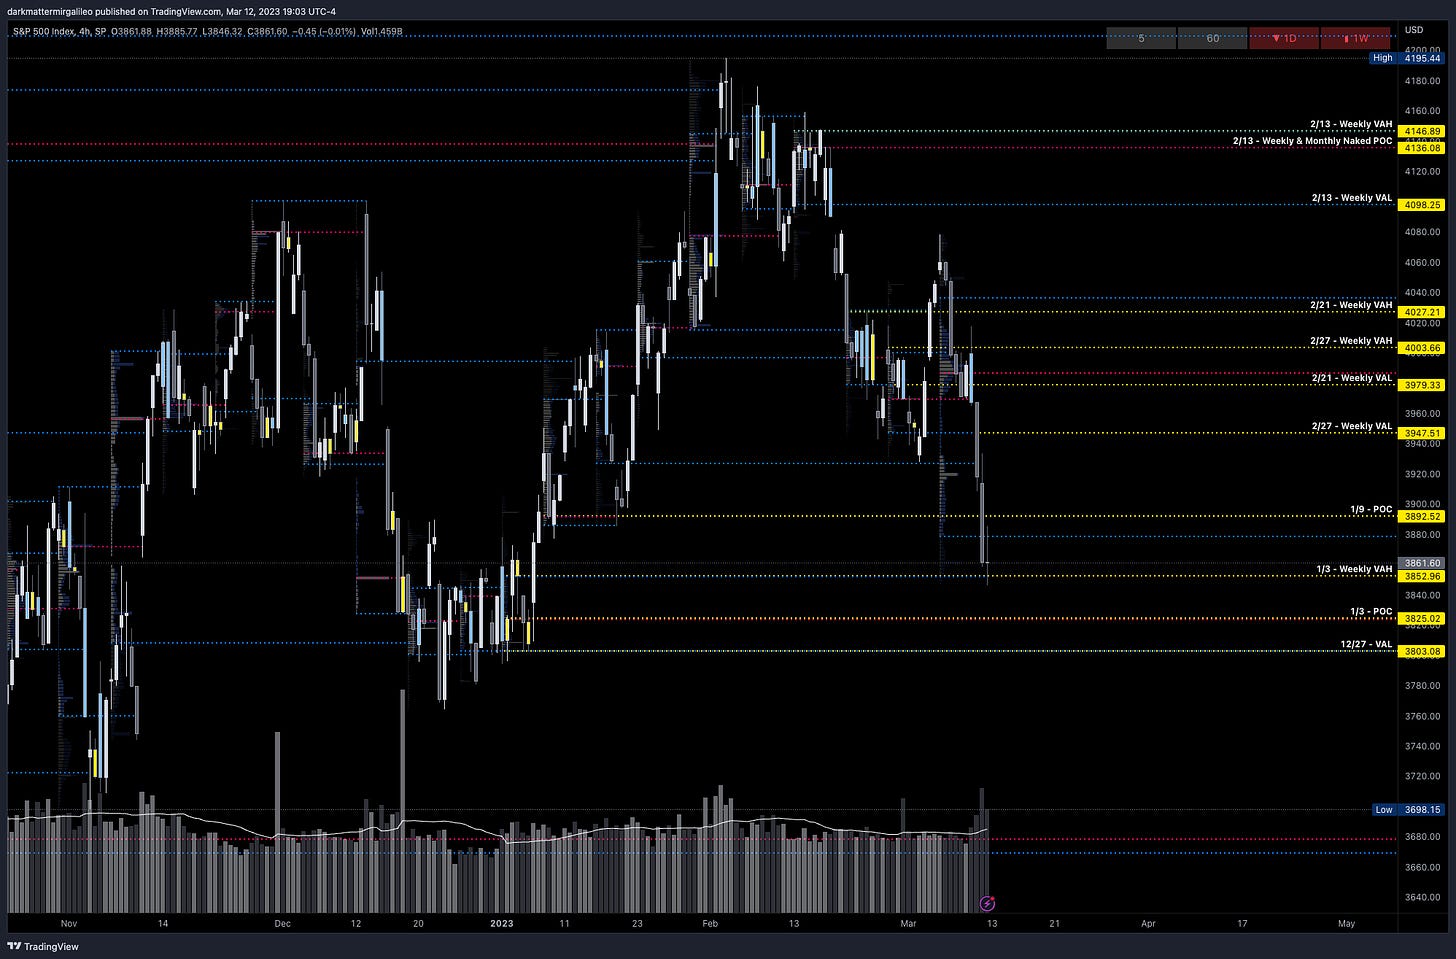
Weekly Levels:
3947 - 2/27 Weekly VAL - a key level for bulls to retake
3892 - a POC sitting here from January 9, 2022
3852 - VAH from 1/3
3825 - a naked POC from 1/3
3803 - 12/27 VAL
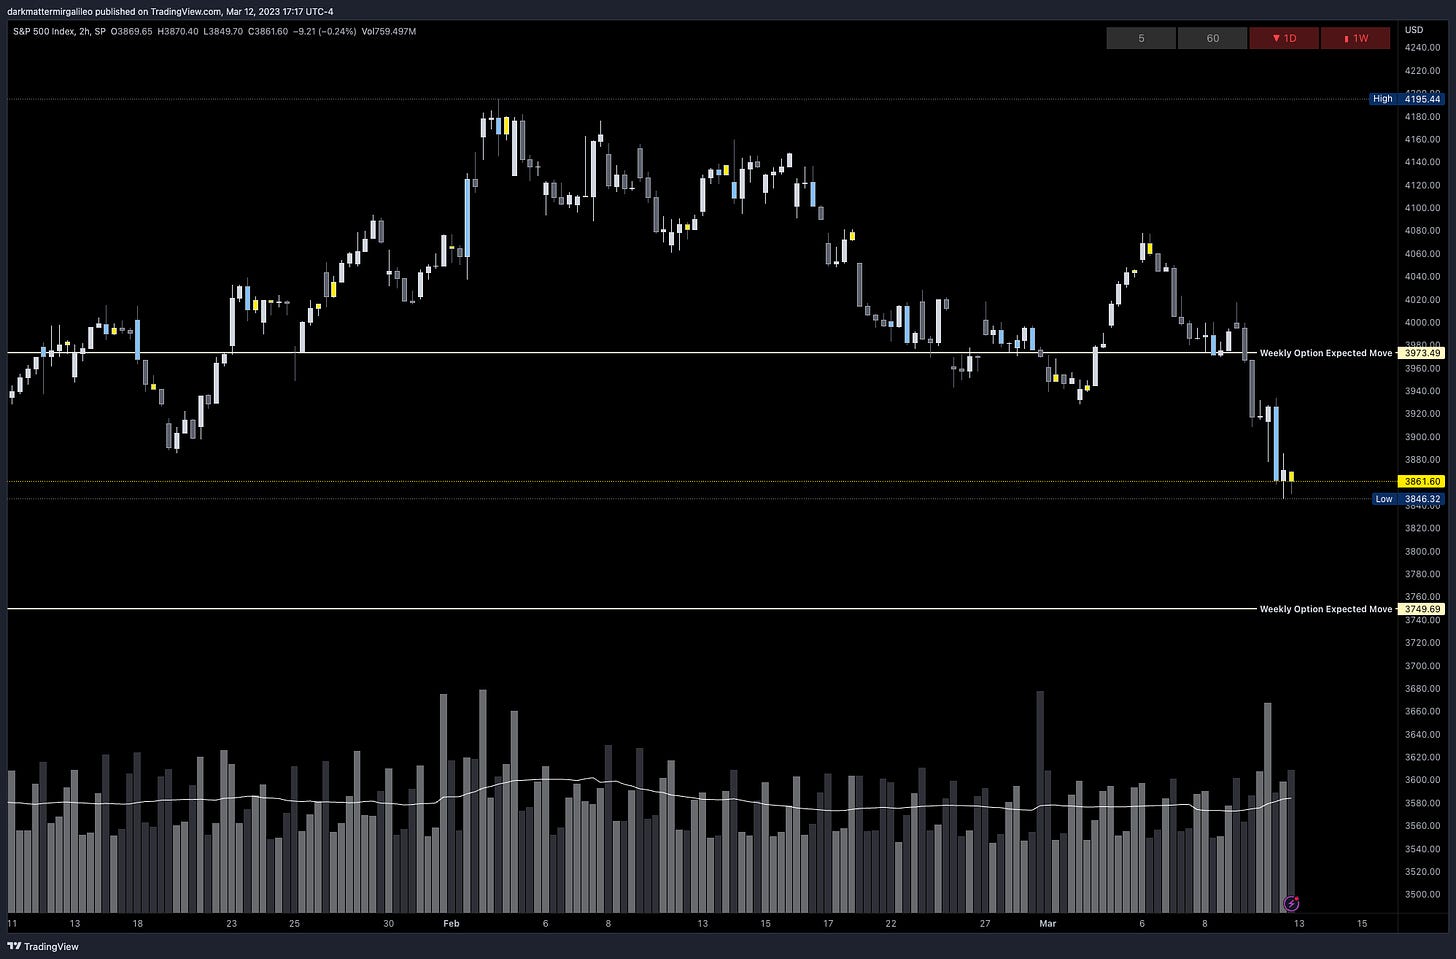
Weekly Option Expected Move
SPX’s weekly option expected move is ~111.90 points. SPY’s expected move is ~11.86. Remember over 68% of the time price will resolve it self in this range by weeks end.
This should just be used as another data point. Most times than not price will end the week within this range, but when unaccounted news events occur - such as SVB failing - the expected move should be a muted data point then.
VIX Update
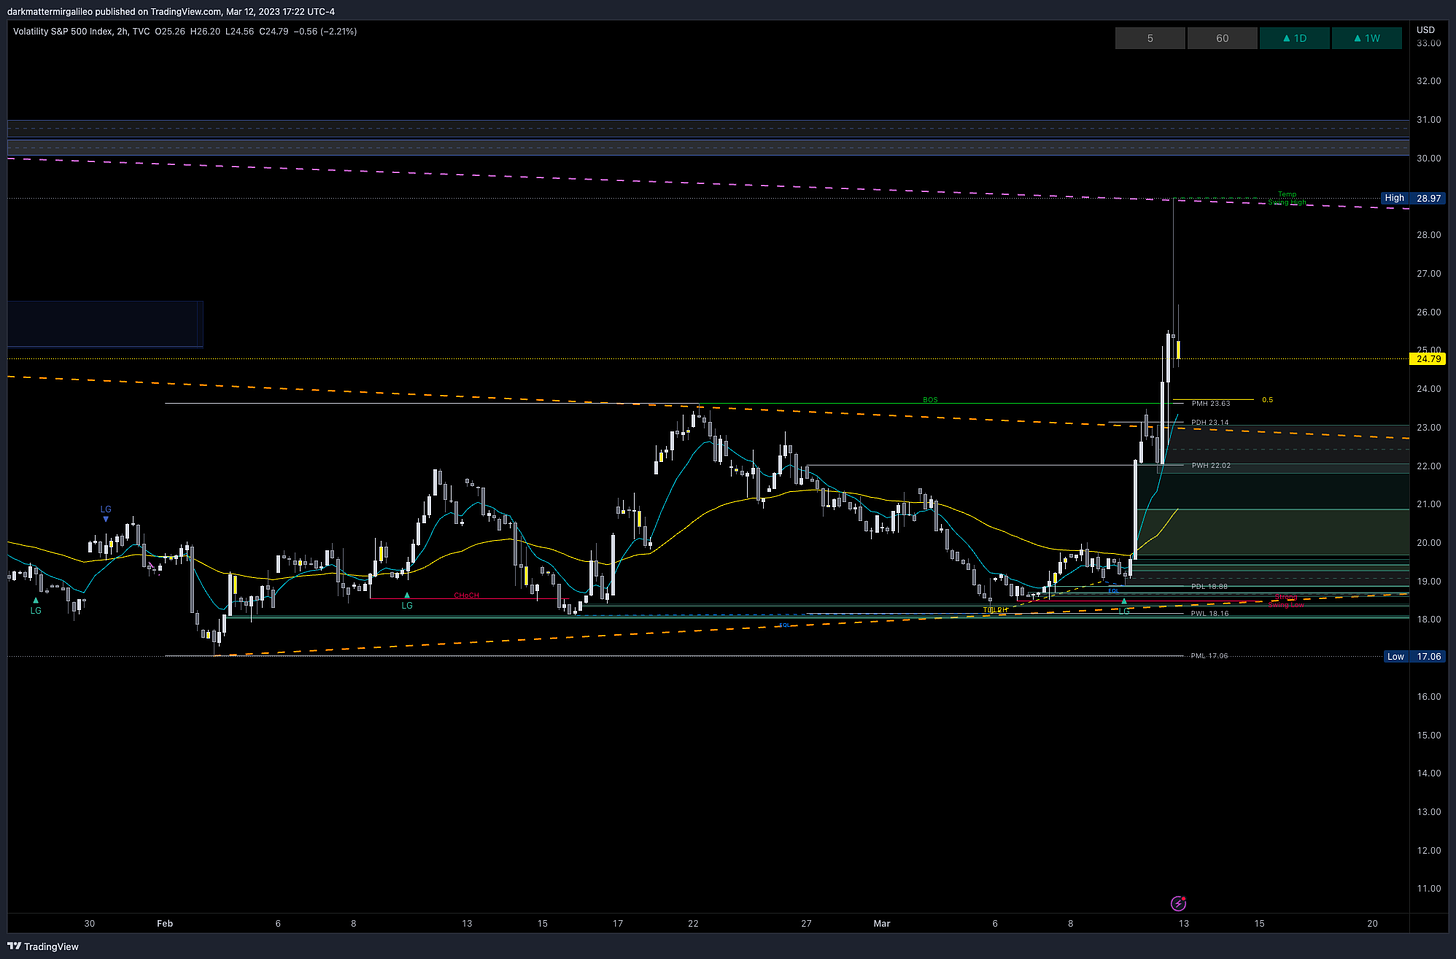
Let’s review the VIX chart. Simply stunning how much more the VIX went up today and then how quickly we had a VIX crush - we hit a high of 28.97 before seeing it close the day at 24.79.
It did hit a key down trendline from January 2022. I think if VIX chops between our previous wedge breakout and this trendline and opportunity to short the market for a sizable R/R will occur when VIX comes back near 23-22. If it breaks these levels the next area of interest will be at 20.89-19.67.
See the OB’s and FVG’s in the below chart for the VIX.
Remember, typically VIX going down correlates with a uptrend in the market and vice versa for a downtrend in the market.
Vol.land Data
For a better understanding of the various greeks below I would suggest you visit the Volland YouTube Page. Volland provides unique data showing where dealers are positioned providing in my opinion a higher degree of conviction to where price may move to.
Vanna - Levels where price may repel or act as magnet
Remember for price to go above spot through a magnet or repellent VIX and IV must decrease or stay flat. For price to go below spot through a magnet or repellent VIX and IV must increase.
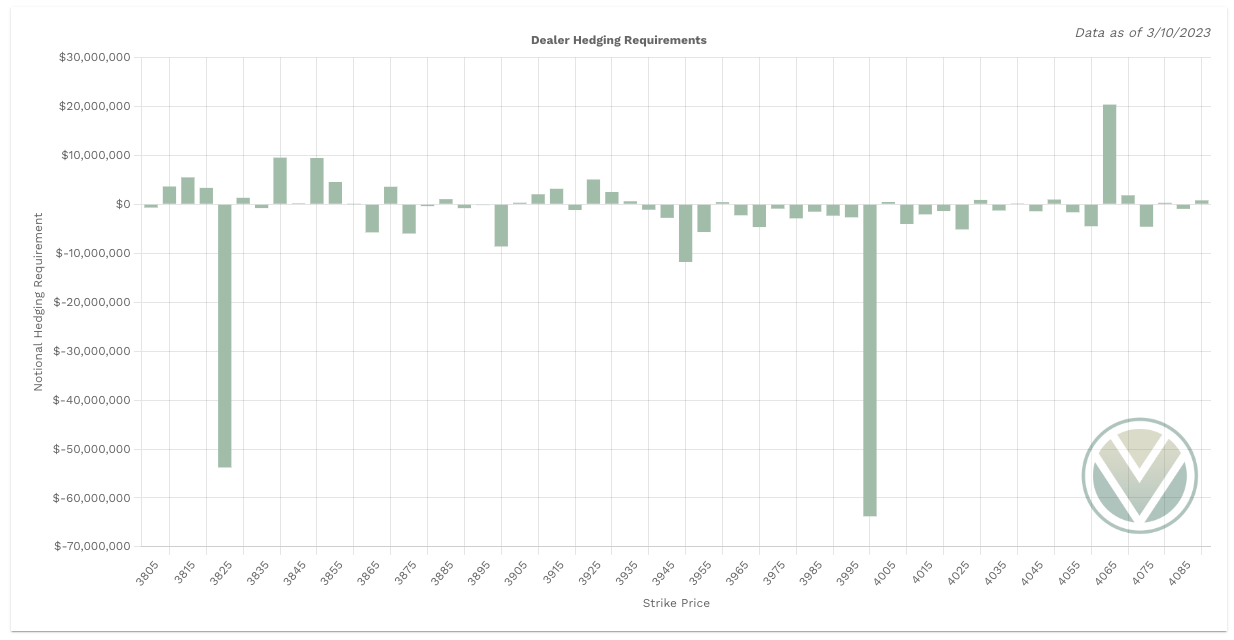
Vanna Key Levels:
3825 is a large positive vanna below spot - price will seek to magnet to it
3925 is a small positive vanna above spot - price will seek to magnet to it
Above Spot:
3865 is negative vanna - acting as repellent
3875 is negative vanna - acting as repellent
3900 is negative vanna - acting as repellent
3915 is positive vanna - acting as magnet
3925 is positive vanna - acting as magnet
3950 is negative vanna - acting as repellent
Getting above 3925 or 3950 will take a news catalyst that will bring VIX down
Below Spot:
3850 is a negative vanna - acting as repellent
3840 is a negative vanna - acting as repellent
3825 is a MAJOR positive vanna - acting as magnet
3820-3810 is a cluster of negative vanna’s - acting as repellent
3800 is a positive vanna - acting as magnet
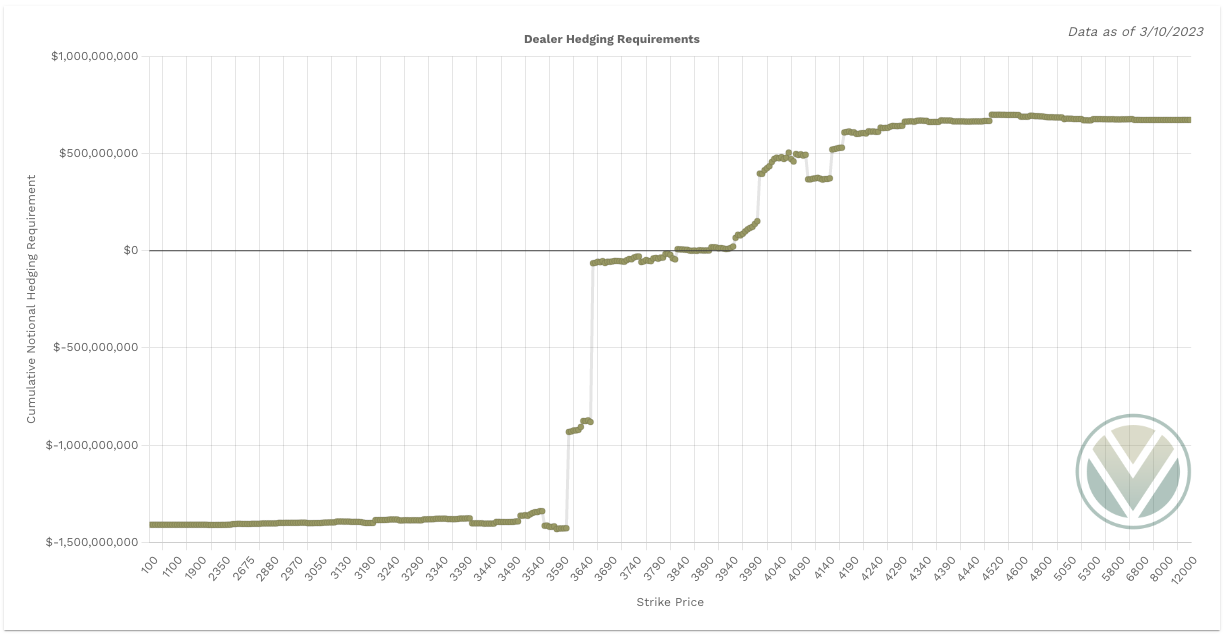
3825 is a large tower that is going to attract price. Looking at just the vanna levels below spot suggests the market wants to sell off more. If you look at the line graph as well above spot levels are negative where as below spot levels are positive - positive draws/magnets price to it.
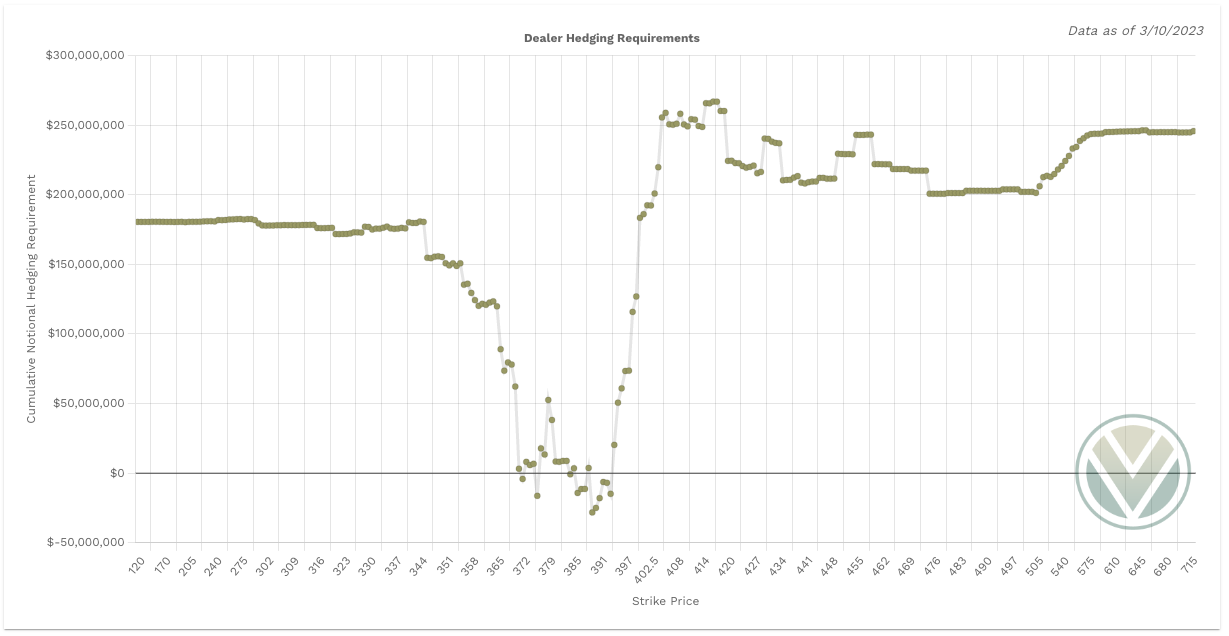
Gamma and Delta-Adjusted Gamma (DAG)
Above Spot:
3870 is positive Gamma - acting as resistance
3885 is positive Gamma - acting as resistance
3915 is positive Gamma - acting as resistance
3925 is positive Gamma - acting as resistance
3935 is positive Gamma - acting as resistance
3960 is positive Gamma - acting as resistance
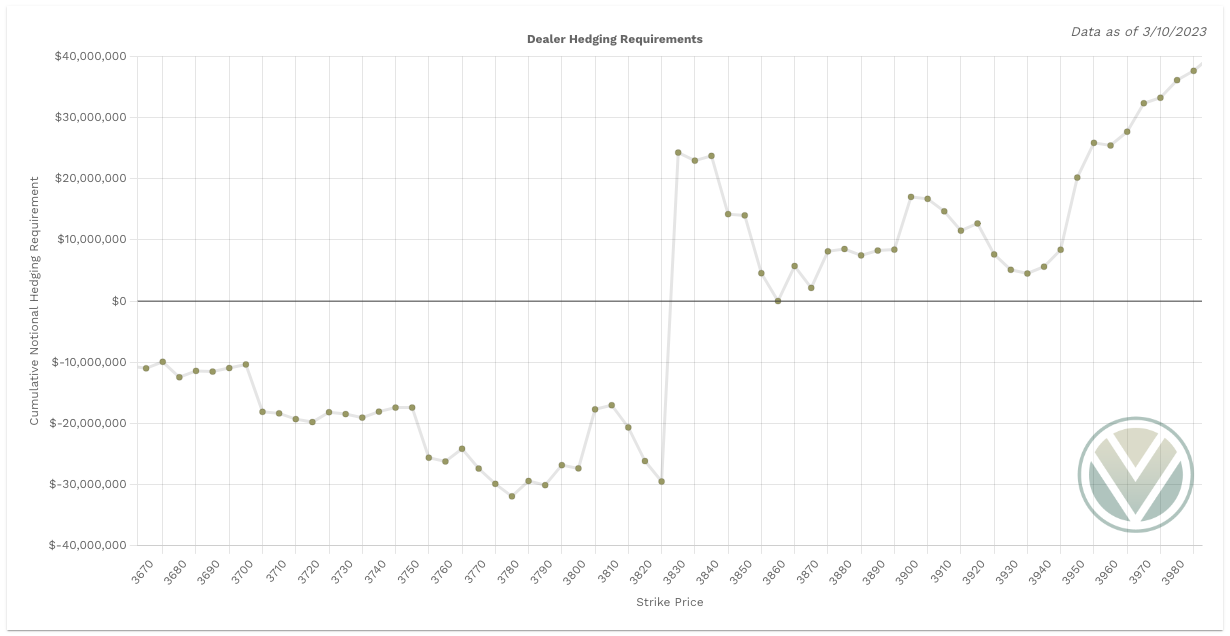
Dealers must buy above 3860
Below Spot:
3850 is positive Gamma - acting as support
3840 is positive Gamma - acting as support
3815 is positive Gamma - acting as support
3765 is positive Gamma - acting as support
3750 is positive Gamma - acting as support
Dealers must buy between 3860-3830
Dealers must sell below 3830
Charm
Charm has taken a more bullish tone on SPX and SPY. This suggests a bullish tone, but you need to look at the vanna/gamma levels for tops. Looking at overnight futures there is the “bullish tone” doesn’t mean it needs to carry into regular trading hours. I would even say that the SPX charm could be labeled as “neutral” suggesting a chop day.
When reviewing Charm we also need to account for SPY’s charm. It is leaning bearish. Between the totals of SPY and SPX, SPX charm will outweigh SPY.
Keep in mind the total notional value of SPX should be multiplied by 10 for comparison to SPY.
Final Take
We have had breaking news overnight that the FED’s will prop all depositors and any banks with liquidity issues. This has pushed ES futures up near 50pts at time of writing.
I would make sure you have the 3940 level marked on SPX. This is the 200 moving average and we lost it last week. This could be an area of resistance should SPX find its way back there and a nice area to short.
I will continue to monitor this level by level and react accordingly. Between now and opening bell a lot can happen. Keep your news alerts open, keep stop losses on your trades, tomorrow should be a volatile day.
Stay #paytient and react to the key levels - no predictions! Good luck traders.
I am going to share my key rules to intraday trading in the end of the plan moving forward to build better habits and allowing you to grow as a better trader.
My Intraday Trading Rules
I do not trade within the first half hour UNLESS I am in a trade from the prior session and looking to close the trade or we have a major gap or a key level already broken
I let the initial balance do its thing - I am just a small fish in a large ocean of traders so let's let them fight it out
I then wait for key levels targeting one level to the next and taking profits at each one.
If there are key levels that are 10pts apart that is when I have scalping mindset and anything above 10pts I want to give it the room to hit the price target with a 5 pt buffer to take profits once we reach within 5 pts of a target - I also tighten my stop loss once at 10-20% profit with the goal of never allowing trades to go red when I have a nice profit)
I supply options greeks with OB (order blocks) and FVG (fair value gaps) otherwise known as Smart Money Concepts
When I am scalping - ie targeting 10pt trade levels I will take profits and never go more than 10% red. Simple as that, know your trade plan strategy and the risk. When you are wrong you are wrong and reset
For 20pt trade level targets I will increase my stop losses to 20% and allow more of the trade to play in the event I entered too early
I try - key word try ha - avoid trading lunch hours defined as 12pm to 2 pm est. Money for the most part unless you are scalping - is made in the first 2 hours of the trading day and the last 2 hours
I always stick to two EMA’s on my chart and that’s the 10/50 EMA’s
When the 10ema is above 50ema we are bullish
When the 10ema is below the 50ema we are bearish
Go put these on your charts and when you view them on timeframes less than the daily timeframe you will see the power they provide
For scalpers out there the smaller timeframes provide great opportunities to scalp 5-10pt moves
There are more we could discuss including volume profile, low volume nodes that I think are great strategies to compliment option greeks. Maybe in the future we can include more details.
Trading is not for the unprepared. It is critical you abide to a strategy and checklist and walk into every trade with a plan. Without a plan you are simply gambling and have a better chance at the slot machines. There are more nuances to my weekly and daily checklists, but I think this provides a good read for now and we will/can continue adding to it.
To cover our basis…
Welcome to my Substack where I provide a daily SPX trading plan to help guide my intraday trading. The purpose of this letter is not to advice you on your trading or investment decisions. I am simply documenting my daily trading plan for myself to help with planning and execution. These are simply my opinions and the data sourced from the likes of vol.land, TradingView, Tradytics and others. The stock market is risky, gains are not guaranteed. This is not about getting rich quick, but learn to educate yourself and make the necessary financial decisions on your own. This is not financial advice.



Great post again! Is the Gamma chart updated, it shows 3/9 date.