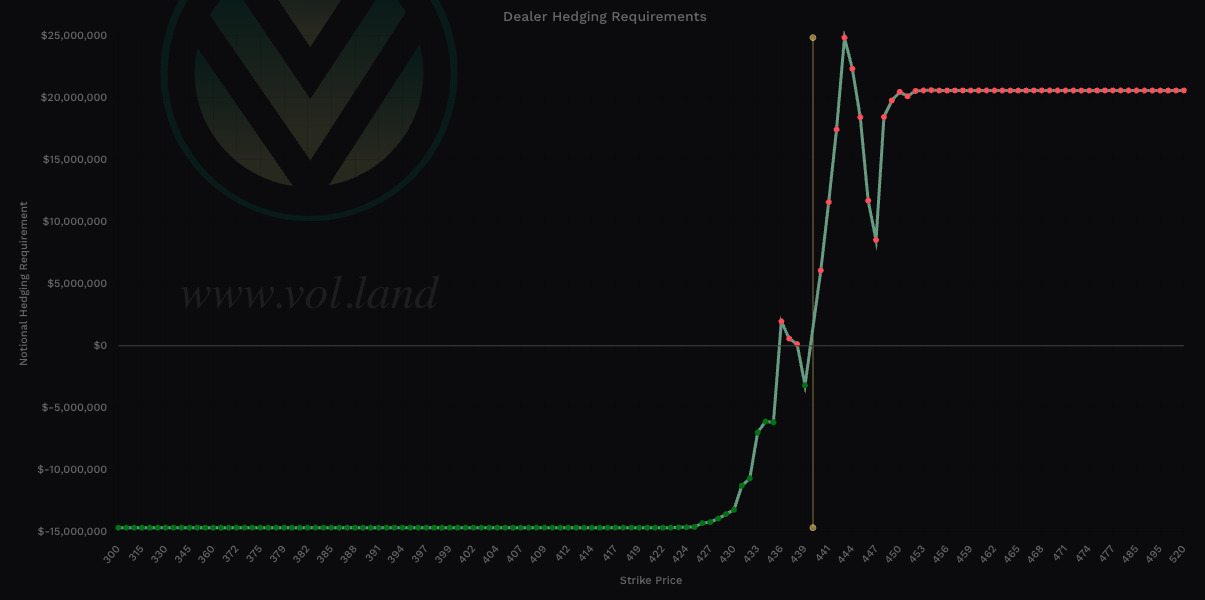
Good evening/day/morning traders. I wanted to take a moment to discuss why on Wednesday I stayed bearish and added to my positions although we saw our key level breached only to see it rally back up.
The high level:
In our trade plan from July 5th we said “bears need to get price below 4450 to target 4415”
Low volume and shortened week with the holiday
Major news data release prior to market on Thursday, which led to a sideways market on Wednesday
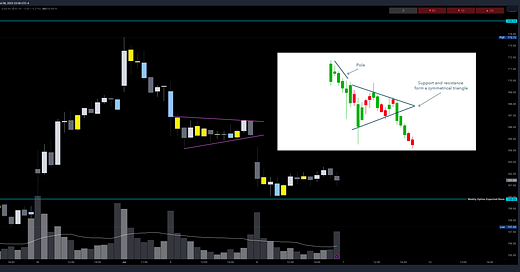
So let’s get into the details. Wednesday brought us more chop to the market where we made higher lows and lower highs. What does this mean? It means we were consolidating for the next move. Is it going to be up or down? At that time we didn’t know and no need to predict, but if you saw some other tickers who had similar patterns or even more bearish pennants there were signs. For reference look at the 1hr or 2hr on ENPH and the bear pennant.
Reminder again: While 4440 supported the markets on Monday and Wednesday we also couldn’t get above 4460 to get bullish. As we stated in our trade plan from July 5th bears want price below 4450 and we closed Wednesday below this level.
Additionally, the volume was not there Wednesday. On a trend day or large gap down day the ES will do closer to 2M in volume where we see those 1% + moves. Our volume Wednesday? 1.13M. Thursday’s volume? Came in at 1.66M producing a 0.79% move on the SPX.
My analysis and seeing the data in Volland30 and the charts, was that we see some selloff - got that today - and a potential retest of it - will we see this tomorrow? - would be healthy to then prime us for that final leg of this rally. Then post July Opex pushes us into a period where we slowly drip down. I can neither wish nor predict so we will play level to level.
So how did I play Wednesday and into today’s session? Well I didn’t trade the open on Wednesday - we were already in the middle of one of our trade ideas and with a gap down I wanted to see how the 4440 level reacted. The first clue that our trade plan might have some conflicts was the market held it. Then I waited for the 10 am est slot to begin my hunt. I patiently waited to see if price would go bullish and trend above 4460.
At 11:05am est on the failed breakout of 4460 and using Volland30 data I entered a short. Now I could have sold it, but I held on throughout the day even adding more towards the end of the day around the highs prior to the selloff to close the day. Why? We didn’t overtake the key 4460 bullish level, we closed under 4450 a key bearish level.
Again, I can’t tell you how important it is to not trade 0DTE’s and buy yourself time. Especially as new traders and building conviction into your trade plans buying time will ensure you do not make any emotional decisions and cut what could be a winner. I easily could have cut it yesterday even going red on one of my trade ideas with ENPH, but I stuck with my plan scaled in at key levels and then let the plan play out. You can’t do this without buying time and more importantly having a plan and knowing when to exit or get stop loss’d…
So in summary I will stick to my trade plan, react to key levels and why they are important, and trade until I hit the target or my stop loss.
Overview (TL;DR)
Bulls can get some short term relief by keeping price above 4415 targeting 4430. This won’t be an easy ride if they are able to do this and expect chop if we get in this range. After 4340 comes 4445. Above it till 4455 is a chop zone and I would wait to long 4460 to target 4475.
Bears will want to push price below 4405 for a move targeting 4380 - the origin of today’s support, where we also broke out from last week prior to the short squeeze, and where we have accumulated over $19B of darkpool. If for some reason the bears can take out 4375 we go down to 4360 followed by 4345.
Should the 4380-4375 levels hold I think this starts the next leg in this rally targeting a new high of the year near 4475 and above it towards 4500. It won’t come fast or straight up, but I sense that we could have green weeks until July’s OPEX.
We have premarket data so the market may make a bigger move prior to the opening of the session. Thus keep an eye on the key levels and react accordingly don’t just predict the move will go in one direction all day. Stick to the levels and keep an eye on Volland30 and the VOLD indicator.
Let’s jump into the trade plan.
For intraday updates please follow me on Twitter @DarkMatterTrade.
News Catalyst
8:30am est - Non-Farm Employment Change
8:30am est - Unemployment Rate
8:30am est - Average Hourly Earnings
For more information on news events, visit the Economic Calendar
SPX/ES/SPY Trade Plan
Bullish bias:
Above 4415 target 4430
If there is a failed breakdown of 4380 or 4375 target 4400
If there is a breakout of 4430 target 4445
If there is a breakout of 4460 target 4475
Bearish bias:
Below 4405 target 4380
If there is a failed breakout of 4420 target 4400
If there is a breakdown of 4375 target 4360
If there is a breakdown of 4360 target 4345
As always keep an eye on Volland30, VOLD indicator, and the VIX for trend continuation or reversals.
Remember you can use this SPX trade plan to trade ES or SPY. ES value is approx. 36pts more than the SPX levels shared. To get SPY levels simply take the SPX levels and divide by 10.03.
SPX - The Why Behind the Plan
Key Levels
Above Spot:
4420-4445 - negative vanna
4415 - positive gamma
4442-4452 - OB (1hr chart)
4447 midline
4445 - 443.18 - $2.25B
4455 - negative vanna
4450-4460 - positive gamma
4475 - negative vanna
4461-4482 - OB (2hr chart)
4472 midline
Below Spot:
4380 - negative vanna
4380 - positive gamma
4393-4380 - OB (1hr chart)
4386 midline
4384-4378 - 437.18-436.54 - $19.47B
4375 - negative vanna - 0DTE
4375-4362 - OB (1hr chart)
4369 midline
4360 - negative vanna - 0DTE
4344-4328 - OB (1hr chart)
4336 midline
4349-4344 - 433.65-433.19 - $9.39B
4325 - negative vanna
4325 - positive gamma
4325 - 431.26 - $4.19B
Dark Pool Levels
The big change in our dark pool levels was an additional $3B print at the 4409 - 439.67 SPY - level. We also see a $2B+ print near the highs at 4445.
4445 - 443.18 - $2.25B
4409-4405 - 439.67-439.22 - $6.39B
4393 - 438.06 - $3.69B
4384-4378 - 437.18-436.54 - $19.47B
4349-4344 - 433.65-433.19 - $9.39B
4325 - 431.26 - $4.19B
4309 - 429.64 - $6.81B
4293 - 428.09 - $7.46B
4214-4212 - 420.16-420.03 - $8.05B
4204-4188 - 419.20-417.60 - $16B
We need to pay attention to these dark pool levels. Remember the levels where we see dark pool prints greater than $4B should peak our interest. I get my dark pool levels from Quant Data.
Orderblocks (OB) and Fair Value Gaps (FVG)
These are smart money concepts and some areas I am looking to see how price reacts. I will give higher credence to OB’s whereas FVG’s could be areas of basing/consolidation if they break.
Resistance levels - at these levels I want to see if price rejects to short or consolidates for a push up. I couple this data with Volland, intraday option flows, and Dark Pool levels. Higher timeframe OB’s or FVG will be harder to break. OB’s are the stronger levels over FVG’s.
4442-4452 - OB (1hr chart)
4447 midline
4461-4482 - OB (2hr chart)
4472 midline
4475-4520 - OB (4hr chart)
4497 midline
Support levels - at these levels I want to see if price rejects to long or consolidates for a push down. I couple this data with Volland, intraday option flows, and Dark Pool levels. Higher timeframe OB’s or FVG will be harder to break. OB’s are the stronger levels over FVG’s.
4393-4380 - OB (1hr chart)
4386 midline
4375-4362 - OB (1hr chart)
4369 midline
4344-4328 - OB (1hr chart)
4336 midline
4304-4297 - OB (1hr chart)
4301 midline
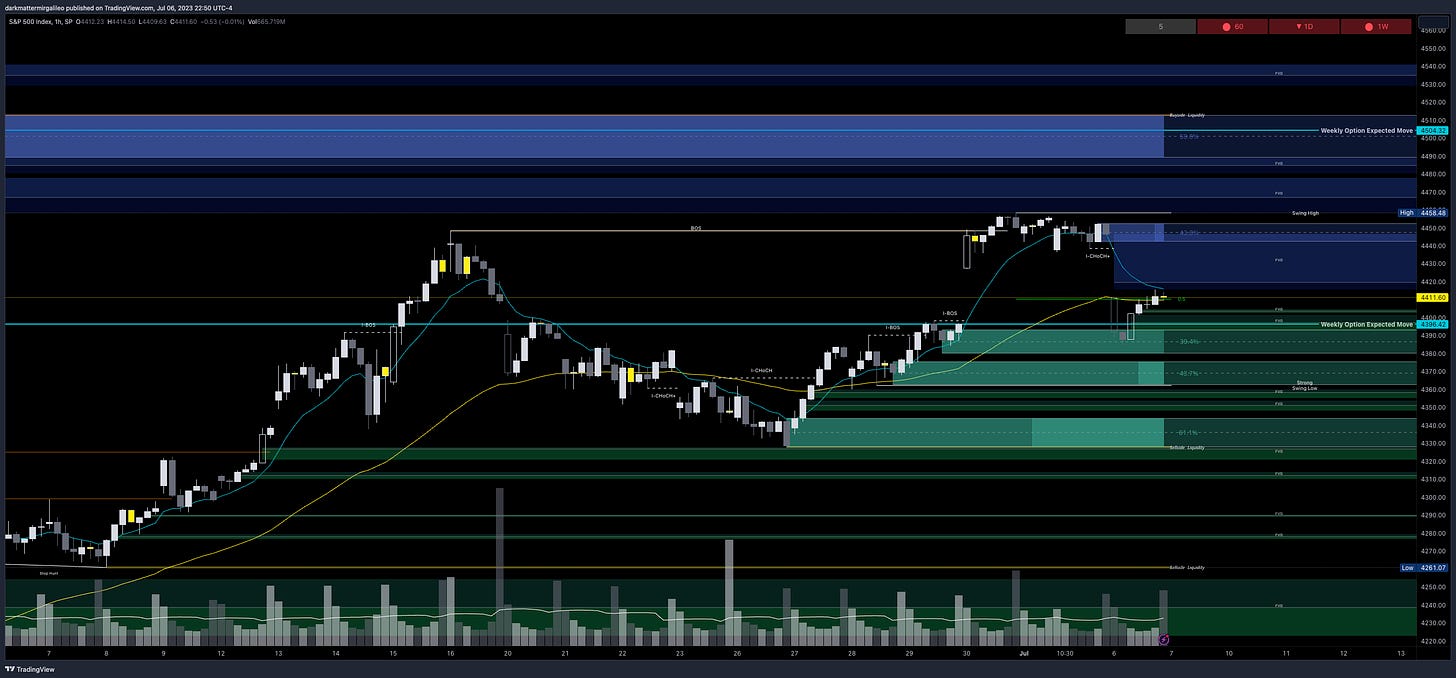
Weekly Option Expected Move
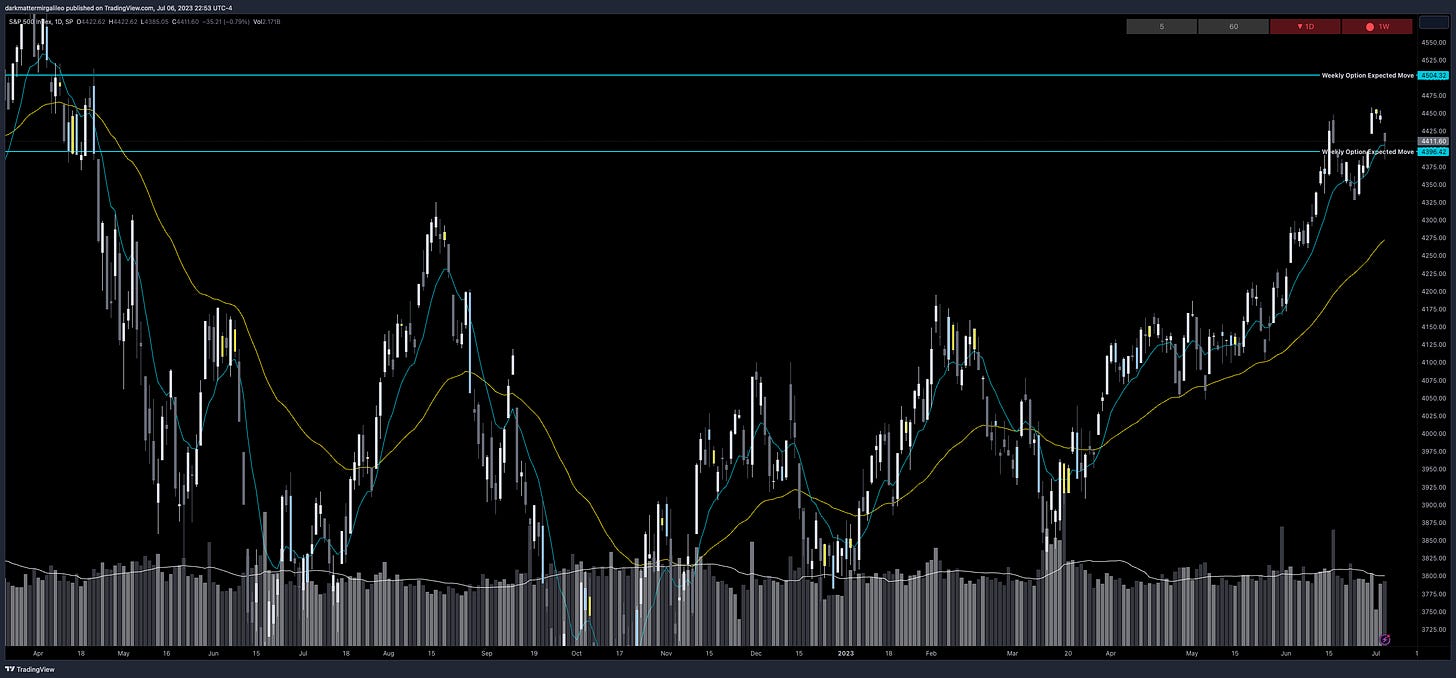
SPX’s weekly option expected move is ~53.95 points. SPY’s expected move is ~5.39. That puts us at 4504 to the upside and 4396 to the downside. For SPY these levels are 448.67 and 437.89.
Remember over 68% of the time price will resolve it self in this range by weeks end.
Volland Data
For a better understanding of the various greeks below I would suggest you visit the Volland YouTube Page. Volland provides unique data showing where dealers are positioned providing in my opinion a higher degree of conviction to where price may move to.
Vanna - Levels where price may repel or act as magnet
Remember for price to go above spot through a magnet or repellent VIX and IV must decrease or stay flat. For price to go below spot through a magnet or repellent VIX and IV must increase.
Positive vanna - will act as magnet
Negative vanna - will act as repellent
When price goes through a positive or negative level it will flip it - ie negative becomes positive and vice versa.
Above Spot:
4420-4445 - negative vanna
4455 - negative vanna
4475 - negative vanna
Below Spot:
4380 - negative vanna
4375 - negative vanna - 0DTE
4360 - negative vanna - 0DTE
4325 - negative vanna
Gamma and Delta-Adjusted Gamma (DAG)
Positive Gamma Above Spot - acts as resistance - meaning that dealers want to push against the move
Positive Gamma Below Spot - acts as support - meaning that dealers will want to support price at these levels
Negative Gamma - becomes permissive to price as it moves there - aka neither resistance nor support - simply just chillin and watching what’s happening…
Above Spot:
4415 - positive gamma
4450-4460 - positive gamma
Below Spot:
4380 - positive gamma
4325 - positive gamma
Charm
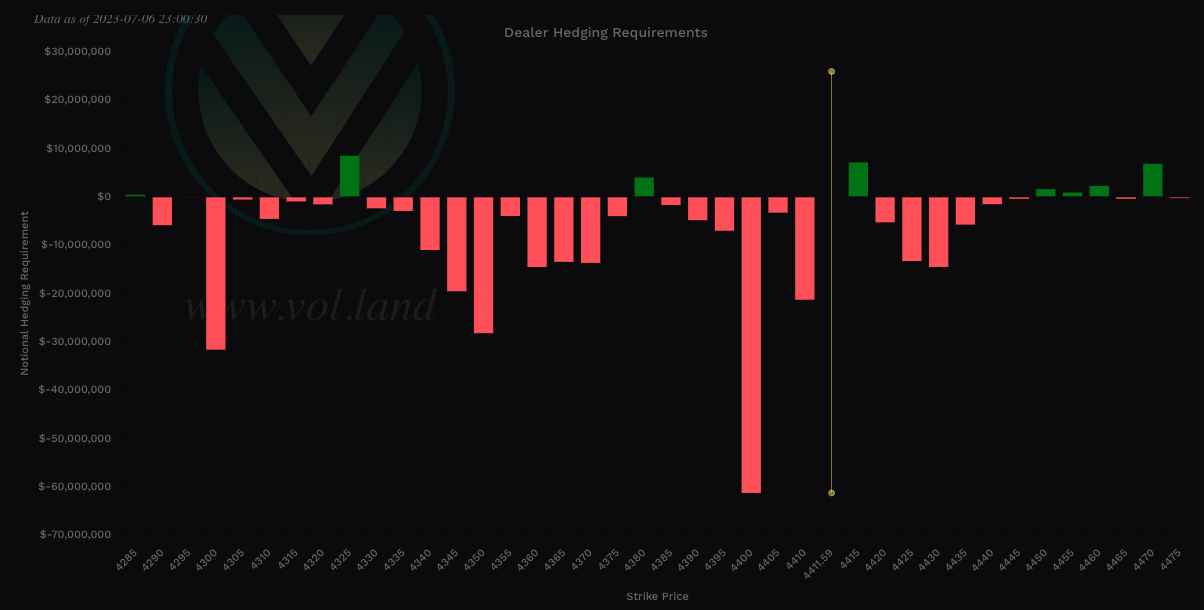
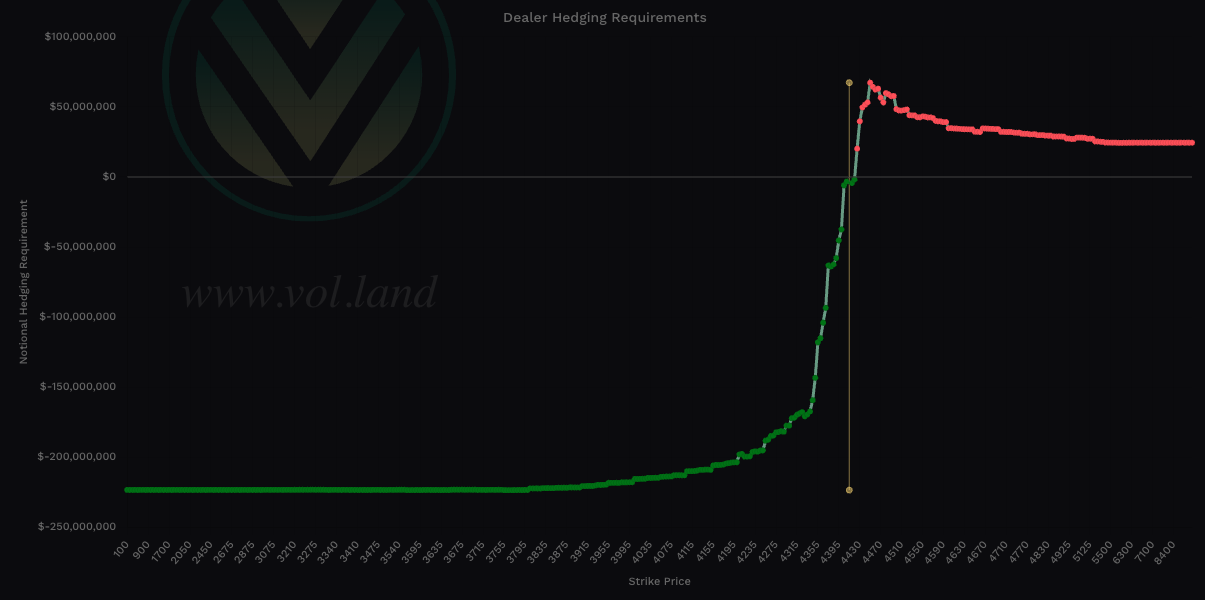
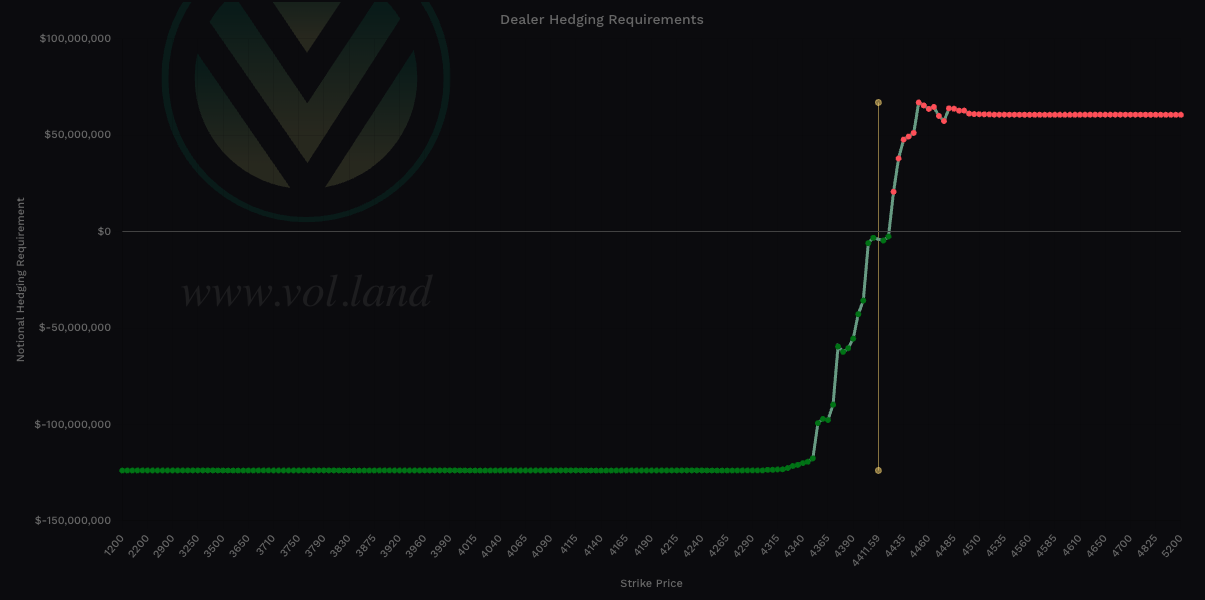
Remember if IV is not expanding charm will start to overtake Vanna especially 0DTE as it comes closer to expiration.
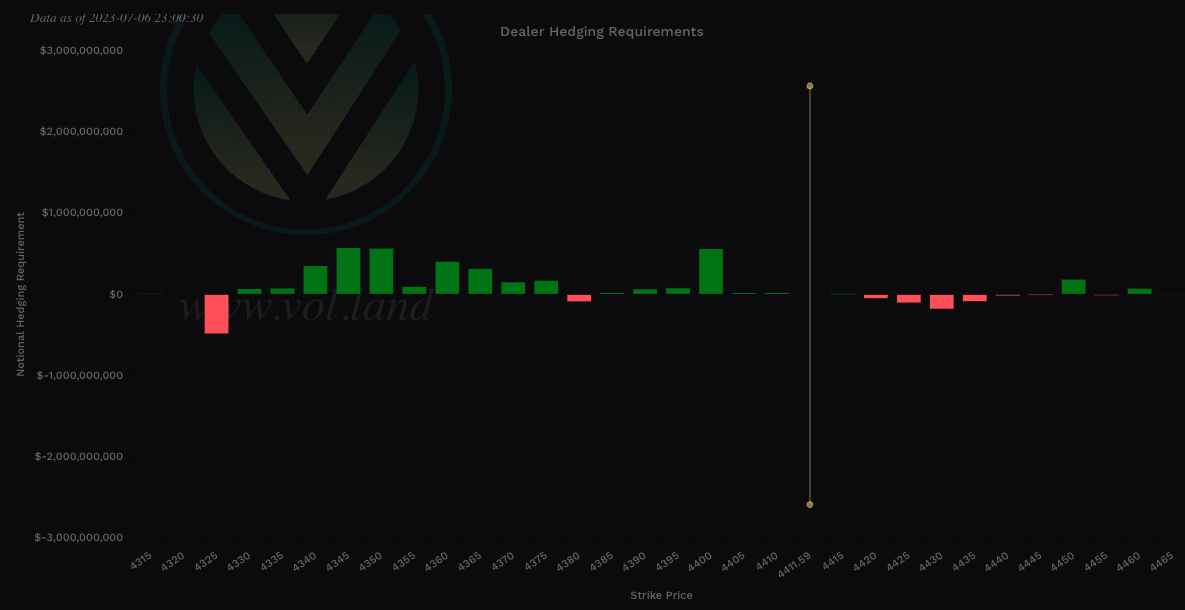
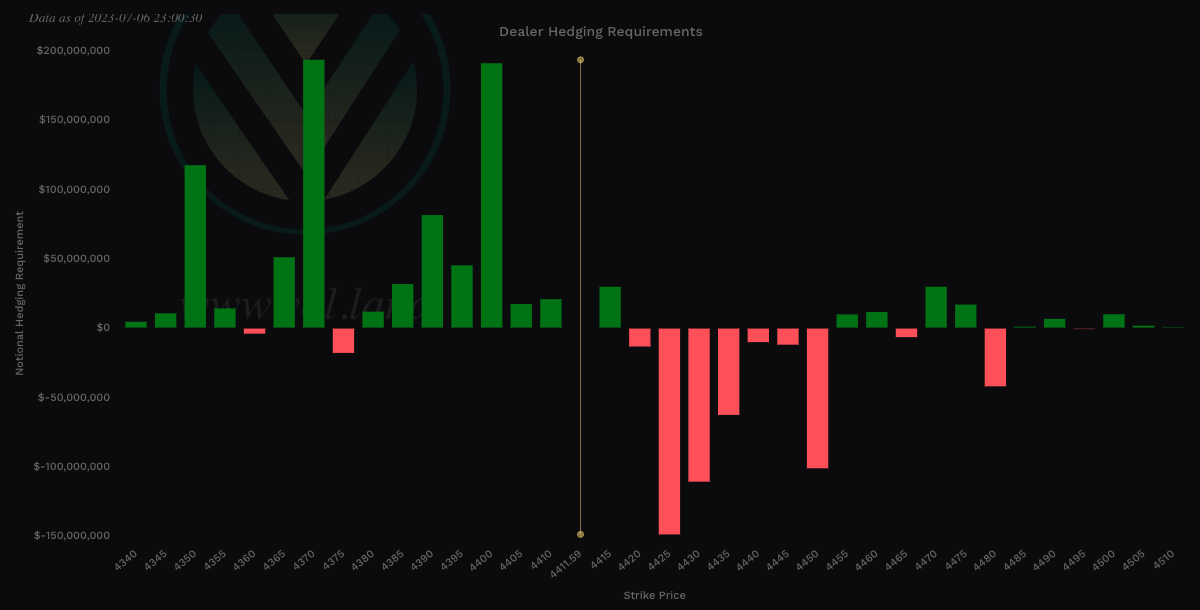
Charm total notional value is bullish - negative is bullish and positive bearish - take the total of the far left and far right values.
The 0DTE view on SPX Charm shows a bullish bias. I would expect any dips to be bought intraday.
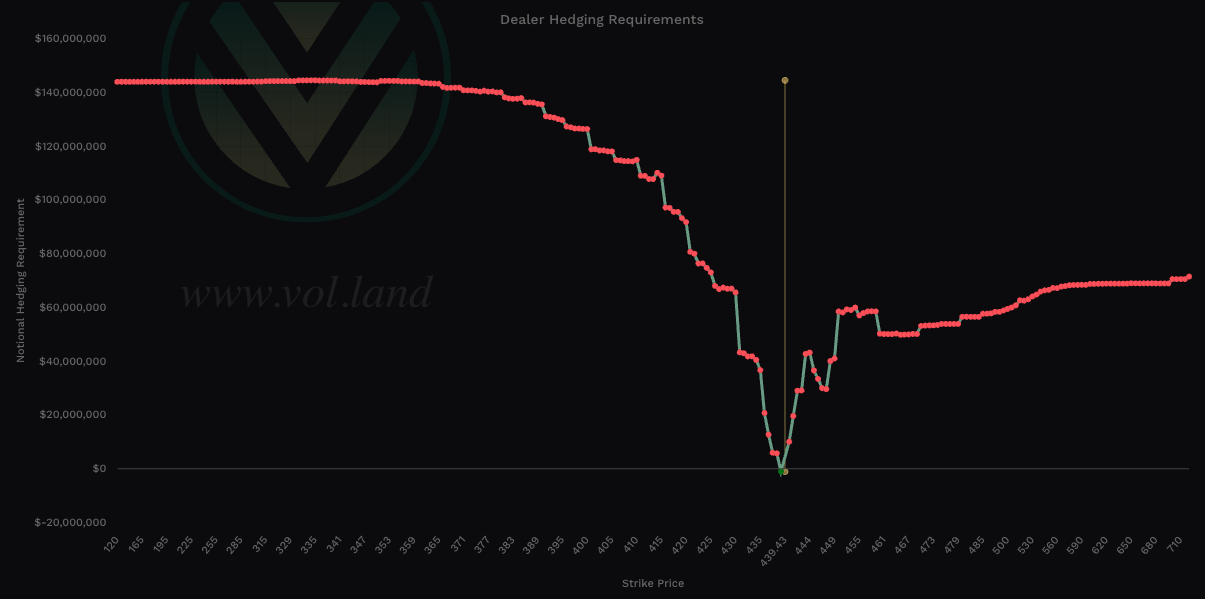
Note that the total notional value of SPX is 10x. Thus it’s charm will outweigh that of SPY’s. For the full charm effect to play out ideally we want to see SPX and SPY in sync.
So what does SPY’s charm tell us? It is leaning bearish at an aggregate view.
If we look at SPY for 0DTE we are seeing a bearish charm view.
To cover our basis…
Welcome to my Substack where I provide a daily SPX trading plan to help guide my intraday trading. The purpose of this letter is not to advice you on your trading or investment decisions. I am simply documenting my daily trading plan for myself to help with planning and execution. These are simply my opinions and the data sourced from the likes of vol.land, TradingView, Quant Data and others. The stock market is risky, gains are not guaranteed. This is not about getting rich quick, but learn to educate yourself and make the necessary financial decisions on your own. This is not financial advice.

