January 30, 2024 SPX, ES, SPY Trade Plan
Market Overview
Hello team and welcome to another installment of our SPX trade plan. What an end to dealer hour right? Two of our trades all triggered in the last hour just showing you paytience or buying time with options can pay off.
What caused that rally? At 3pm est we had the QRA release that the treasuries borrowing estimate was at $805b, but it came in at $750b. So we borrowed less money than we anticipated and the market really liked that. Wednesday they will then determine pre-market where that $750b goes into - bills, bonds or notes.
Don’t be fooled by anyone who says that news is not a catalyst. How I view it is news is a catalyst that can trigger levels which we can then ride the wave from target to target. 🎯 😀
From our trade plan…
Above 4906 target 4915
If VIX continues going down then a breakout of 4915 targets 4925
The VIX hit the 10ema on the 30min chart and as soon as it did it started to “selloff” and that is when we got that last end of day burst.
On ADBE we nailed our bullish bias trade where price basically opened near the close of the last trading session and by 9:42am it hit both of our trade ideas below…
If there is a failed breakdown of 615 or 610 target 620-622.5
Above 622.5 target 630
I did enter a put at 630 on adbe trading it to 625 for a quick 5pt scalp and 16% win on those options.
Our trade idea on SMH hit both ways as well…
If there is a failed breakout of 189-190 target 187
If there is a failed breakdown of 187 target 189-190
All in all this is how I hedge the swings and I am going to discuss more about that below.
One level to keep an eye for on the SPX is 4962. Ultimately, I think we are heading towards this level and it is the market makers expected move for the week. Watch it and see if we trade near it prior to the tech earnings tomorrow. Will we blow right past it or will that be an area of reversal? Again let’s not predict and let’s get into the trade plan.
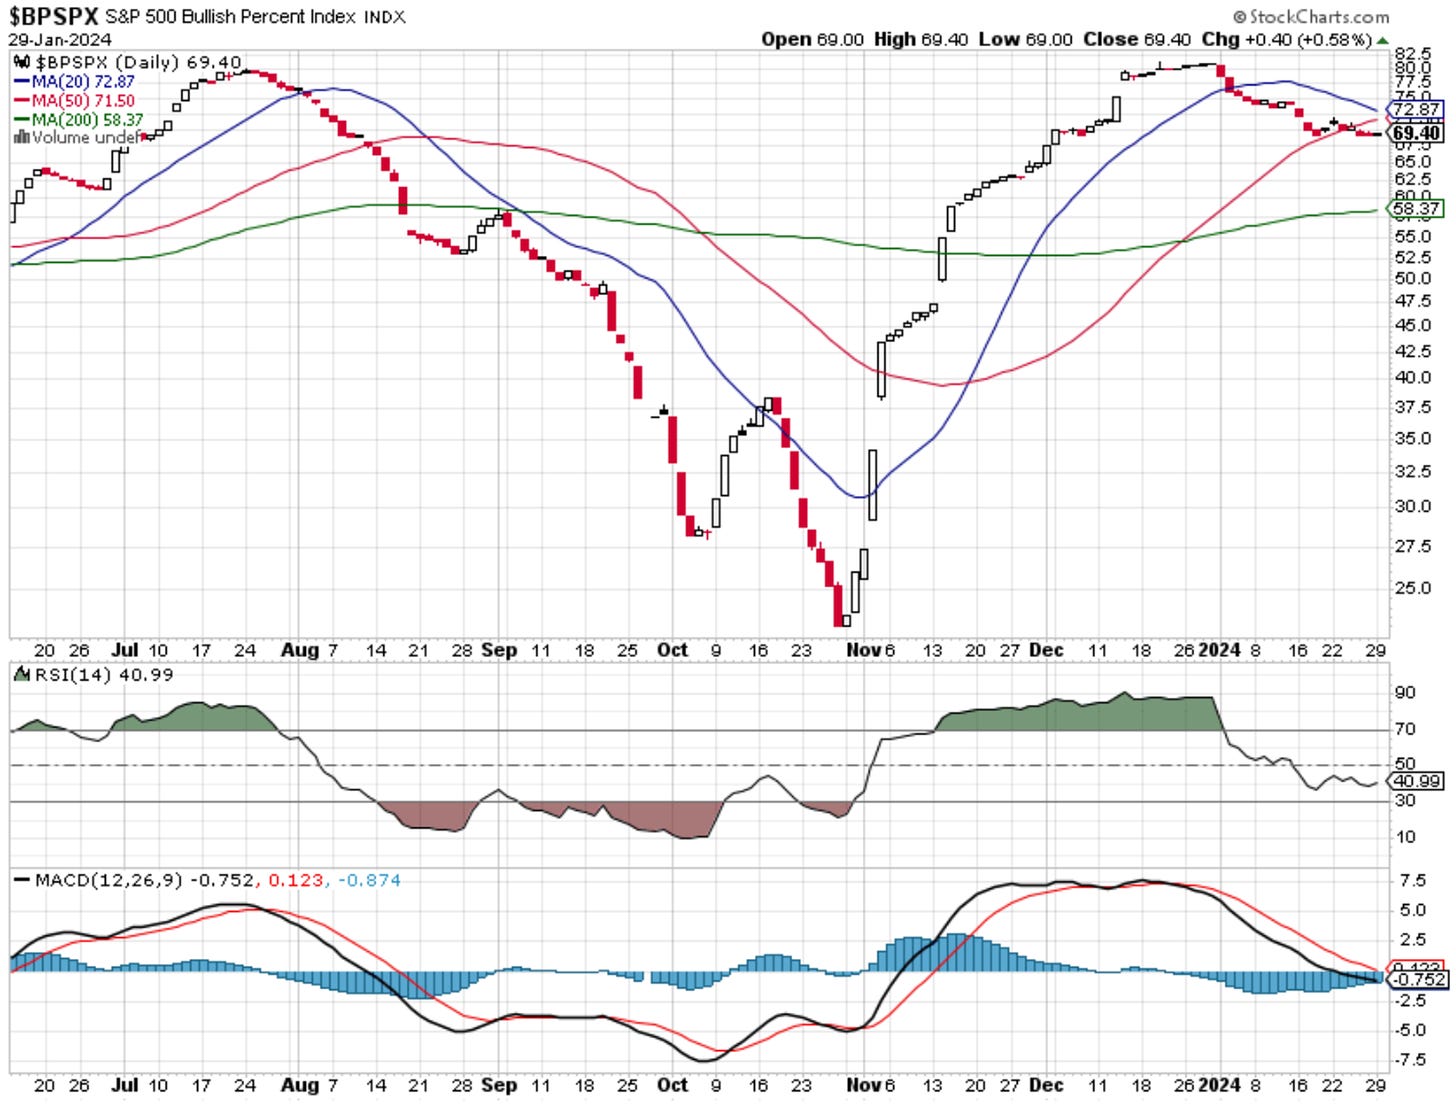
The BPSPX is showing signs of support here and could target back towards its 50MA. Ultimately where I think the larger selloff comes is when the 20MA crosses below that 50MA.

So far on the month the SPX is up 3.32%…
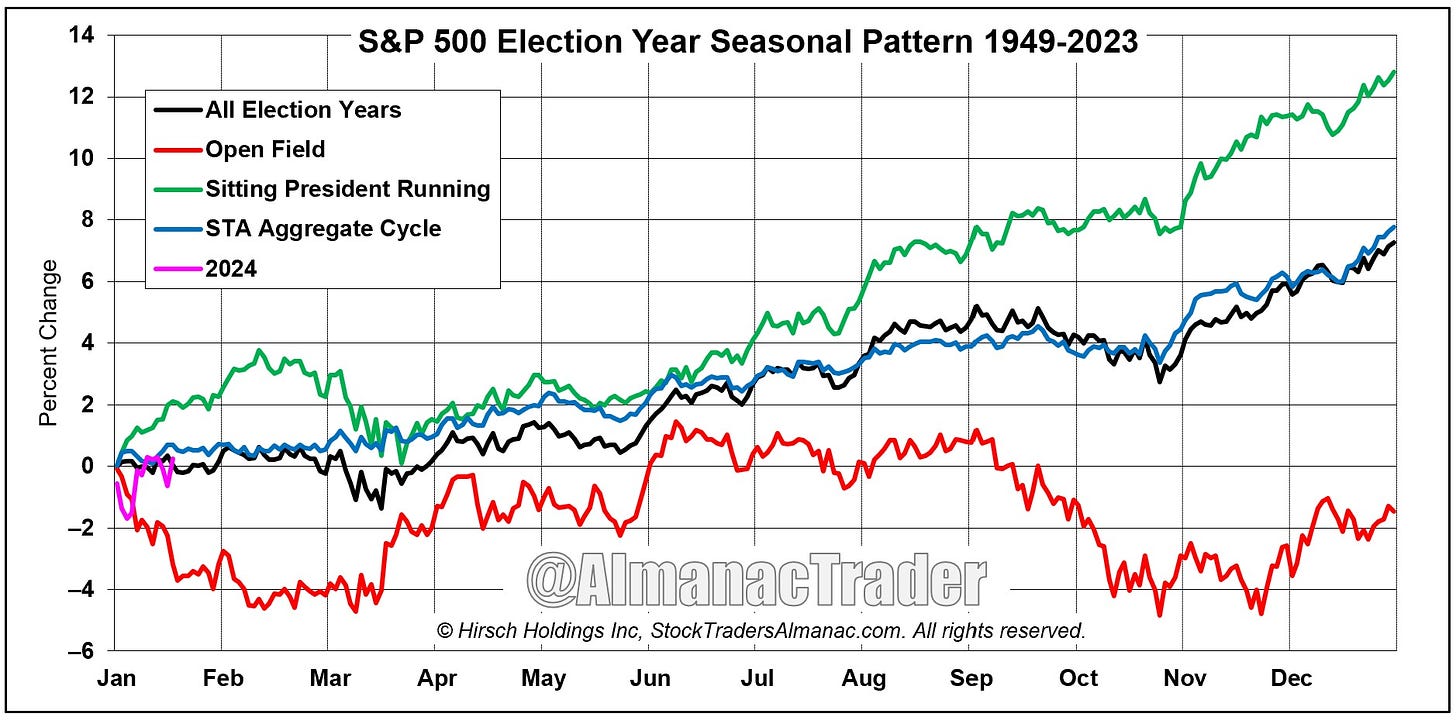
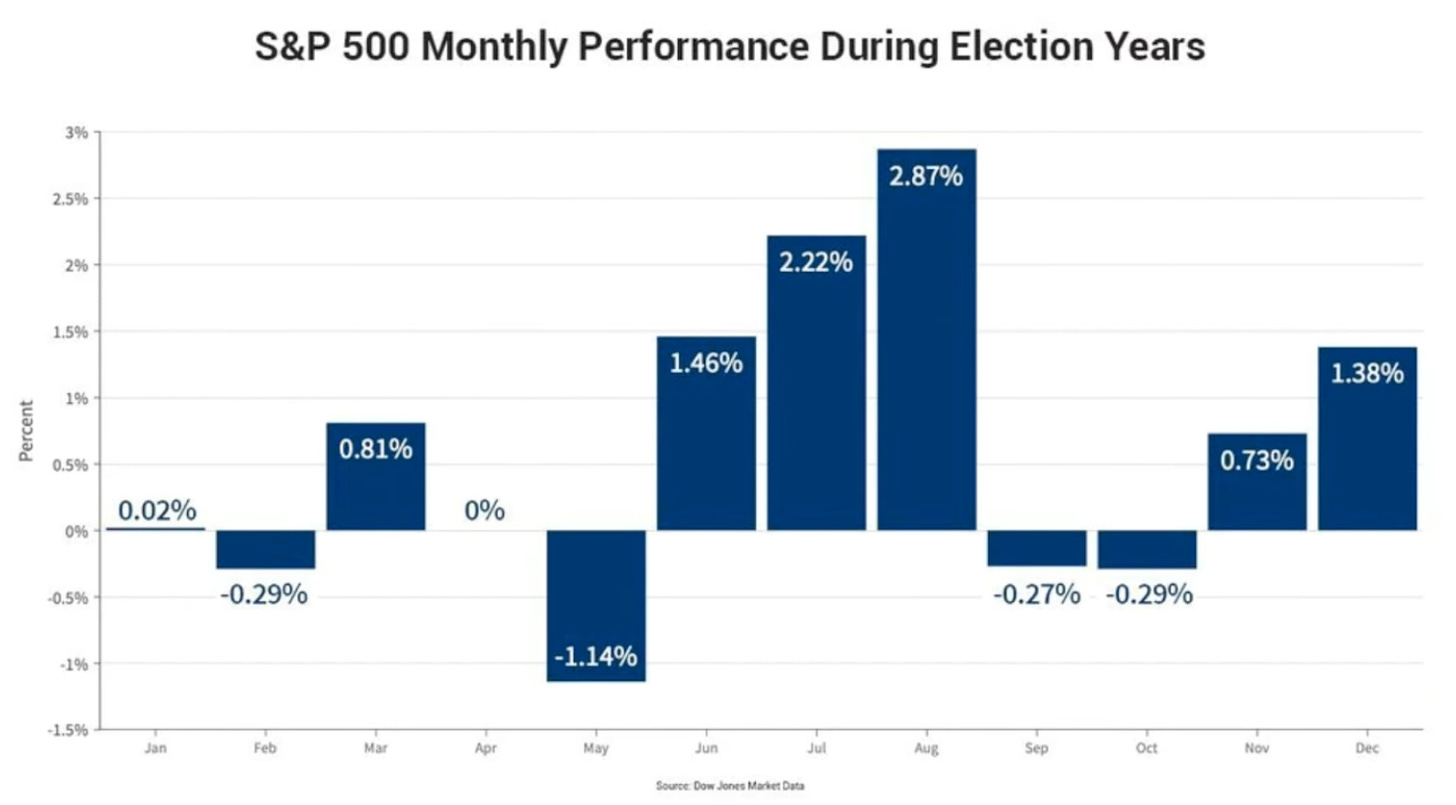
What we have to keep in mind with some of these seasonality charts is that we are in an election year. Seasonality instead looks like this which is another 2ish percent up from now until early/mid February before we then get a selloff going into March which negates the gains we make in January/February…
We will continue to monitor some of these seasonality views. There are a few of them out there and it will be important to see how the month ends to give us more insight into which seasonality chart it follows.

Just a reminder for those not subscribed to our monthly paid service the newsletter will end here for you. You can still join us for the rest of the plan by subscribing below. Keep reading with a 7-day free trial
Subscribe to Dark Matter Trade to keep reading this post and get 7 days of free access to the full post archives.


