January 2, 2024 SPX, SPY, ES Trade Plan
Market Overview
First and foremost Happy New Year 🎊 to all of you. 2023 was finally the year trading clicked for me and for many of you you took the ride with me along with Volland as we nailed trade plan after trade plan - at least most of them apologize for those choppy days ha.
We have refined and worked on multiple strategies including incorporating data from Volland, Wayne Whaley, and others. The formula while changed continues to provide us the desired outcomes on an intraday basis and we will continue to do that. Start a trade in the morning and cut it at minimum before the close of the session. This is what I excel in and do well and we will focus on this. Where possible and it makes sense we will share any SPX/SPY swing trade ideas.
I will be introducing mini-plans for ADBE, AVGO, and a few tickers starting next week. Currently these two tickers are going through a bit of consolidation so best to avoid them until then. ENPH was a fun one to trade in the past and same with LULU. Look for these tickers to come out in a separate plan/letter.
For those who haven’t subscribed this is a great opportunity to subscribe.
For as little as $15/month we provide daily trade plans for intraday traders and also provide great educational content.
For those who are interested in what the JP Morgan Collar trade is let’s review it so we can explain it.
Essentially, what the collar trade did was buy (closes) +4515C, sells (writes) - 5015C, buys (opens) +4510P, and sells (writes) -3800P. So what does this mean?
JPM thinks that we go higher and if there is a selloff it is minimal from current prices
JPM thinks that 3800 is a MAJOR level of support for the market and don’t expect to see it go below here
JPM thinks that 4500 might be an “interim” bottom in Q1 - what I think they are saying here with this trade is they have less confidence in a move to the downside
JPM thinks that 5015 is a target to the upside
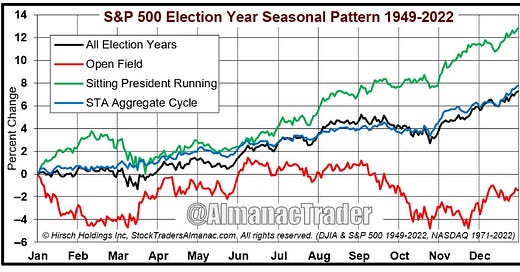
What is really interesting is if you include the seasonality chart you can kind of see Q1 aligns a bit with this thinking with a clear push up during an election year with a sitting president. Now this is just another data point, we don’t want to predict, but react to the levels and targets…
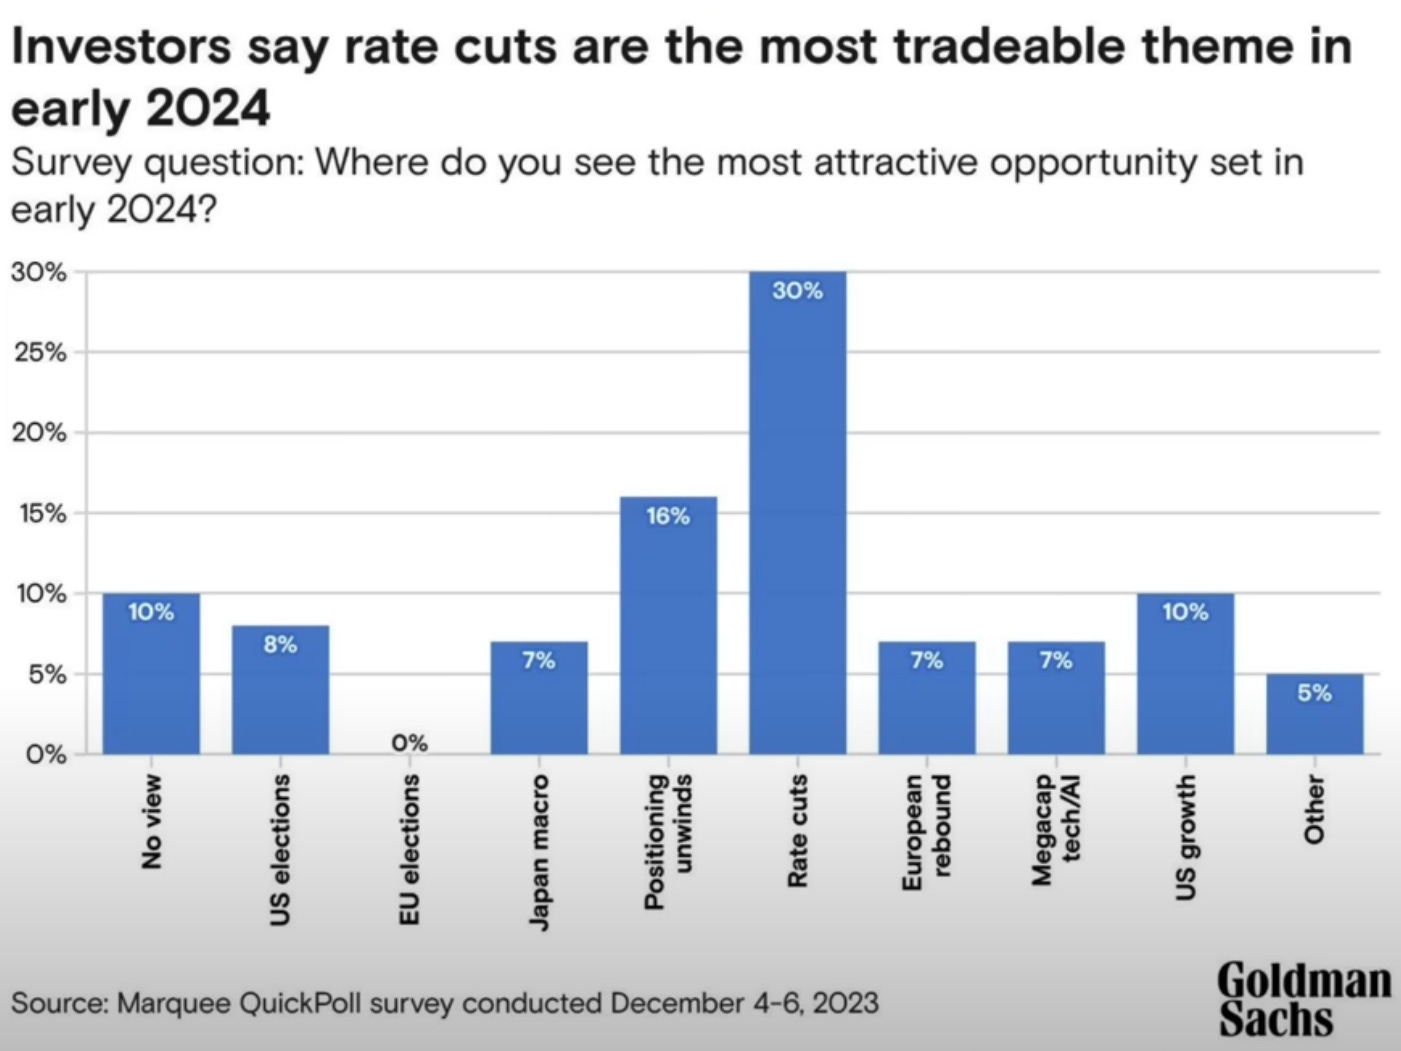
What themes are investors curious going into 2024? As you can predict the rate cuts will be the most important theme to the market and whether we land that soft landing.
Now going into this week we are technically still in a “holiday” like volume for Tuesday. Until we see the avg volumes we had before the holiday’s expect a bit more chop and small ranges to trade over the coming week. This should ramp up Wednesday where we have FOMC minutes, but prior to it we have data at 10am est with JOLTS Job Openings. Thursday provides us with the ADP Non-Farm Employment Change and on Friday we have the Non-Farm Employment change and ISM Services PMI. Friday overnight Europe also reports CPI numbers.
Let’s jump into the trade plan and let’s review what we can expect in tomorrow’s SPX/SPY/ES price.
News Catalysts
9:45am est - Final Manufacturing PMI
10:00am est - Construction Spending m/m
For more information on news events, visit the Economic Calendar
1/2 - SPX/ES/SPY Trade Plan
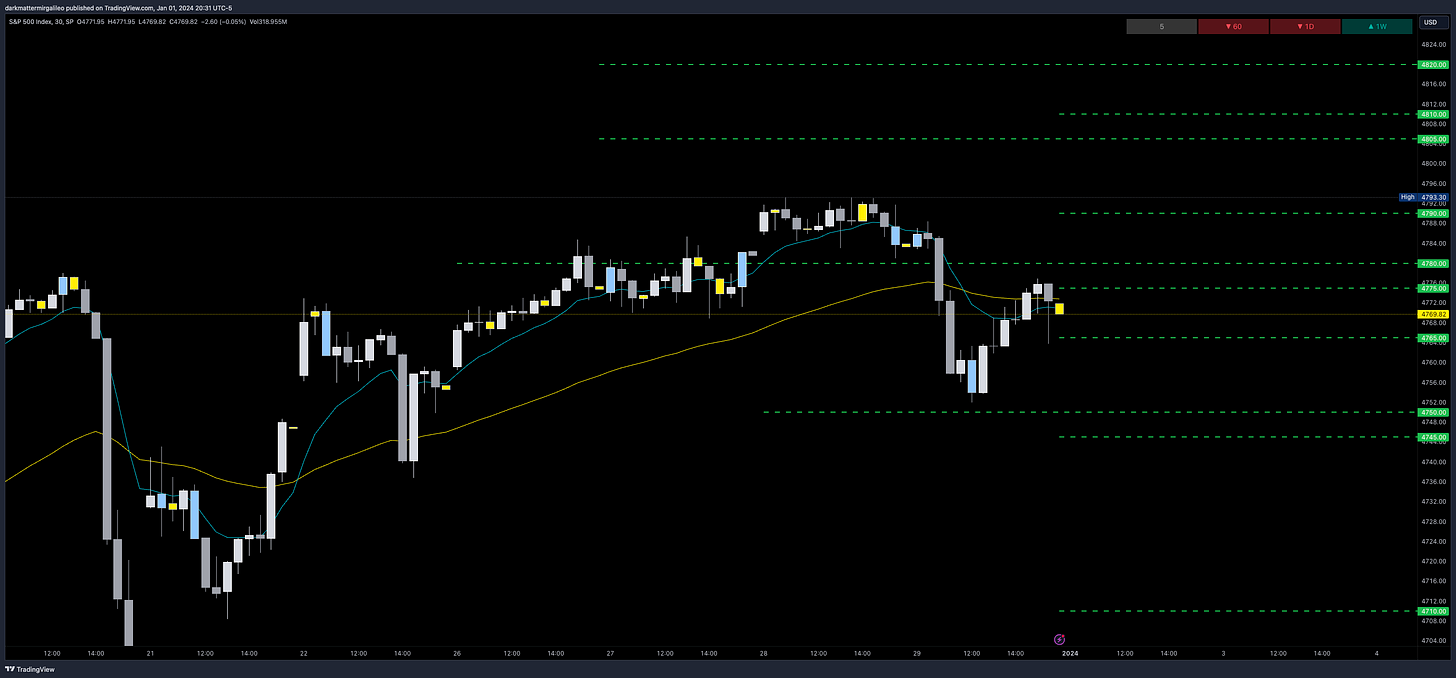
Bullish bias:
If there is a failed breakdown of 4765 or 4770 target 4780
Above 4780 target 4790
If VIX continues going down then a breakout of 4795 targets 4805
If we have volume and a catalyst a breakout of 4810 targets 4820
Highly unlikely, but putting it out there
Bearish bias:
If there is a failed breakout of 4775 target 4765
Below 4765 target 4750
If VIX continues going up then a breakdown of 4745 targets 4730
If we get a catalyst for further selloff then a breakdown of 4730 targets 4710
As always keep an eye on Volland30 and the VIX for trend continuation or reversals.
Remember you can use this SPX trade plan to trade ES or SPY. ES value is approx. 50pts more than the SPX levels shared. To get SPY levels simply take the SPX levels and divide by 10.03.
SPX/ES/SPY Swing Trade Idea:
I have cut most of my SPY call swing trades for 1/19 expiry. I have runners left to see if we get a break towards 480, but if we test 4780 and can’t break above it I will cut these trades. I have been riding longer than most on this trade, but just letting you know my plan on this if you are still swinging.
1/2 SPX/SPY/ES Intraday Overview (TL;DR)
Trade and react to key levels…don’t just randomly enter trades. Likely to have holiday volume still tomorrow, but in the event we do get some volume here is what we can expect.
If the bulls can hold 4770 max 4765 we will go up and target 4780 where if we get a breakout there we will target 4790. Be wary of any overshoots to set new highs that could reverse and sell back down. If we can break and hold 4795 then we will get to 4805. With the way vega is at that 4800 strike I just don’t think we get there yet…
For the bears defend 4775 and you will push price back to 4765. A breakdown of 4765 will help push price back towards 4750, but be on the lookout for fast reversals out of this zone as it looks to be a new area of accumulation. Otherwise a breakdown of 4745 will target 4730 and if we lose 4730 trouble resides targeting price to 4710.
SPX - The Why Behind the Plan
Key Levels Overview
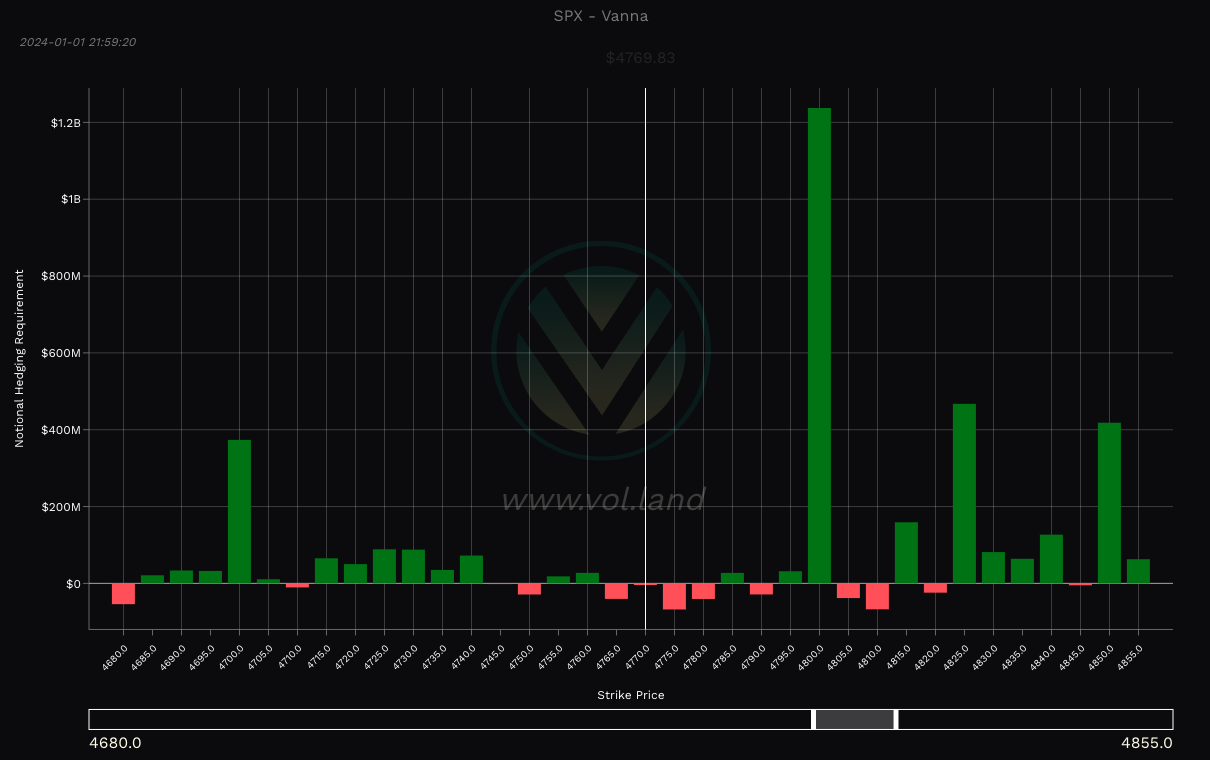
4780-4800 - This is the big zone where dealers are just not ready to push price above with the massive amount of positive vega sitting at the 4800 level - it has over $448b worth of positive vega sitting there.
When the vega on this level reduces it is when we are ready to break that 4800 level. Until then be wary of any selloffs if we come into this zone again. Thus only play breakouts or failed ones in this zone.
4770-4780 - within this zone I am only looking to play breakouts or breakdowns. Don’t trade within this zone otherwise you could be chopped and reversed on rather quickly.
4760-4745 - it’s starting to find some consolidation in this zone. I am going to continue to watch this zone for potential consolidation and if we continue to see it acting as support this is positive for our seasonality view and our break of 4800 we need. If this zone fails though it is a quick ride back to 4710 with stops at 4725 and 4715.
Volume Profile & Trends
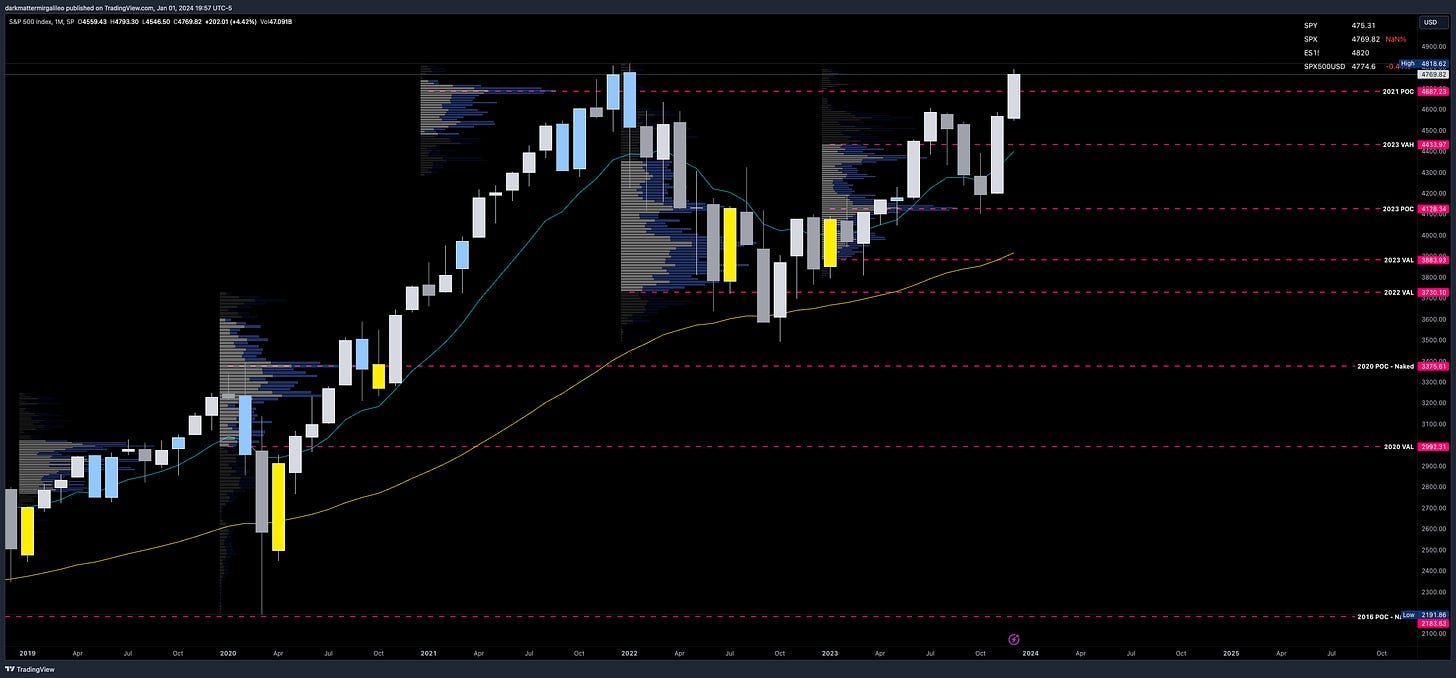
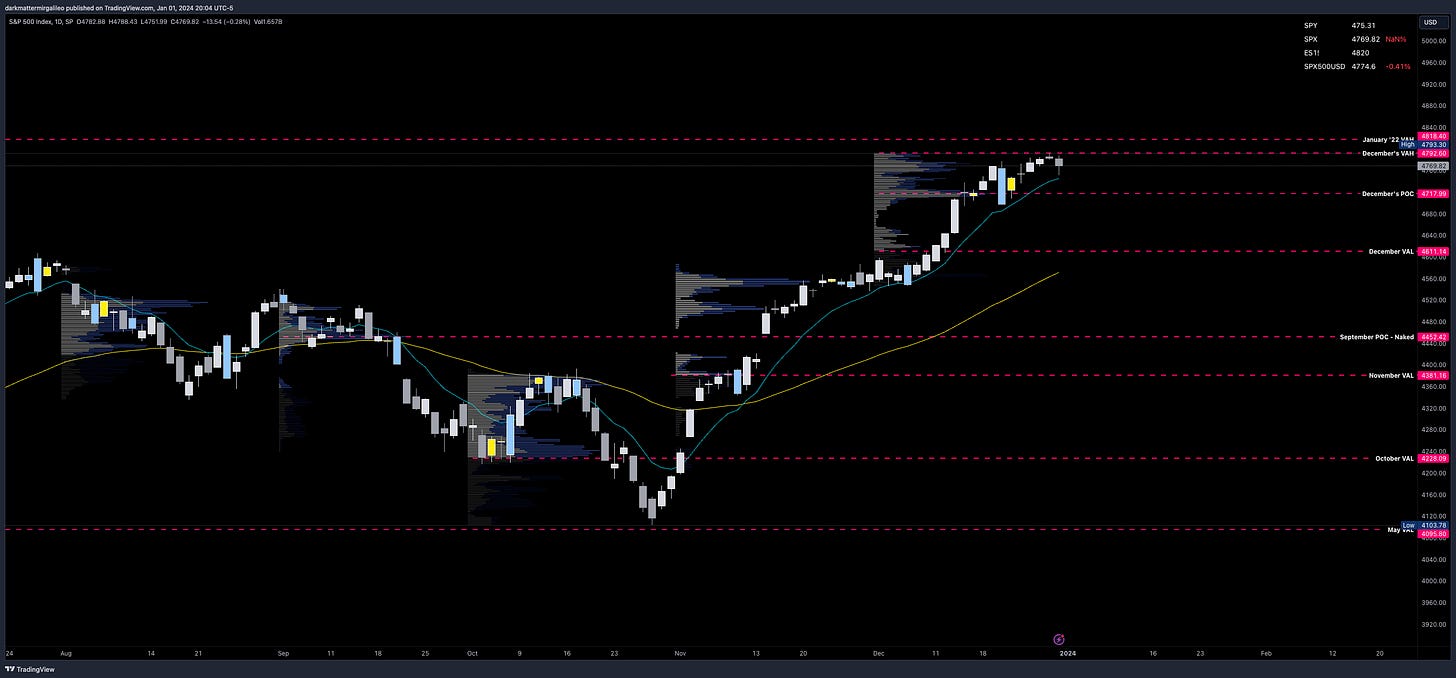
Now that we have the year complete, let’s review our yearly profiles on the monthly chart…
4687 - 2021 POC
4433 - 2023 VAH
4128 - 2023 POC
3883 - 2023 VAL
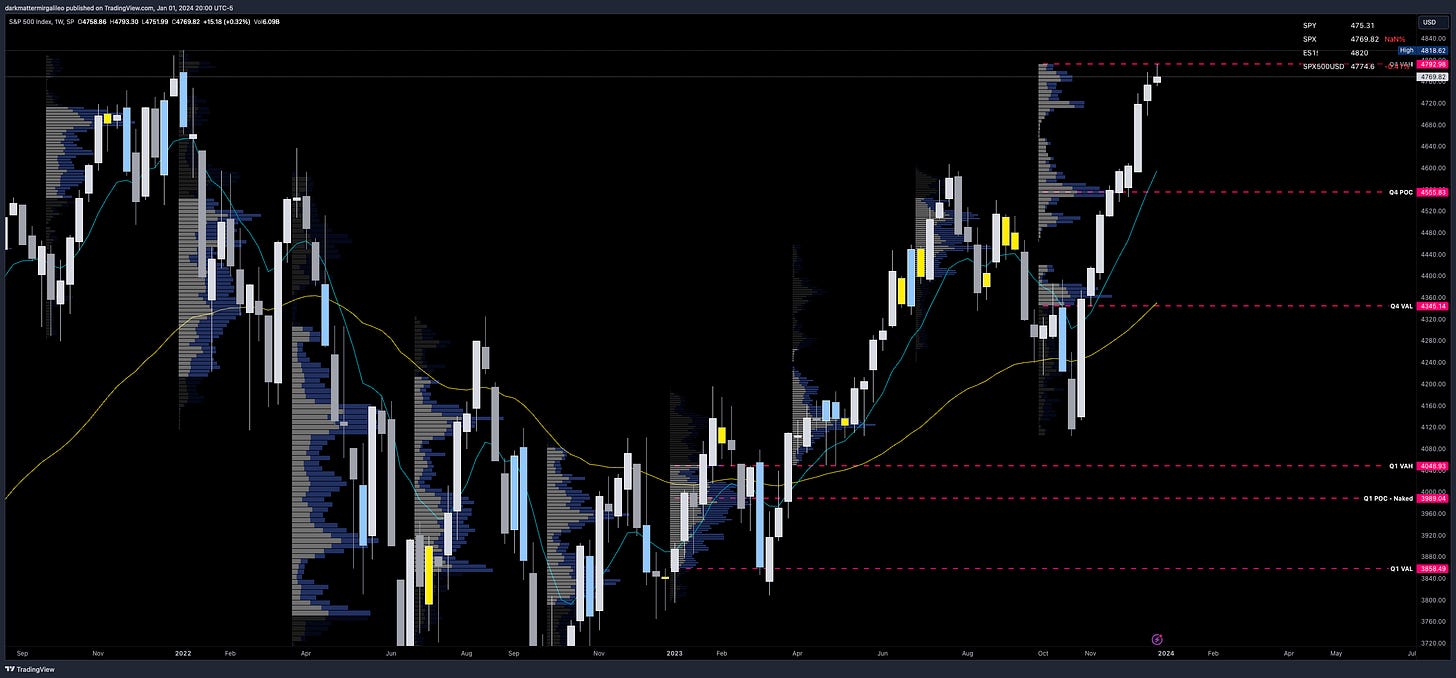
From a quarterly volume profile on the weekly chart some key levels are seen.
4792 - Q4 VAH
4555 - Q4 POC
4345 - Q4 VAL
If we take a look at the daily chart and review the monthly volume profile we find the following levels…
4818 - January ‘22 VAH
4792 - December's VAH
4717 - December's POC
4611 - December’s VAL
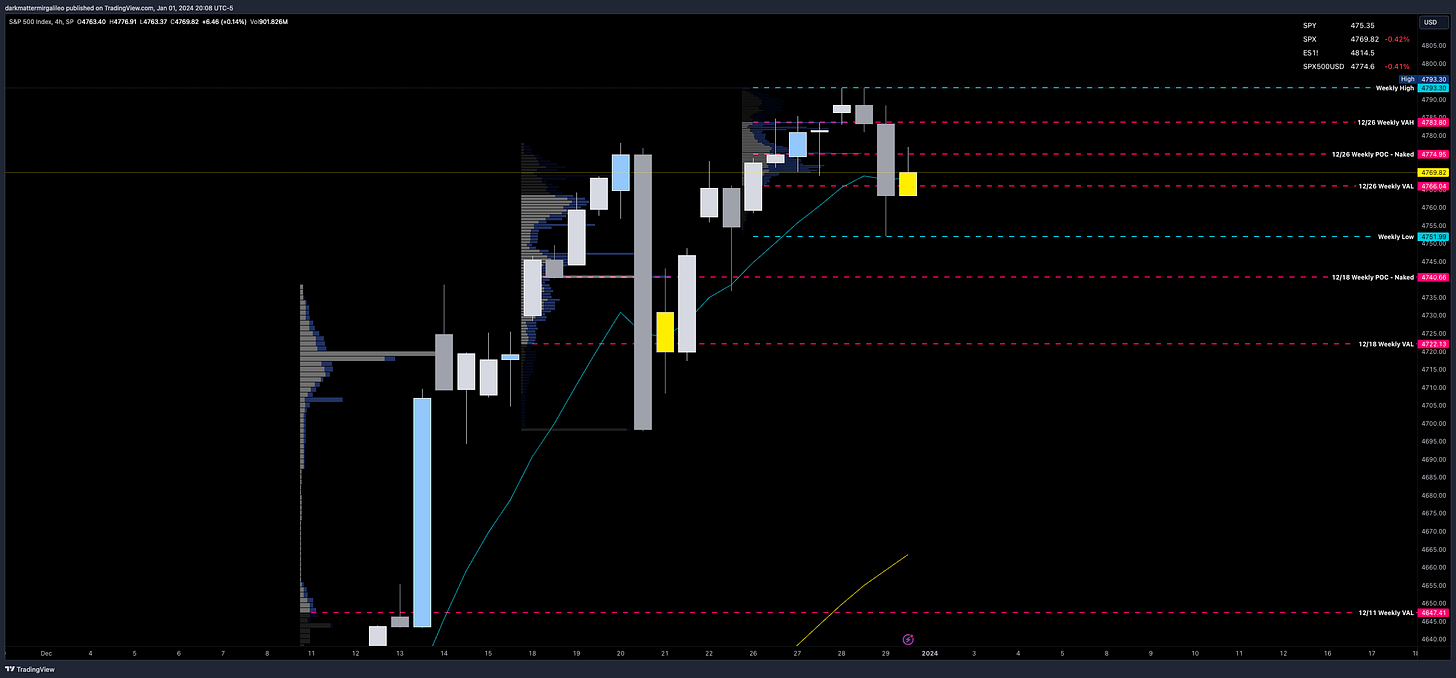
Let’s now look at the 4hr chart and review what the weekly volume profile levels show.
4818 - All Time Highs
4793 - Previous Weekly High
4783 - 12/26 Weekly VAH
4774 - 12/26 Weekly POC
4766 - 12/26 Weekly VAL
4751 - Previous Weekly Low
4740 - 12/18 Weekly POC
4722 - 12/18 Weekly VAL
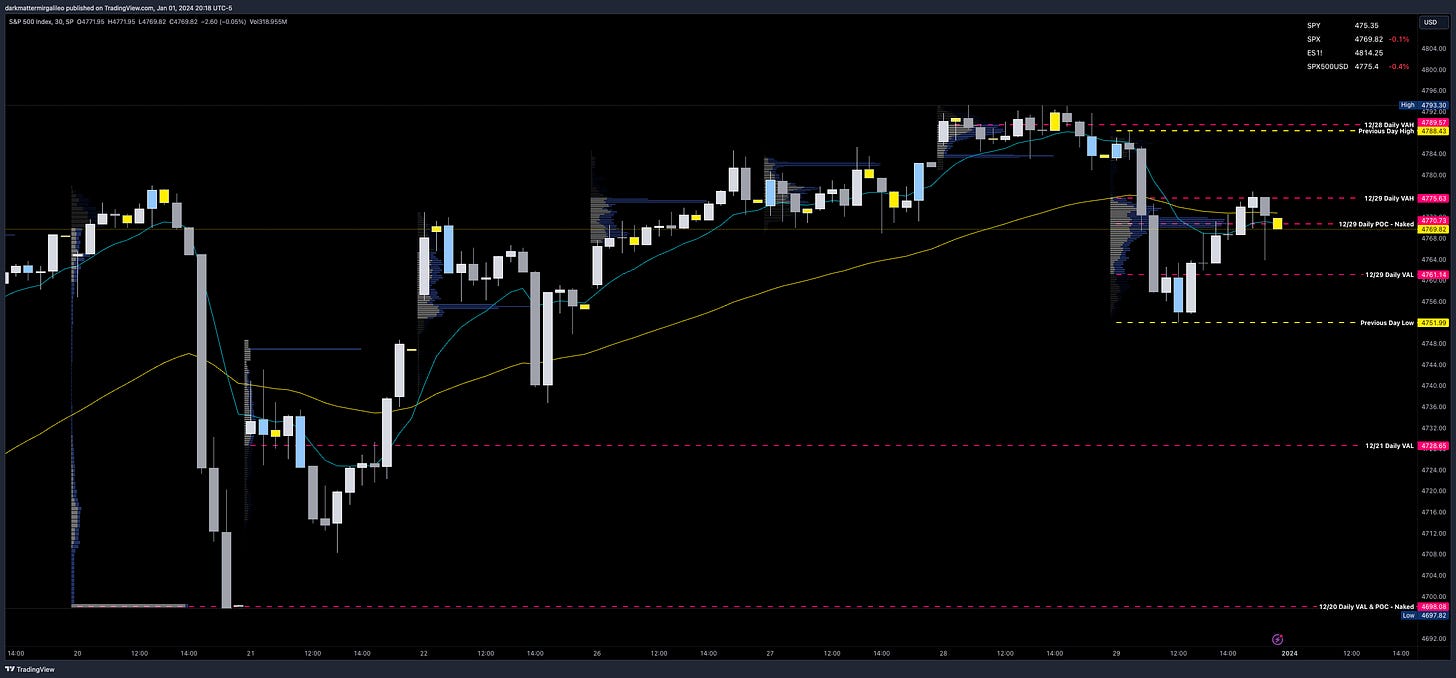
On the smaller timeframe and intraday let’s go to our 30min chart where we will put our session volume profile on. Our levels of importance are…
4789 - 12/28 VAH
4788 - Previous Session High of Day
4775 - 12/29 VAH
4770 - 12/29 POC - Hasn’t been breached
4761 - 12/29 VAL
4751 - Previous Session Low of Day
4728 - 12/21 VAL
Volland Data
For a better understanding of the various greeks below I would suggest you visit the Volland YouTube Page. Volland provides unique data showing where dealers are positioned providing in my opinion a higher degree of conviction to where price may move to.
Vanna - Levels where price may repel or act as magnet
Remember for price to go above spot through a magnet or repellent VIX and IV must decrease or stay flat. For price to go below spot through a magnet or repellent VIX and IV must increase.
Positive vanna - will act as magnet
Negative vanna - will act as repellent
When price goes through a positive or negative level it will flip it - ie negative becomes positive and vice versa.
Above Spot:
4775-4780 - negative vanna
4790 - negative vanna
4805-4810 - negative vanna
4820 - negative vanna
4845 - negative vanna
Below Spot:
4765 - negative vanna
4750-4745 - negative vanna
4710 - negative vanna
Orderblocks (OB)
Resistance levels - at these levels I want to see if price rejects to short or consolidates for a push up. I couple this data with Volland, intraday option flows, and Dark Pool levels. Higher timeframe OB’s or FVG will be harder to break. OB’s are the stronger levels over FVG’s.
4770-4777 - OB (1hr chart)
4774 midline
4782-4787 - OB (30min chart)
4784 midline
4774-4807 - OB (1hr, 2hr, 4hr chart)
4790 midline
Support levels - at these levels I want to see if price rejects to long or consolidates for a push down. I couple this data with Volland, intraday option flows, and Dark Pool levels. Higher timeframe OB’s or FVG will be harder to break. OB’s are the stronger levels over FVG’s.
4758-4749 - OB (2hr chart)
4754 midline
4735-4708 - OB (2hr chart)
4722 midline
4729-4721 - OB (30min chart)
4725 midline
4718-4712 - OB (15min chart)
4715 midline
4766-4736 - OB (4hr chart)
4751 midline
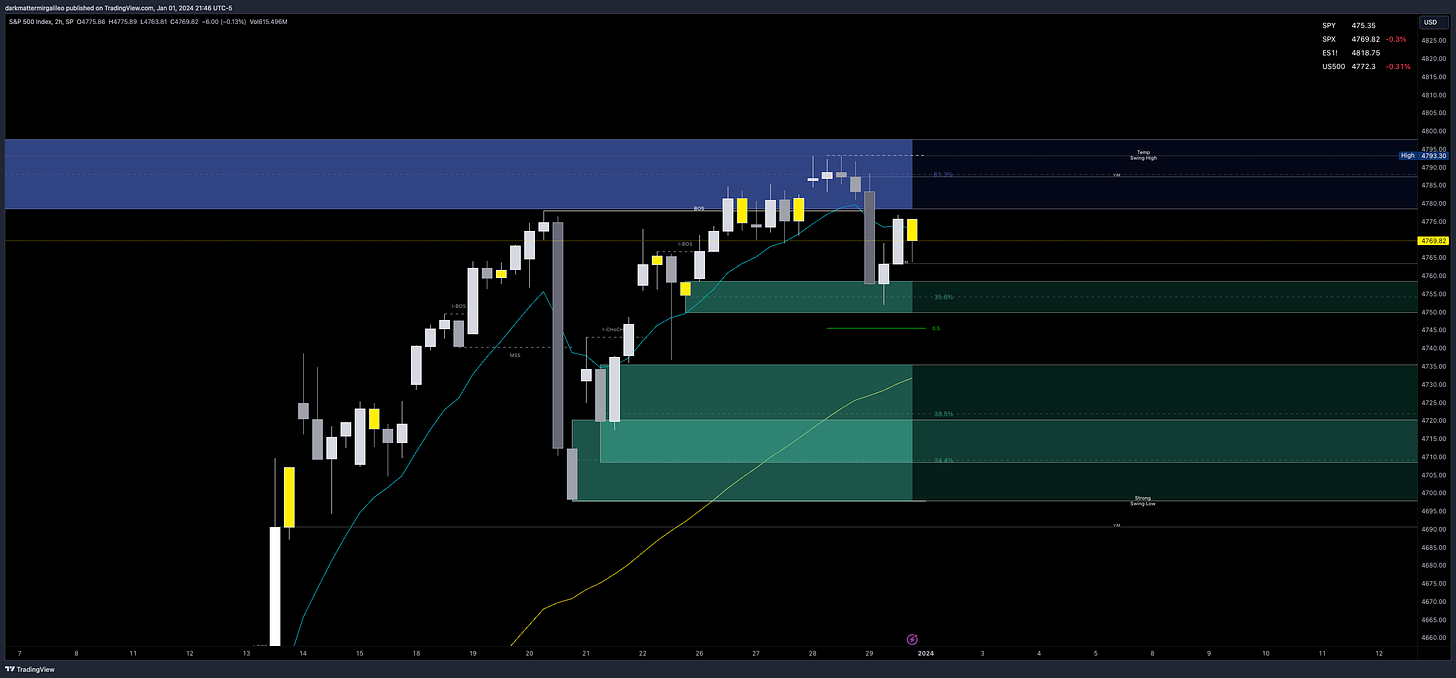
Overlay of Key Levels
Above Spot:
4770-4777 - OB (1hr chart)
4774 midline
4770 - 12/29 POC - Hasn’t been breached
4774 - 12/26 Weekly POC
4775-4780 - negative vanna
4775 - 12/29 VAH
4783 - 12/26 Weekly VAH
4782-4787 - OB (30min chart)
4784 midline
4790 - negative vanna
4788 - Previous Session High of Day
4789 - 12/28 VAH
4792 - Q4 VAH
4792 - December's VAH
4793 - Previous Weekly High
4774-4807 - OB (1hr, 2hr, 4hr chart)
4790 midline
4805-4810 - negative vanna
4820 - negative vanna
4818 - All Time Highs
4818 - January ‘22 VAH
4845 - negative vanna
Below Spot:
4765 - negative vanna
4766 - 12/26 Weekly VAL
4761 - 12/29 VAL
4750-4745 - negative vanna
4751 - Previous Weekly Low
4751 - Previous Session Low of Day
4740 - 12/18 Weekly POC
4758-4749 - OB (2hr chart)
4754 midline
4729-4721 - OB (30min chart)
4725 midline
4728 - 12/21 VAL
4722 - 12/18 Weekly VAL
4717 - December's POC
4710 - negative vanna
Weekly Option Expected Move
SPX’s weekly option expected move is ~51.69 points. SPY’s expected move is ~5.33. That puts us at 4821.51 to the upside and 4718.13 to the downside. For SPY these levels are 480.68 and 470.02.
Remember over 68% of the time price will resolve it self in this range by weeks end.
To cover our basis…
Welcome to my Substack where I provide a daily SPX trading plan to help guide my intraday trading. The purpose of this letter is not to advice you on your trading or investment decisions. I am simply documenting my daily trading plan for myself to help with planning and execution. These are simply my opinions and the data sourced from the likes of vol.land, TradingView, Quant Data and others. The stock market is risky, gains are not guaranteed. This is not about getting rich quick, but learn to educate yourself and make the necessary financial decisions on your own. This is not financial advice.

