February 5, 2024 SPX, ES, SPY Trade Plan
Market Overview
Thanks to a very favorable outlook from META and AMZN, after a brief selloff post NFP jobs data, the market found its footing and overcame some of the higher than expected jobs numbers.
The bears simply couldn’t do any damage last week even with the FOMC and NFP providing it many reasons to do so. We also broke above a key critical zone at 4900 and then 4930.
Based on my analysis I think dips are going to continue to be bought until OPEX next Friday. At that point this is when we could face some resistance and a selloff - retracement not bear market like selloff. This is the selloff we were waiting for at 4850 and 4900 so I have updated my swing put overview below in the trade plan for subscribers.
Thus, my goal this week is to find an opportunity to buy the dip intraday and if there is an opportunity near 4900-4930 I would ride it till above 5000 where I think the SPX is going to hit prior to OPEX next week. So in summary the goal here is to find a dip to buy a weekly for next week and hold with 5000 as a target.
Otherwise we will continue to trade intraday taking trades where we scale in and out intraday.
From a news catalyst relatively mute week compared to last week. We still have ER in a few tickers left to go, but the biggest callout will be the 10-year bond auction on Wednesday along with the 30-year bond auction.
Additionally we have various FOMC members speaking throughout the week.
2/5 News Catalysts
10:00am est - ISM Services PMI
2:00pm est - FOMC Member Bostic Speaks
For more information on news events, visit the Economic Calendar
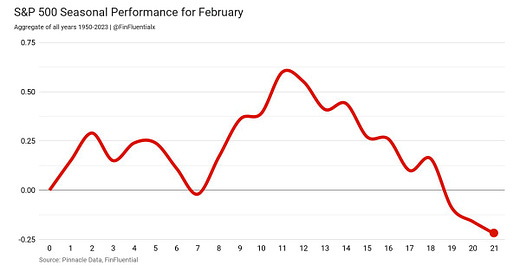
Seasonality favors a small pullback this week before rising again going into OPEX next week.
It tracks with the larger yearly season calendar during an election year.
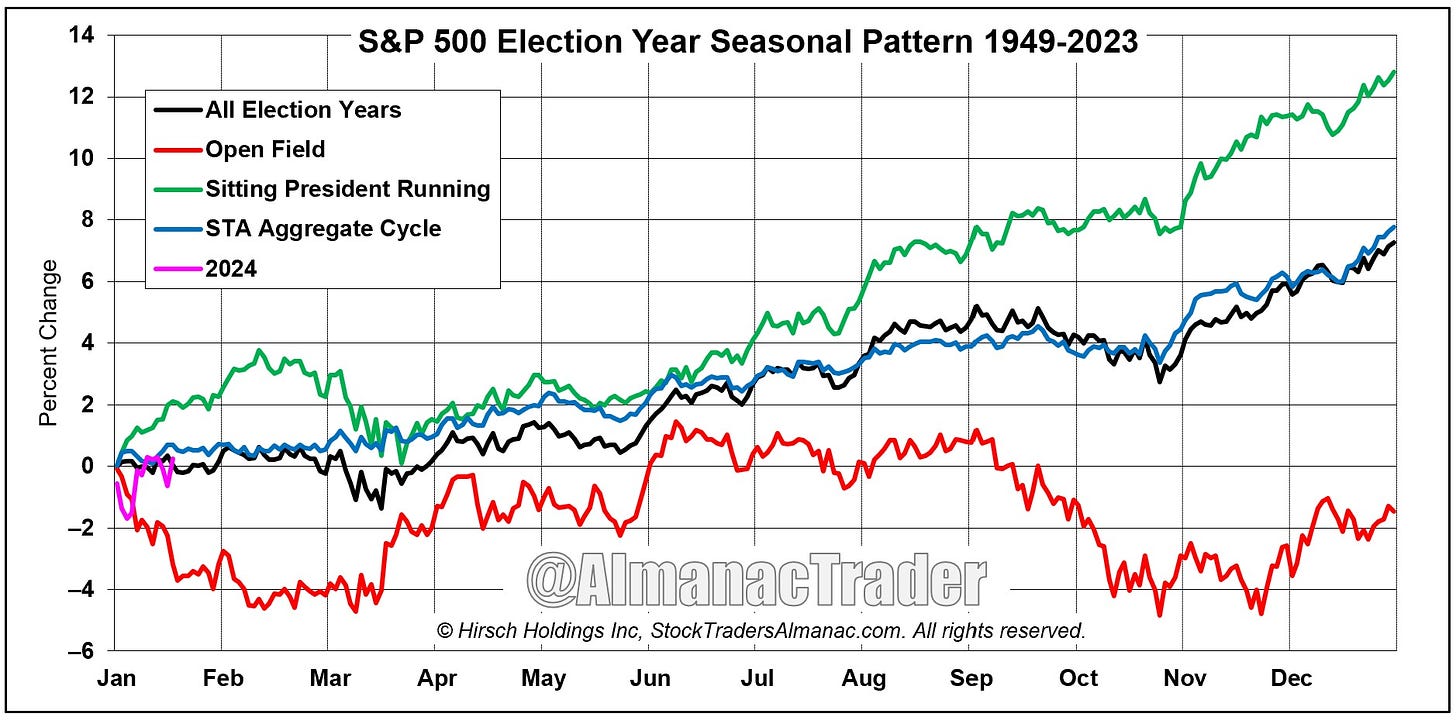
Readers have known that my target in 2024 is 5300 on the SPX this year. To get there we need some retracement because it will be constructive to bring newer buyers at lower prices. Wayne Whaley has provide two great studies showing what the yearly outlook could look like.
TOY - Turn of the Year - barometer is used here for the periods from Nov 19 to Jan 19. The 2024 TOY is 7.22%. Since 1950 if TOY was > 3%, the next year (Jan19-Jan19) was 35-2 for an avg 16.5% gain with 2 single digit losses. Feb-April is 32-5 for an avg 3 mt gain of 4.23%.
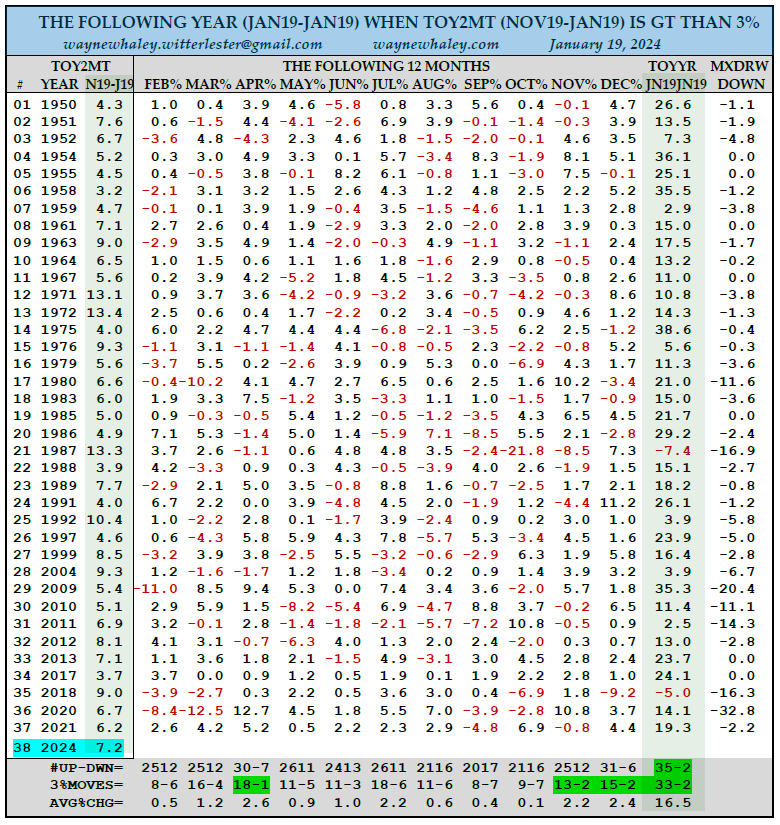
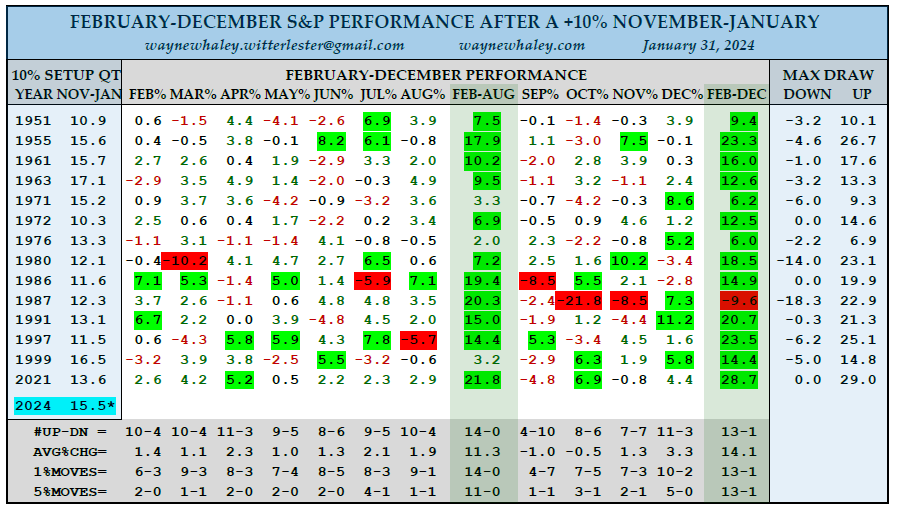
Below graphic, after a +10% from November-January the market is up 13 times and down 1 the rest of the year. During that time look at the max draw down/up. You can see there is going to be a great opportunity when we do get a retracement we see a nice buying opportunity for the rest of the year.
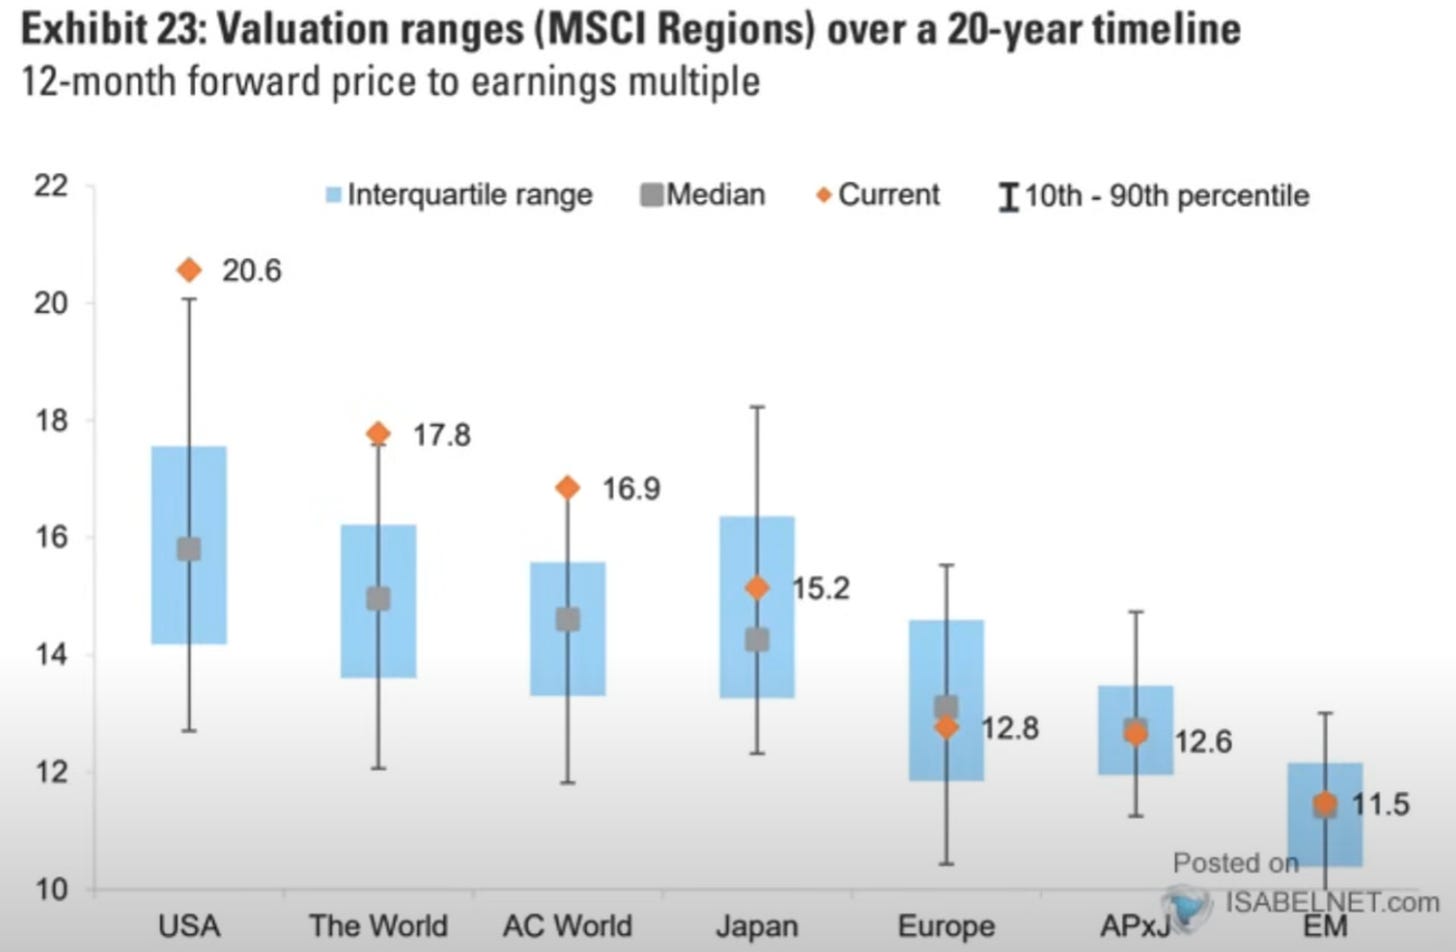
I mention this often that when investing long or even medium term you want to keep an eye out for the forward P/E on the market. Is it priced too high? Price too low? Or just right? Here is a great view from Goldman Sachs showing the how expensive or not various world markets are.
The USA is out of its typical range which is at 16. The one shocking outcome from this chart is how far behind the EU is. Could be a great area of opportunity to go long on those markets as it tries to catch up with the rest of the world.
Just a reminder for those not subscribed to our monthly or yearly paid subscription the newsletter will end here for you. You can still join us for the rest of the plan by subscribing below. Keep reading with a 7-day free trial
Subscribe to Dark Matter Trade to keep reading this post and get 7 days of free access to the full post archives.

