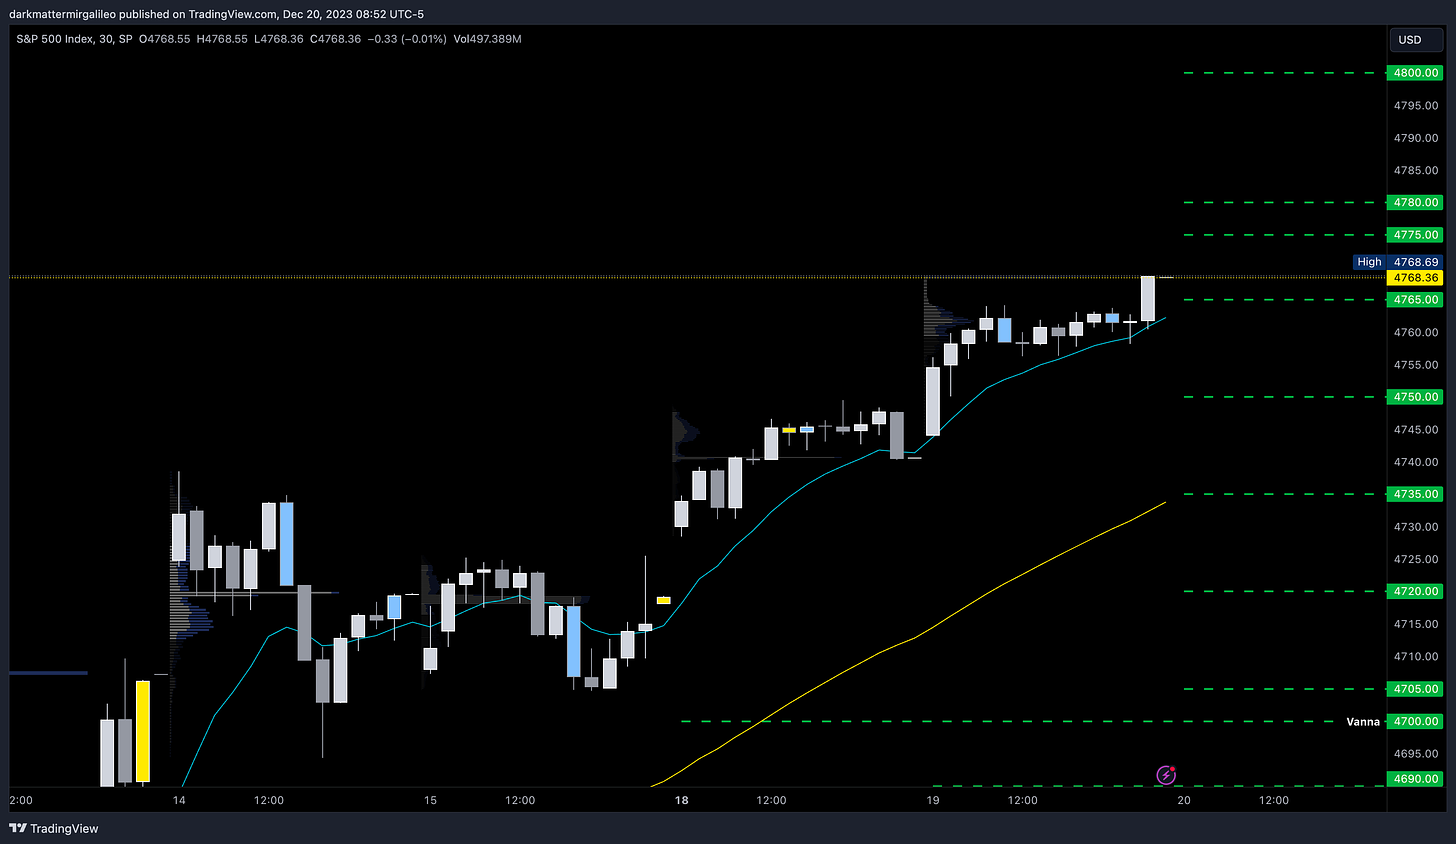
December 20, 2023 SPX, SPY, ES Trade Plan
Market Recap
Going to skip the recap for today, but going long at the open or after breaking 4755 was the key to success. My biggest callout here is I hope you all have avoided 0DTE’s. While they can return some insane returns during low volume/holiday weeks they tend to decay quite a bit if you rode out to the target at 4765. So be careful, try to stick to weeklies.
Alright let’s jump into the plan…
For those who haven’t subscribed this is a great opportunity to subscribe.
For as little as $15/month we provide daily trade plans for intraday traders and also provide great educational content.
News Catalysts
10:00am est - CB Consumer Confidence
10:00am est - Existing Home Sales
12:00pm est - FOMC Member Goolsbee Speaks
For more information on news events, visit the Economic Calendar
12/20 - SPX/ES/SPY Trade Plan
Bullish bias:
If there is a failed break down of 4750 target 4775
Above 4780 target 4800
If VIX continues going down then a breakout of 4800 targets 4815
Bearish bias:
If there is a failed breakout of 4775 target 4765
Below 4765 target 4750
If VIX continues going up then a breakdown of 4750 targets 4725
As always keep an eye on Volland30 and the VIX for trend continuation or reversals.
Remember you can use this SPX trade plan to trade ES or SPY. ES value is approx. 52pts more than the SPX levels shared. To get SPY levels simply take the SPX levels and divide by 10.01.
SPX - The Why Behind the Plan
Volume Profile & Trends
Let’s review our volume profiles…
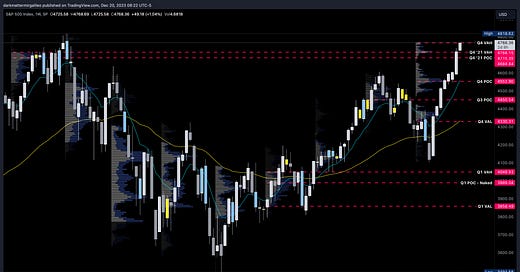
From a quarterly volume profile on the weekly chart some key levels are seen.
4768 - Q4 VAH - still forming
4740 - 2021 VAH
4715 - Q4 2021 VAH
4687 - 2021 POC
4684 - Q4 2021 POC
4552 - Q4 POC - still forming
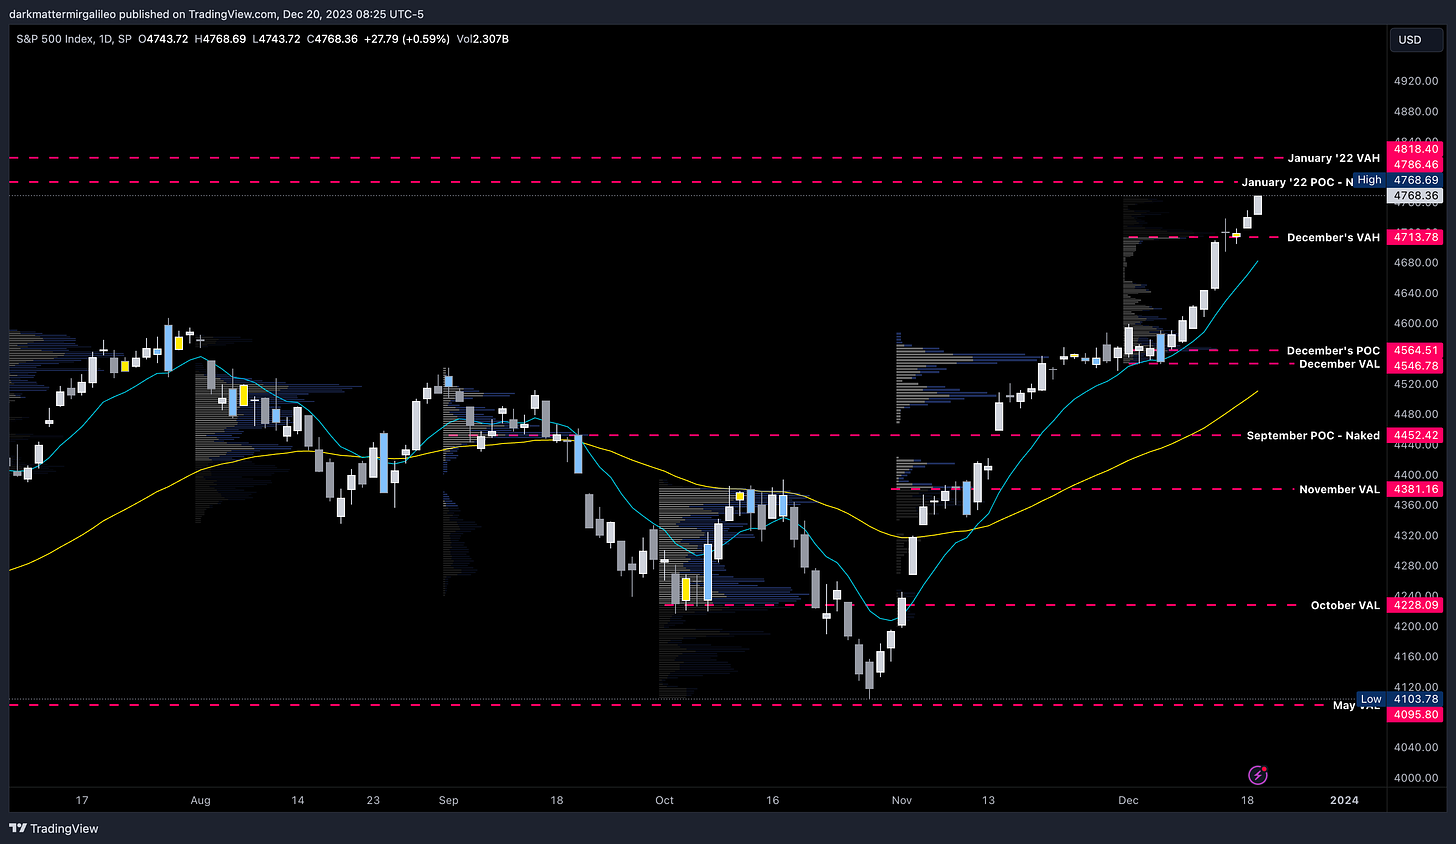
If we take a look at the daily chart and review the monthly volume profile we find the following levels…
4818 - January ‘22 VAH
4786 - January ‘22 POC - hasn’t been breached
4713 - December's VAH - still forming
4564 - December's POC - still forming
4546 - December’s VAL - still forming
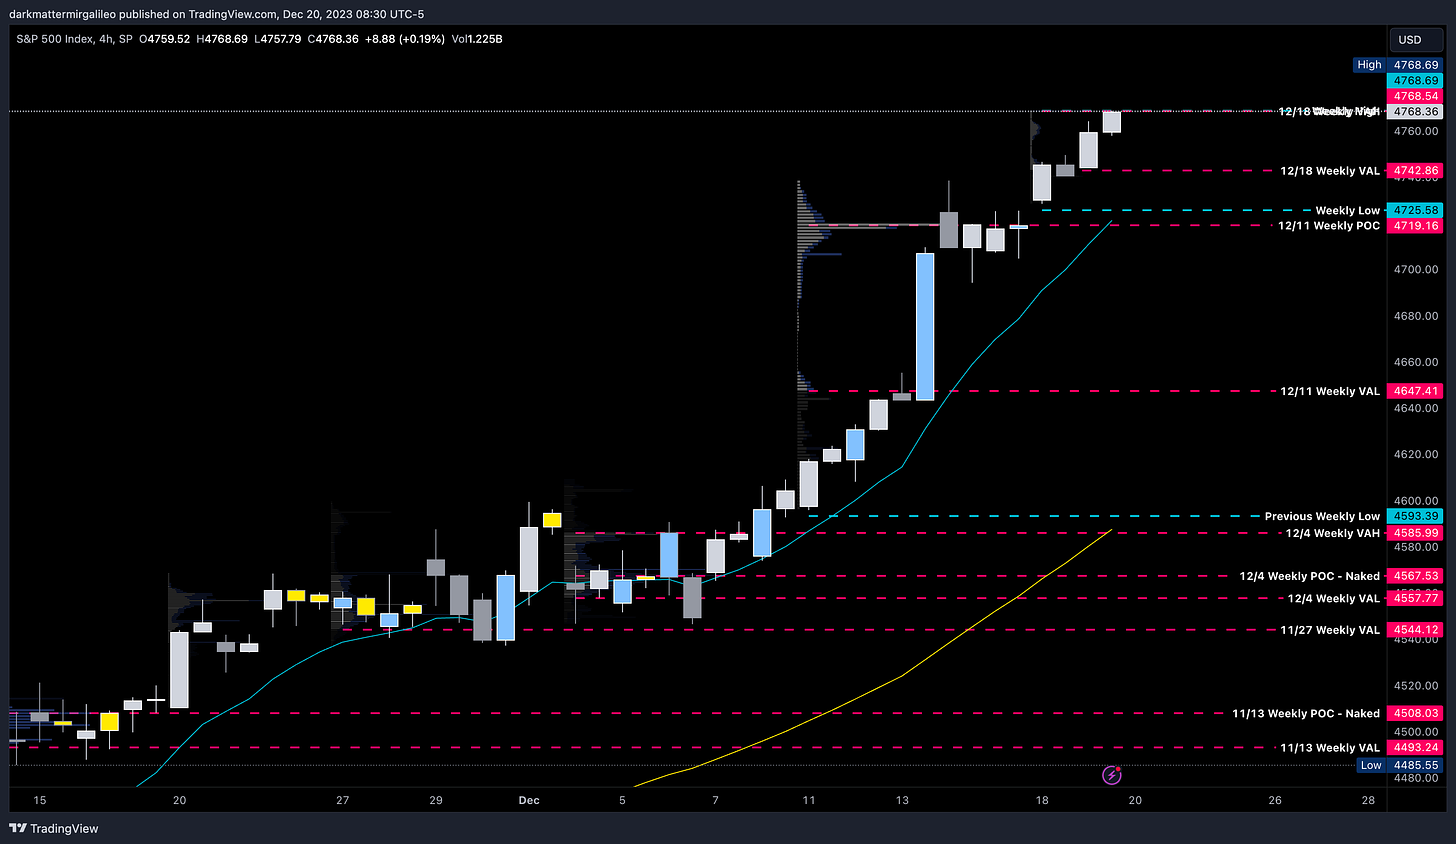
Let’s now look at the 4hr chart and review what the weekly volume profile levels show.
4768 - Weekly High & 12/18 Weekly VAH (still forming)
4742 - 12/18 Weekly VAL - still forming
4719 - 12/11 Weekly POC - hasn’t been breached
4647 - 12/11 Weekly VAL
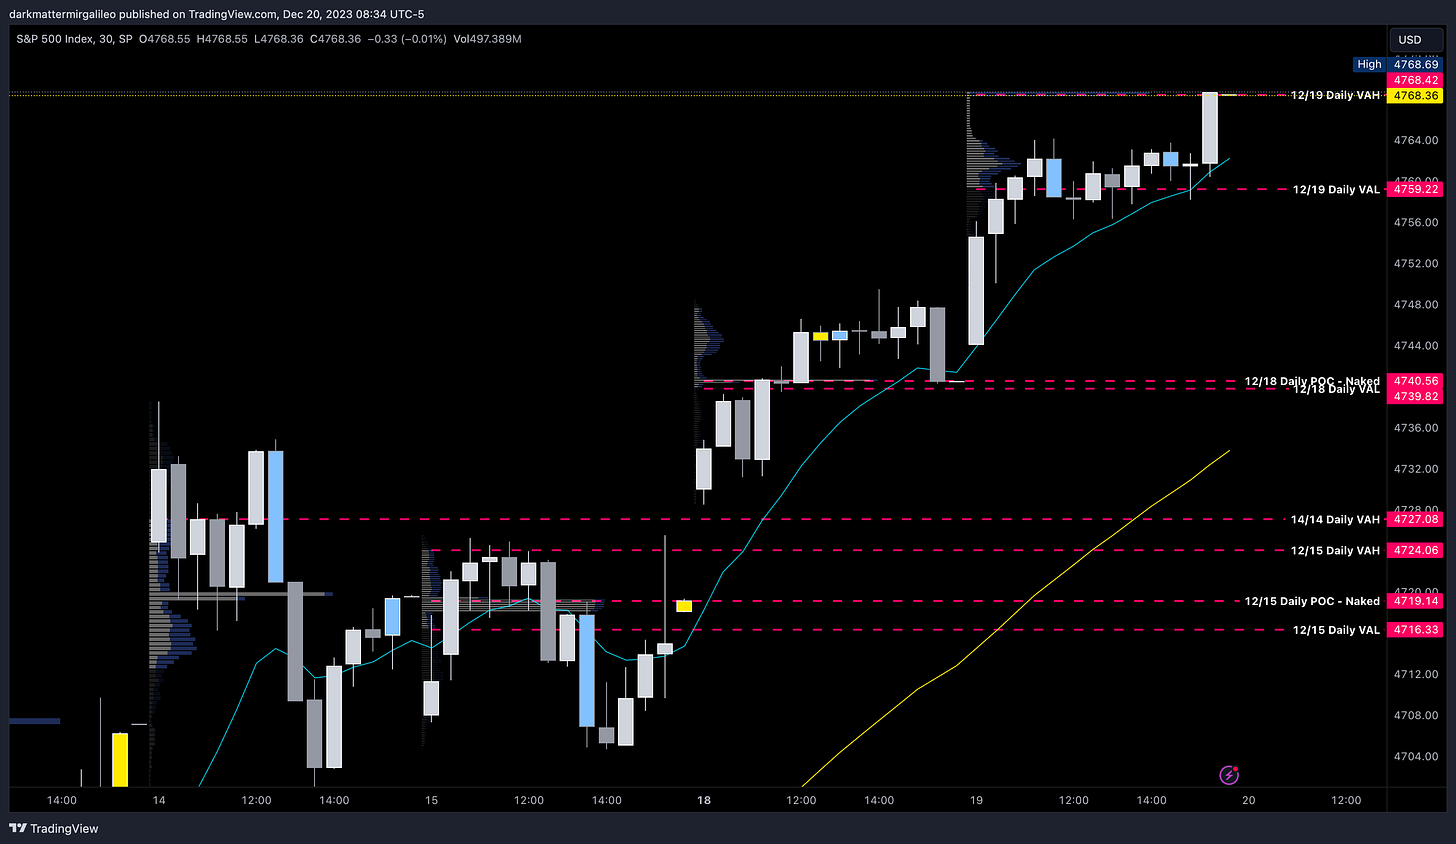
On the smaller timeframe and intraday let’s go to our 30min chart where we will put our session volume profile on. Our levels of importance are…
4768 - 12/19 VAH
4759 - 12/19 VAL
4740 - 12/18 POC - hasn’t been breached
4727 - 12/14 VAH
4724 - 12/15 VAH
4719 - 12/15 POC - hasn’t been breached
4716 - 12/15 VAL
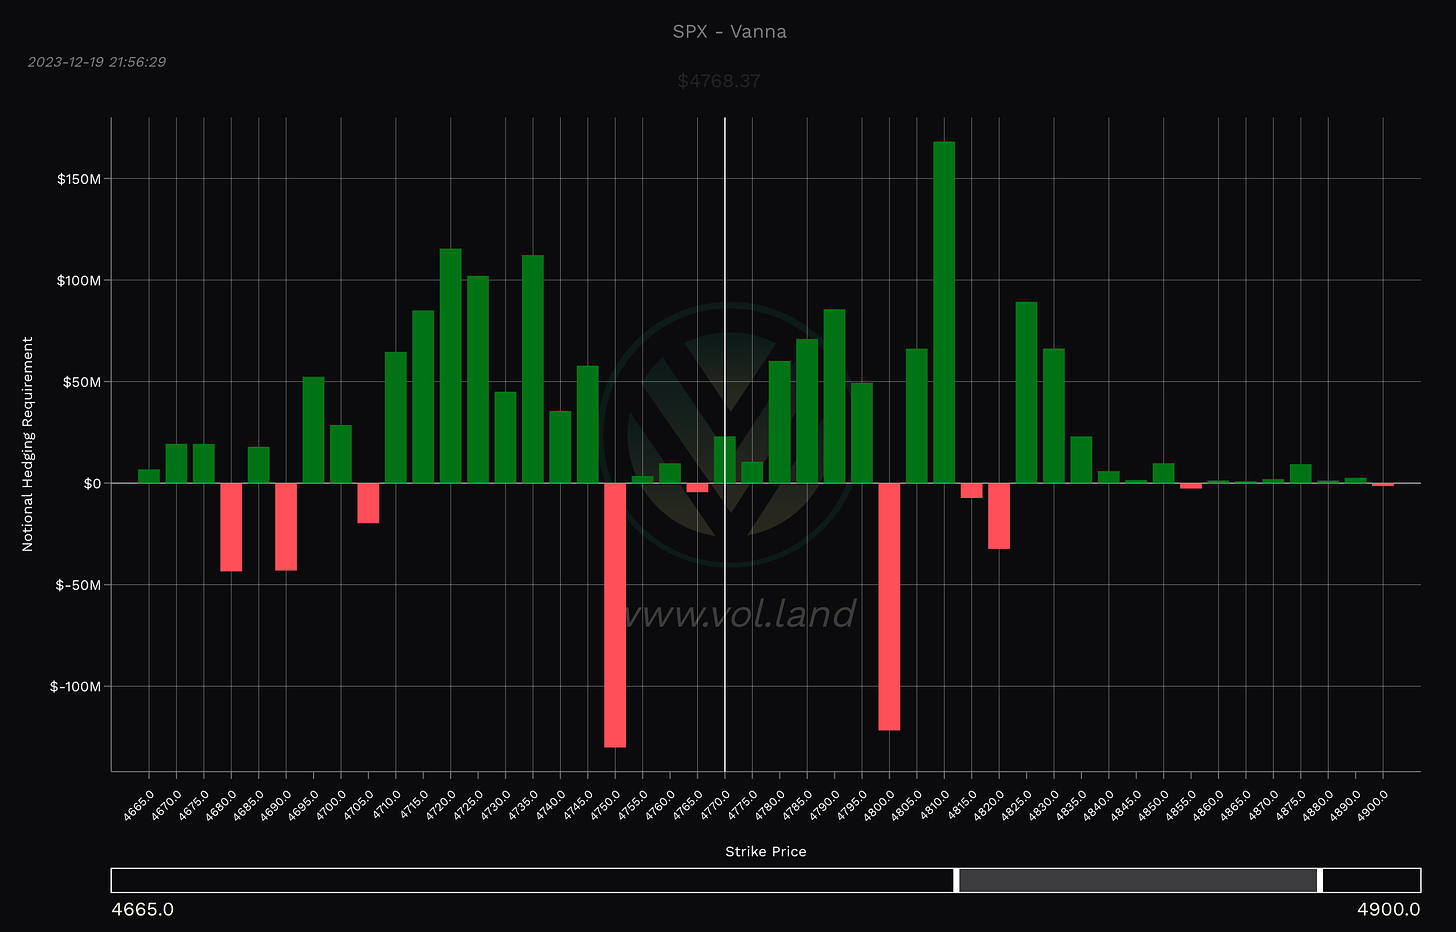
Volland Data
For a better understanding of the various greeks below I would suggest you visit the Volland YouTube Page. Volland provides unique data showing where dealers are positioned providing in my opinion a higher degree of conviction to where price may move to.
Vanna - Levels where price may repel or act as magnet
Remember for price to go above spot through a magnet or repellent VIX and IV must decrease or stay flat. For price to go below spot through a magnet or repellent VIX and IV must increase.
Positive vanna - will act as magnet
Negative vanna - will act as repellent
When price goes through a positive or negative level it will flip it - ie negative becomes positive and vice versa.
Above Spot:
4775-4780 - negative vanna
4800 - negative vanna
4815-4820 - negative vanna
4855 - negative vanna
4875 - negative vanna
Below Spot:
4765 - negative vanna
4750 - negative vanna
4735 - negative vanna
4720 - negative vanna
4705-4700 - negative vanna
4690 - negative vanna
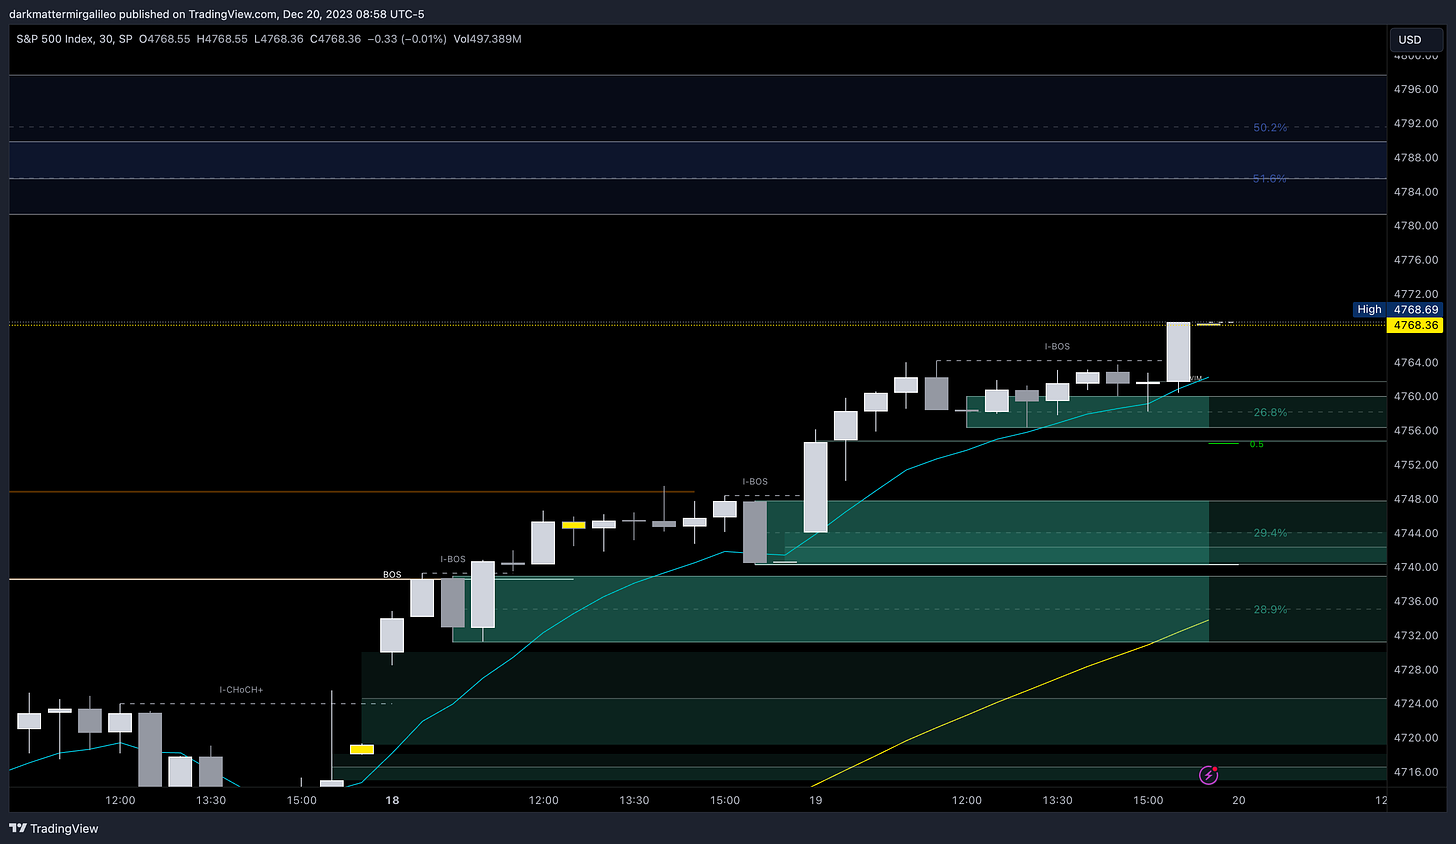
Orderblocks (OB)
Resistance levels - at these levels I want to see if price rejects to short or consolidates for a push up. I couple this data with Volland, intraday option flows, and Dark Pool levels. Higher timeframe OB’s or FVG will be harder to break. OB’s are the stronger levels over FVG’s.
4778-4797 - OB (1hr, 2hr chart)
4788 midline
Support levels - at these levels I want to see if price rejects to long or consolidates for a push down. I couple this data with Volland, intraday option flows, and Dark Pool levels. Higher timeframe OB’s or FVG will be harder to break. OB’s are the stronger levels over FVG’s.
4760-4756 - OB (30min chart)
4757 midline
4747-4740 - OB (30min, 1hr, 2hr chart)
4744 midline
4738-4731 - OB (30min chart)
4735 midline
4719-4704 - OB (1hr chart)
4712 midline
Key Levels
Above Spot:
4775-4780 - negative vanna
4786 - January ‘22 POC - hasn’t been breached
4778-4797 - OB (1hr, 2hr chart)
4788 midline
4800 - negative vanna
4815-4820 - negative vanna
4818 - January ‘22 VAH
4855 - negative vanna
Below Spot:
4765 - negative vanna
4760-4756 - OB (30min chart)
4757 midline
4759 - 12/19 VAL
4750 - negative vanna
4747-4740 - OB (30min, 1hr, 2hr chart)
4744 midline
4742 - 12/18 Weekly VAL - still forming
4740 - 12/18 POC - hasn’t been breached
4740 - 2021 VAH
4735 - negative vanna
4738-4731 - OB (30min chart)
4735 midline
4727 - 12/14 VAH
4724 - 12/15 VAH
4720 - negative vanna
4719-4704 - OB (1hr chart)
4712 midline
4719 - 12/11 Weekly POC - hasn’t been breached
4719 - 12/15 POC - hasn’t been breached
4716 - 12/15 VAL
4715 - Q4 2021 VAH
4713 - December's VAH - still forming
4705-4700 - negative vanna
Weekly Option Expected Move
SPX’s weekly option expected move is ~54.53 points. SPY’s expected move is ~5.61. That puts us at 4773.71 to the upside and 4664.65 to the downside. For SPY these levels are 474.98 and 463.76.
Remember over 68% of the time price will resolve it self in this range by weeks end.
TradingView Chart Access
For access to my chart laying out all of the above key levels please visit here.
To cover our basis…
Welcome to my Substack where I provide a daily SPX trading plan to help guide my intraday trading. The purpose of this letter is not to advice you on your trading or investment decisions. I am simply documenting my daily trading plan for myself to help with planning and execution. These are simply my opinions and the data sourced from the likes of vol.land, TradingView, Quant Data and others. The stock market is risky, gains are not guaranteed. This is not about getting rich quick, but learn to educate yourself and make the necessary financial decisions on your own. This is not financial advice.

