Market Recap
Today wasn’t easy especially with some last minute updates to the Volland platform that played with my mindset a bit - which is never good in trading.
To the plan - it held well where we discussed the following trade ideas…
If there is a failed breakout of 4730-4740 target 4715
If VIX continues going up then a breakdown of 4715 targets 4705
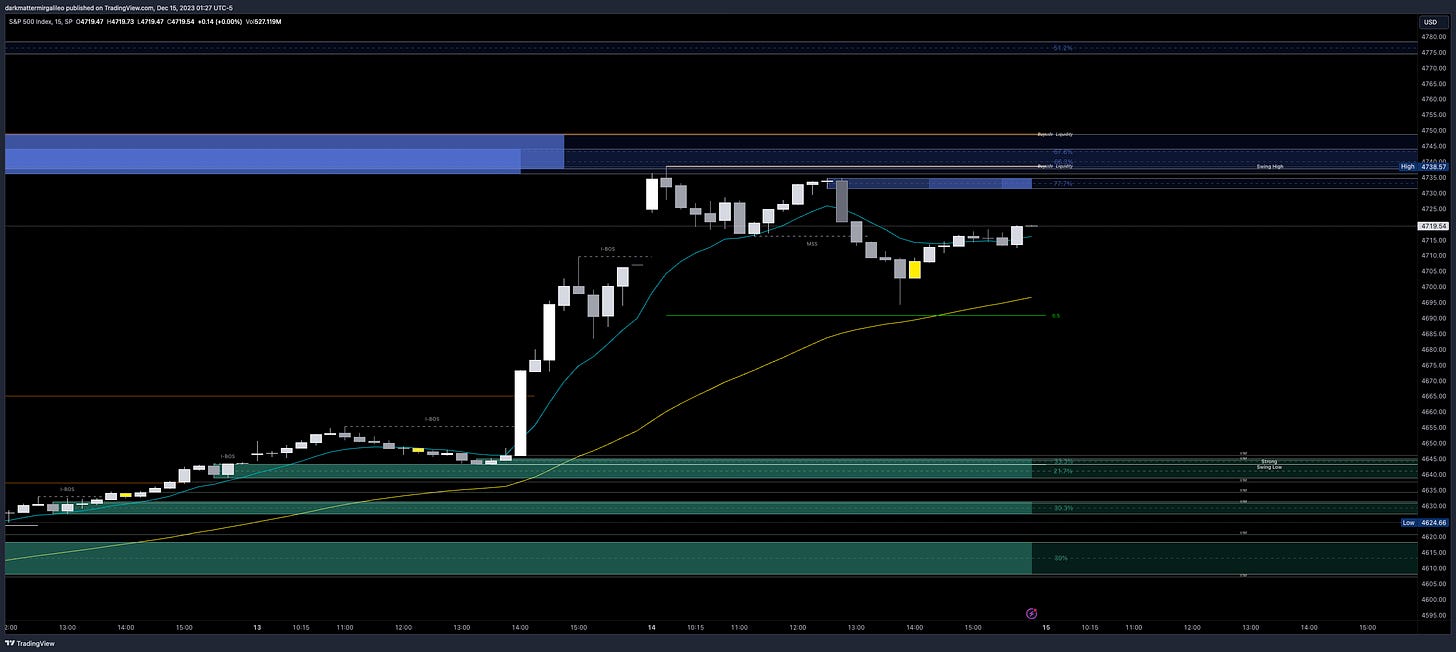
The best trade of the day was the first one - waiting for price to get back into the 4730-4740 zone and then shorting it. Twice did this trade play out and on the second time we had a deeper selloff into 4695 where SPX then found support and bounced from it.
We have a news heavy day so let’s jump into the trade plan.
For those who haven’t subscribed this is a great opportunity to subscribe.
For as little as $15/month we provide daily trade plans for intraday traders and also provide great educational content.
News Catalysts
Overnight - EUR Manufacturing PMI and Services PMI - France, Germany, UK
8:30am est - Empire State Manufacturing Index
9:15am est - Industrial Production m/m
9:45am est - Flash Manufacturing PMI
9:45am est - Flash Services PMI
12:25pm est - BOC Gov Macklem Speaks
For more information on news events, visit the Economic Calendar
12/15 SPX/SPY/ES Intraday Overview (TL;DR)
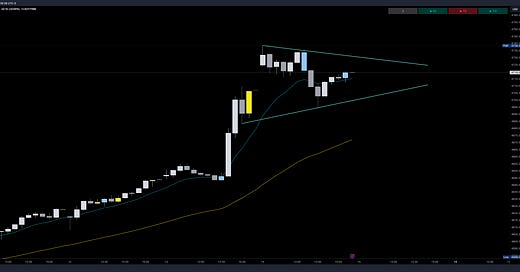
We have OPEX expiration - while I think we will have some great opportunities to trade I think price is going to be contained between a couple of key levels. I am also looking to see if we get a breakout of our pennant or whether it gets invalidated and we trigger a short play.
4725-4730 is no mans land. If price comes into this zone I would wait to play a failed breakout of this level or wait for a breakout of it and it must hold to continue further up. This was the level where price had a difficult time getting through in Thursday’s session.
So if I am bullish what’s above that zone?
4740-4745 - this is the next level/zone that the bulls will target. This area does have resistance so if we do see price get here I would take all profits and reassess from there as the better trade comes…
4765 - if we can break past 4745 with volume and with VIX continuing downward we will then target this level. There is a chance we overshoot to…
4775-4780 - in order to hit this level we would really need a catalyst to get us here and volume to push us up.
What if I am bearish?
You can’t let price get above 4730. Must protect 4725-4730 zone and if you do so the bears will be rewarded with a move back to 4715 where we do have some support. Now if we break this level we will then target 4705 and after that 4690.
12/15 - SPX/ES/SPY Trade Plan
Bullish bias:
If there is a failed break down of 4705 target 4715
Above 4730 target 4740
If VIX continues going down then a breakout of 4745 targets 4765
A breakout of 4765 targets 4775-4780
Bearish bias:
If there is a failed breakout of 4725-4730 target 4715
Below 4715 target 4705
If VIX continues going up then a breakdown of 4705 targets 4690
As always keep an eye on Volland30 and the VIX for trend continuation or reversals.
Remember you can use this SPX trade plan to trade ES or SPY. ES value is approx. 55pts more than the SPX levels shared. To get SPY levels simply take the SPX levels and divide by 10.01.
SPX - The Why Behind the Plan
Volume Profile & Trends
All eyes on this bullish triangle - coud call it a bullish pennant even - but will it play out or be invalidated? You know what to do if we break and hold either way though…
Let’s review our volume profiles…
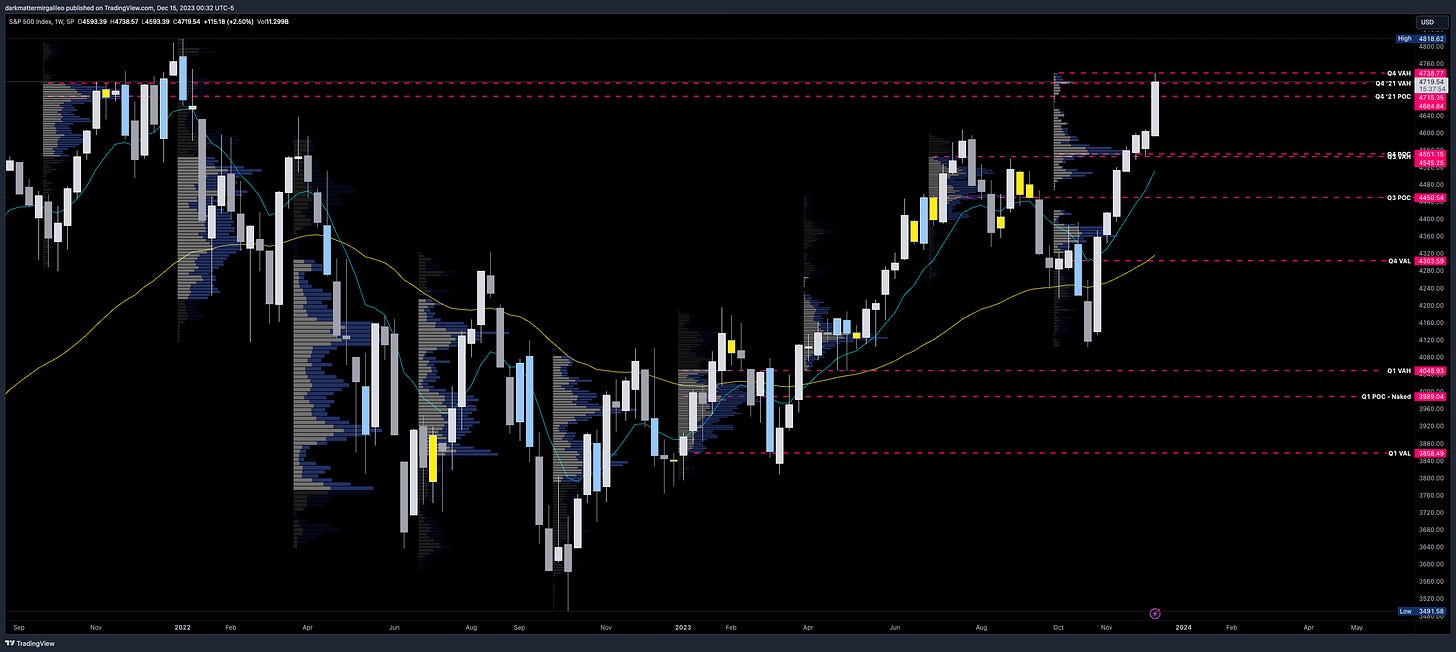
From a quarterly volume profile on the weekly chart some key levels are seen.
4738 - Q4 VAH - still forming
4715 - Q4 2021 VAH
4684 - Q4 2021 POC
4551 - Q4 POC - still forming
4545 - Q3 VAH
4450 - Q3 POC
If we take a look at the daily chart and review the monthly volume profile we find the following levels…
4818 - January ‘22 VAH
4786 - January ‘22 POC - hasn’t been breached
4714 - November '21 VAH
4627 - December's VAH - still forming
4564 - December's POC - still forming
4546 - December’s VAL - still forming
4452 - September’s POC - hasn’t been breached
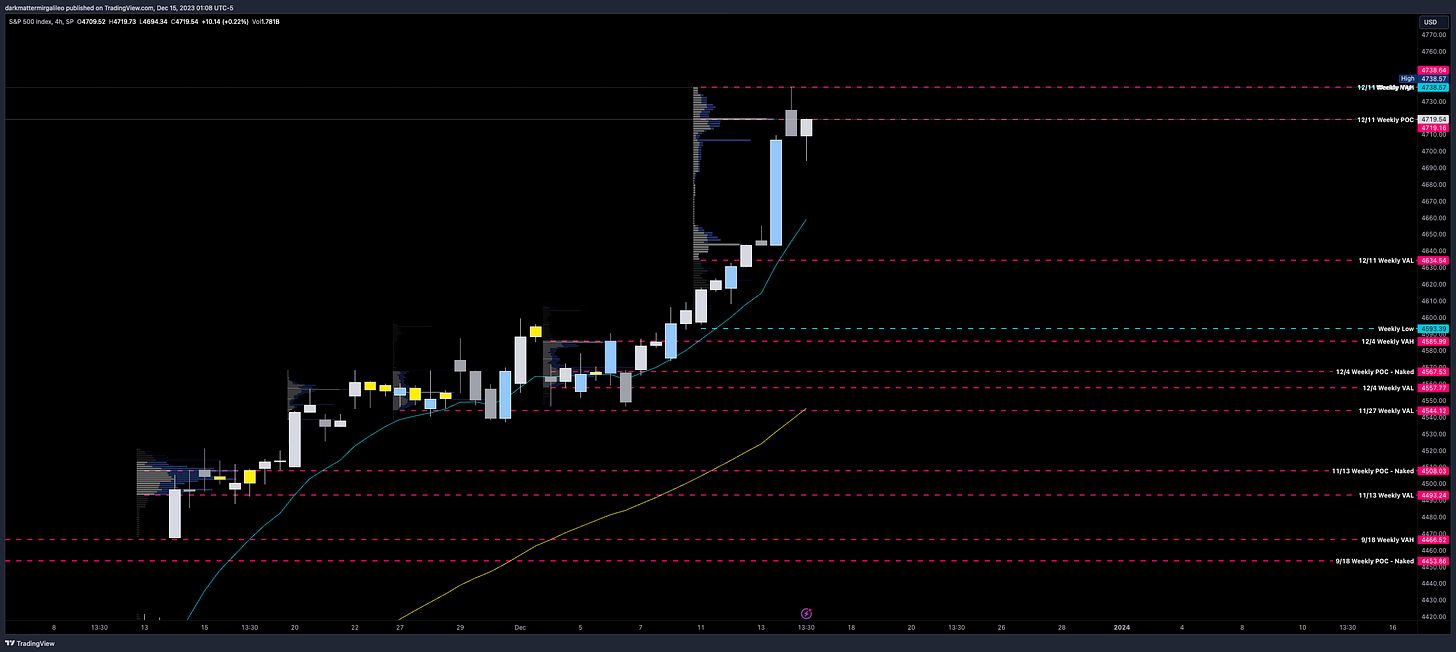
Let’s now look at the 4hr chart and review what the weekly volume profile levels show.
4738 - Weekly High & 12/11 Weekly VAH
4719 - 12/11 Weekly POC
4634 - 12/11 Weekly VAL - still forming
4593 - Weekly Low
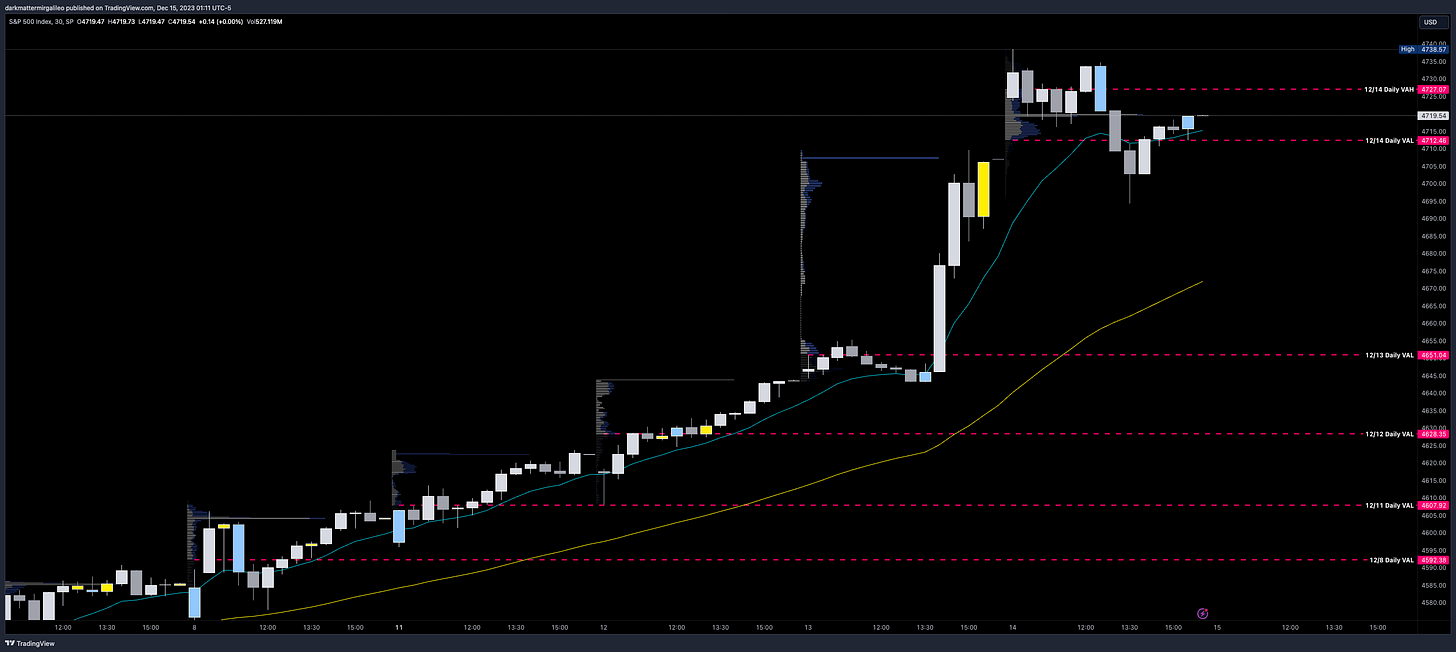
On the smaller timeframe and intraday let’s go to our 30min chart where we will put our session volume profile on. Our levels of importance are…
4727 - 12/14 VAH
4712 - 12/14 VAL
4651 - 12/13 VAL
4628 - 12/12 VAL
4607 - 12/11 VAL
Volland Data
For a better understanding of the various greeks below I would suggest you visit the Volland YouTube Page. Volland provides unique data showing where dealers are positioned providing in my opinion a higher degree of conviction to where price may move to.
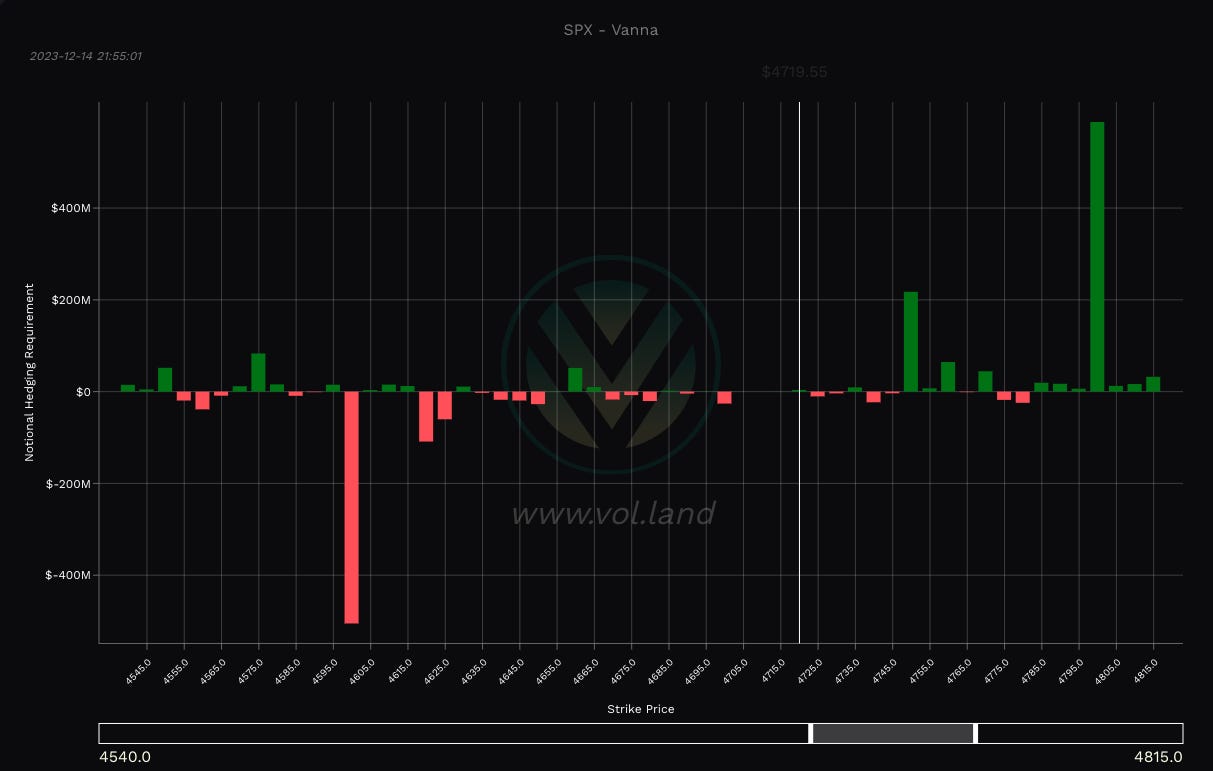
Vanna - Levels where price may repel or act as magnet
Remember for price to go above spot through a magnet or repellent VIX and IV must decrease or stay flat. For price to go below spot through a magnet or repellent VIX and IV must increase.
Positive vanna - will act as magnet
Negative vanna - will act as repellent
When price goes through a positive or negative level it will flip it - ie negative becomes positive and vice versa.
Above Spot:
4725-4730 - negative vanna
4740-4745 - negative vanna
4765 - negative vanna
4775-4780 - negative vanna
Below Spot:
4715 - negative vanna
4705 - negative vanna
4690 - negative vanna
4680-4670 - negative vanna
4650-4635 - negative vanna
4625-4620 - negative vanna
4600 - negative vanna
Orderblocks (OB)
Resistance levels - at these levels I want to see if price rejects to short or consolidates for a push up. I couple this data with Volland, intraday option flows, and Dark Pool levels. Higher timeframe OB’s or FVG will be harder to break. OB’s are the stronger levels over FVG’s.
4726-4733 - OB (30min chart)
4730 midline
4737-4748 - OB (15min chart)
4743 midline
4778-4797 - OB (1hr, 2hr chart)
4788 midline
Support levels - at these levels I want to see if price rejects to long or consolidates for a push down. I couple this data with Volland, intraday option flows, and Dark Pool levels. Higher timeframe OB’s or FVG will be harder to break. OB’s are the stronger levels over FVG’s.
4652-4643 - OB (2hr chart)
4648 midline
4631-4627 - OB (15min chart)
4629 midline
4591-4580 - OB (30min chart)
4586 midline
4571-4565 - OB (15min chart)
4568 midline
4568-4546 - OB (1D chart)
4557 midline
4554-4525 - OB (4hr chart)
4536 midline
4554-4541 - OB (30m chart)
4548 midline
Key Levels
Above Spot:
4725-4730 - negative vanna
4726-4733 - OB (30min chart)
4730 midline
4727 - 12/14 VAH
4740-4745 - negative vanna
4738 - Weekly High & 12/11 Weekly VAH
4738 - Q4 VAH - still forming
4737-4748 - OB (15min chart)
4743 midline
4765 - negative vanna
4775-4780 - negative vanna
4786 - January ‘22 POC - hasn’t been breached
4778-4797 - OB (1hr, 2hr chart)
4788 midline
Below Spot:
4715 - negative vanna
4715 - Q4 2021 VAH
4714 - November '21 VAH
4712 - 12/14 VAL
4705 - negative vanna
4690 - negative vanna
4680-4670 - negative vanna
4684 - Q4 2021 POC
4650-4635 - negative vanna
4652-4643 - OB (2hr chart)
4648 midline
4651 - 12/13 VAL
4634 - 12/11 Weekly VAL - still forming
4625-4620 - negative vanna
4631-4627 - OB (15min chart)
4629 midline
4628 - 12/12 VAL
4627 - December's VAH - still forming
4600 - negative vanna
4593 - Weekly Low
Weekly Option Expected Move
SPX’s weekly option expected move is ~64.33 points. SPY’s expected move is ~6.99. That puts us at 4668.69 to the upside and 4540.03 to the downside. For SPY these levels are 467.19 and 453.21.
Remember over 68% of the time price will resolve it self in this range by weeks end.
TradingView Chart Access
For access to my chart laying out all of the above key levels please visit here.
To cover our basis…
Welcome to my Substack where I provide a daily SPX trading plan to help guide my intraday trading. The purpose of this letter is not to advice you on your trading or investment decisions. I am simply documenting my daily trading plan for myself to help with planning and execution. These are simply my opinions and the data sourced from the likes of vol.land, TradingView, Quant Data and others. The stock market is risky, gains are not guaranteed. This is not about getting rich quick, but learn to educate yourself and make the necessary financial decisions on your own. This is not financial advice.

