Weekly Market Overview
For 6 weeks in a row now the SPX has put in a positive week. Just an incredible run from the recent lows of 4103 back in late October. Will this continue or are we ready for a selloff?
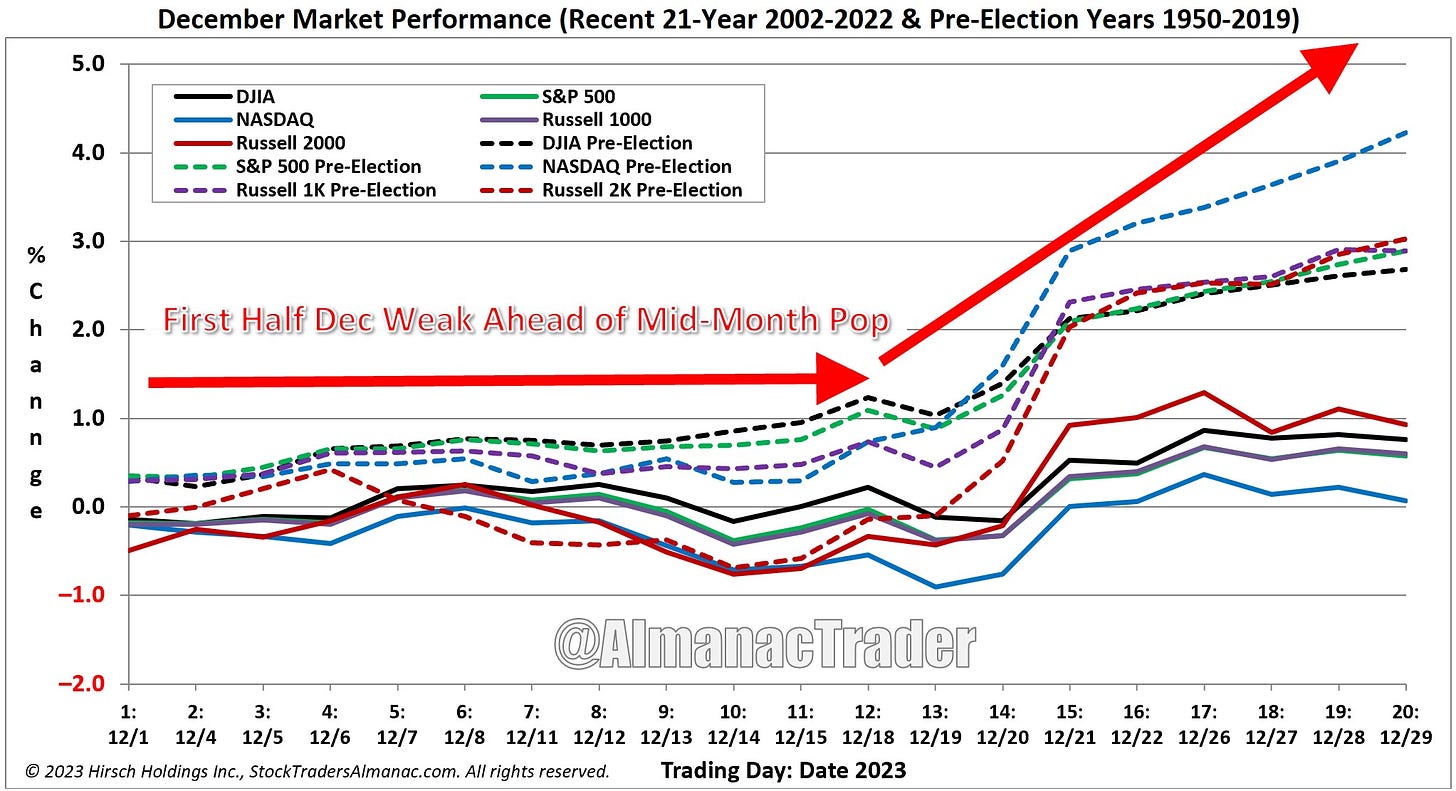
As provided in last Monday’s plan we discussed how seasonality in the first half was a bit weak and we got that last week where we sold off in that range I shared of .5-1% and a shallow sell.
For those who haven’t subscribed this is a great opportunity to subscribe.
For as little as $15/month we provide daily trade plans for intraday traders and also provide great educational content.
So from a seasonality standpoint we aren’t quite ready to just rally and moon. There will be a small - again shallow - pullback and that will be an opportunity to enter and if you are into swing trading those January or February OPEX 470 calls on SPY I called out in last week’s plan would be a trade idea.
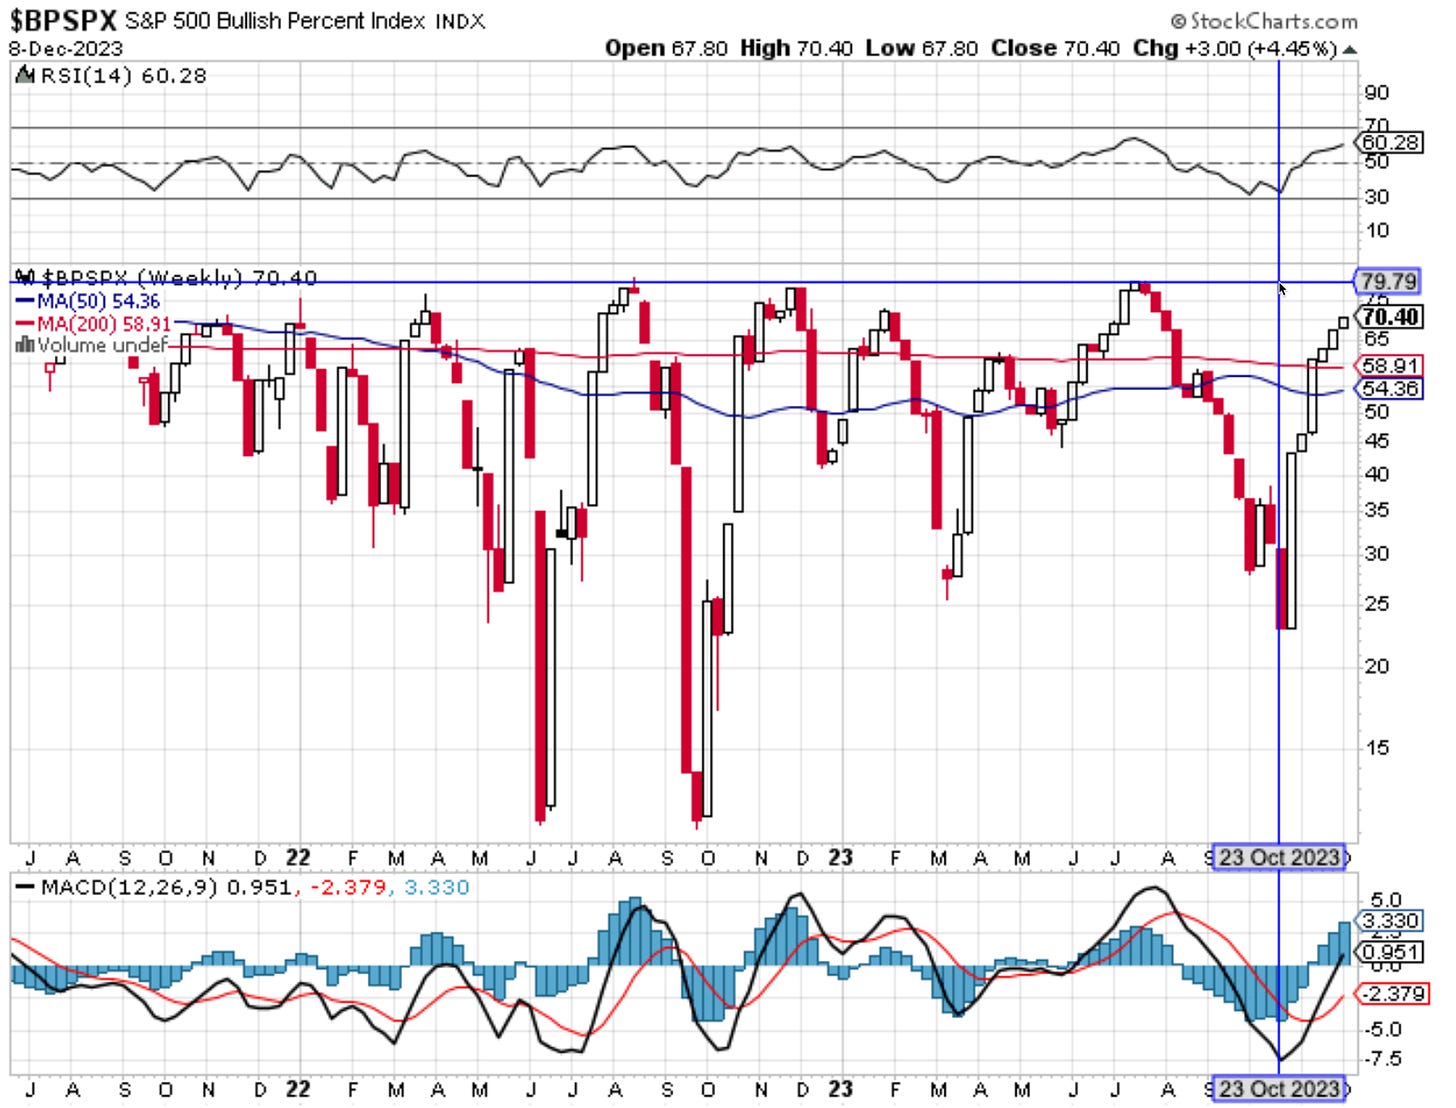
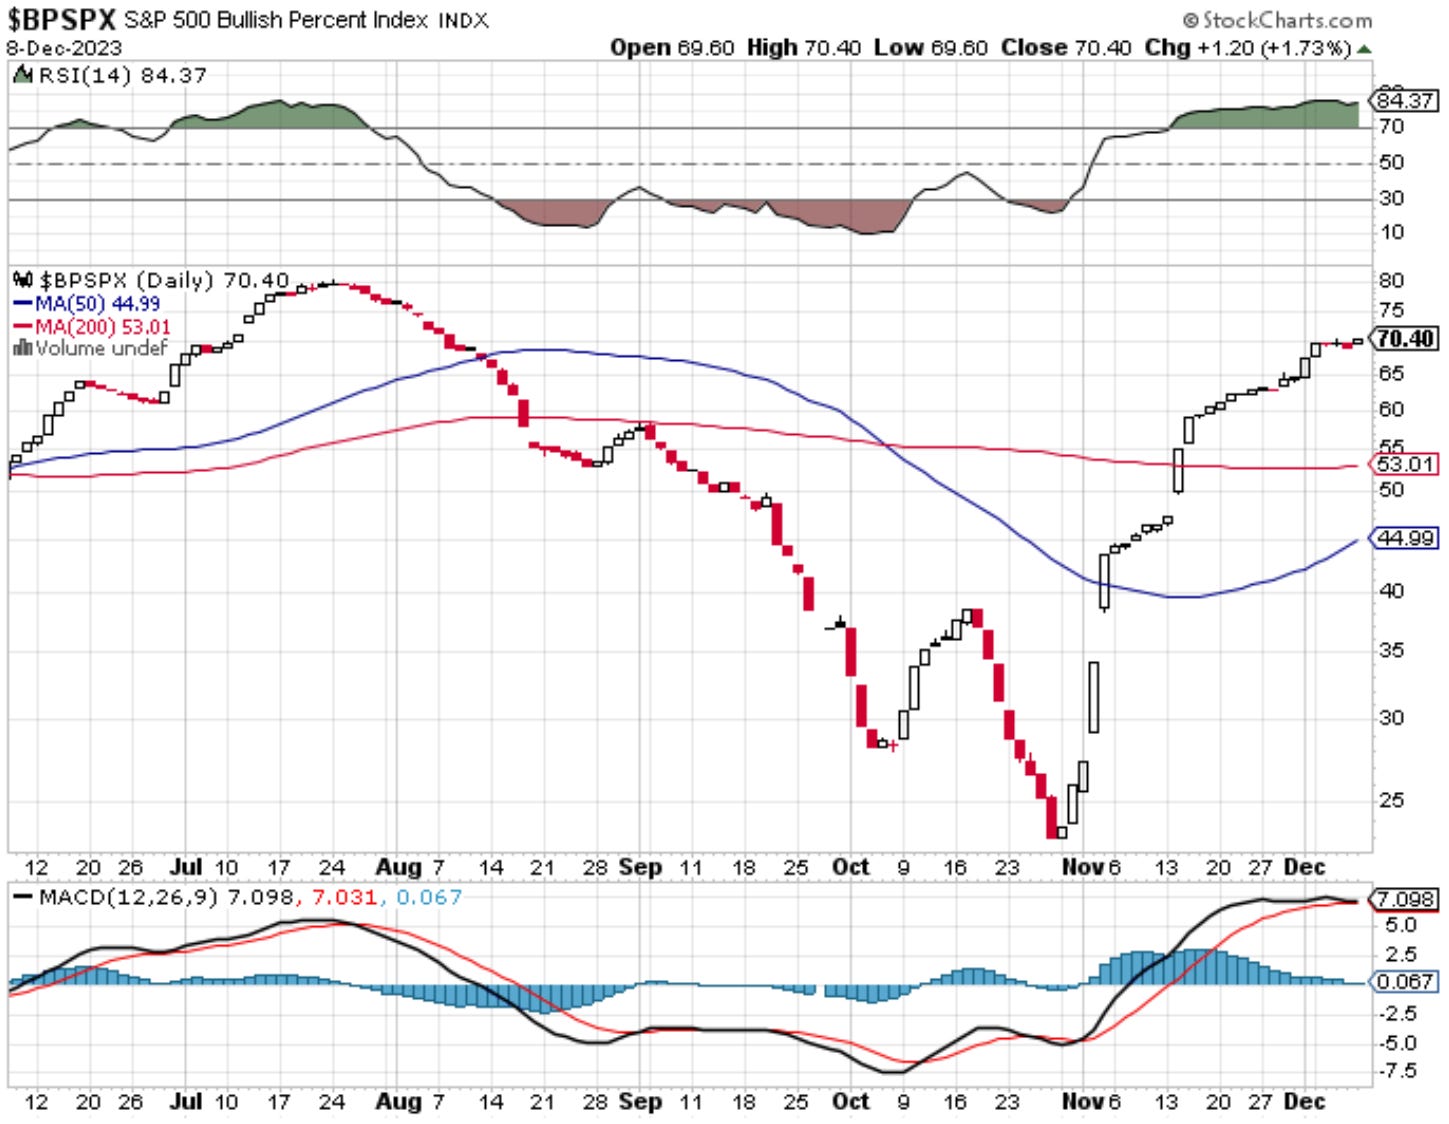
I also want to callout the $BPSPX. If you are unfamiliar with it, it is…
The S&P 500 Bullish Percent Index (BPSPX) is a breadth indicator that measures the S&P 500. It shows the percentage of stocks in the S&P 500 that are in an uptrend or downtrend
I like the look at this chart for longer timeframe trends. Are we in an uptrend or downtrend, which then helps guide me during weeks of consolidation such as the past two weeks whether to stay bullish or bearish.
On the daily timeframe you can see it continues to make bull flags where it consolidates and provides another level up. Last week we did see two red candles - the first during this run up - but it did put in a new high. There is still more room up and until this chart starts to shift I don’t think I can change my tune and go “all in” short and why I have been saying for 2 weeks now any shorts should be scalps and quick trades in/out.
If you take a look at the weekly chart we can clearly see an uptrend with no retracement or pullback. This is a strong bull run. It is typically not until that 79 level where you then see a reversal - ie where 79% of the S&P is in an uptrend. I will keep an eye on these and share any changes to their trend.

Additionally, this week is high with news catalysts that should create volatility and provide us a range to trade in. We have this week CPI on Tuesday, FOMC Meeting on Wednesday with Powell speaking, Thursday is Retail Sales, and Friday is Manufacturing and Services PMI.
This week is going to be fun and provide us range.
Let’s jump into the trade plan and review our key levels.
News Catalysts
1:01pm est - 10-y Bond Auction
For more information on news events, visit the Economic Calendar
12/11 SPX/SPY/ES Intraday Overview (TL;DR)
My key pivot on the day comes down to 4585-4590. Should we get a gap down and this area trades I will be looking for a failed breakdown where if price trades back above 4590 I would go long.
4585-4605 is a chop zone. Random reactions in this zone as price tries to find its way so I will only play this zone on breakouts or breakdowns or failed ones.
Thus, if I am bullish you want to defend 4585-4590 to then target…
Keep reading with a 7-day free trial
Subscribe to Dark Matter Trade to keep reading this post and get 7 days of free access to the full post archives.


