8/8 Trading Session Review
Beautiful day for those who followed the trade plan. Nice clean breaks unlike Monday with price targeting our key levels. We had a nice gap down and hope some of our futures traders were able to trade our levels overnight.
The trading session then opened with SPX at 4494 and couldn’t go above 4495 and well within our first trade idea - below 4500 target 4480. From there a break of 4480 target 4465. Our low of day ended up being 4464. Couldn’t have asked for a better trade session and you were all done prior to noon.
This doesn’t happen everyday so on days like this where we have nice follow through we must stick to our convictions in order to seize the most profit while reducing our risk on days like Monday.
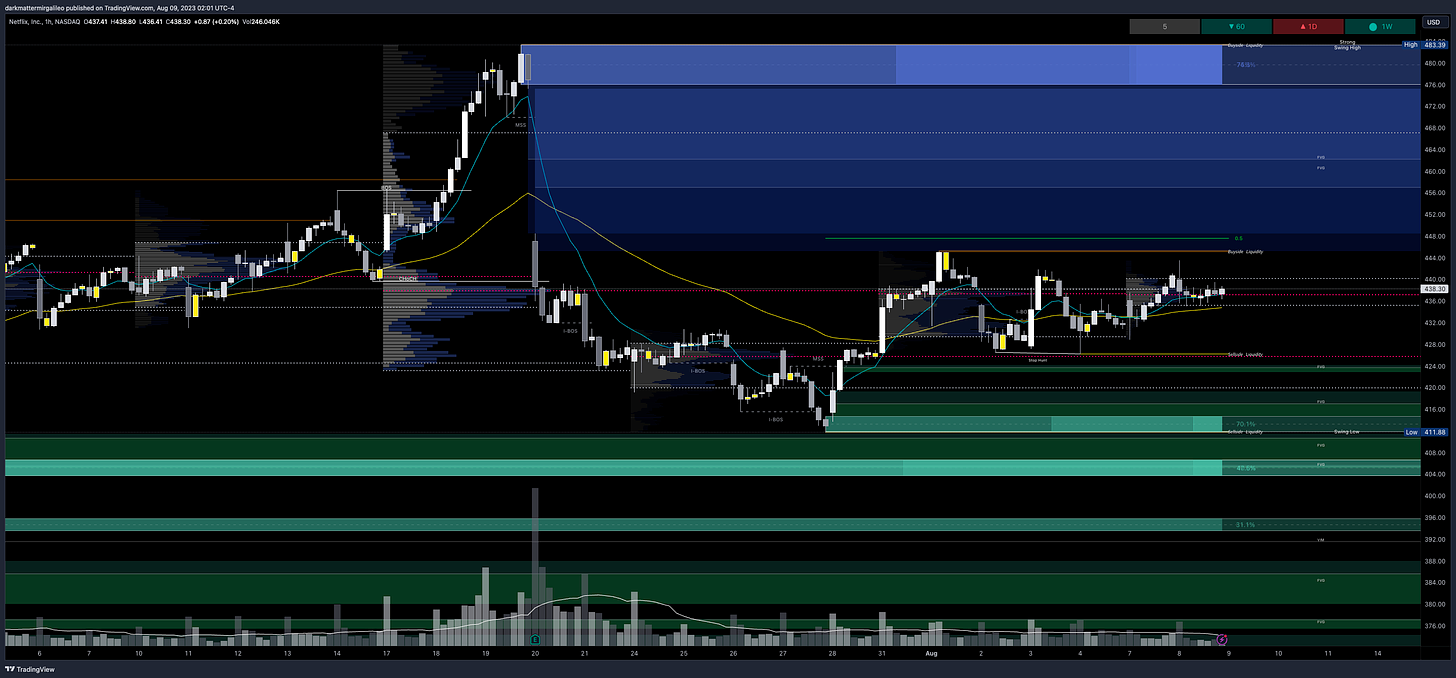
Our other trade ideas on ADBE played out and NFLX gave opportunities, but might be setup for a better swing trade as it broke the key 440 level.
ENPH was another trade idea giving our bearish bias idea a nice 4 pt move.
With that let’s jump into the trade plan.
SPX/SPY/ES Overview (TL;DR)
Tomorrow could be a choppy day with fake breakouts and traps as the market awaits the CPI print. One news catalyst to keep an eye for is the 10-year bond auction at 1pm est.
Bulls want price above 4505 to target 4520. Above 4520 target 4535.
Bears want price below 4500 to target 4485. From there 4465 and then 4440.
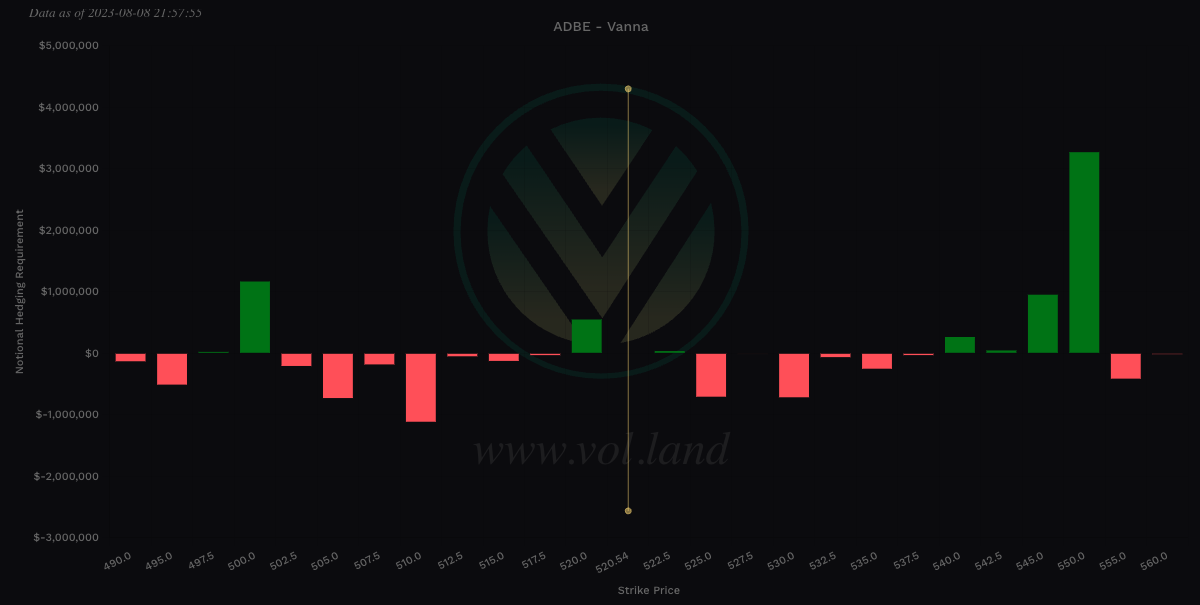
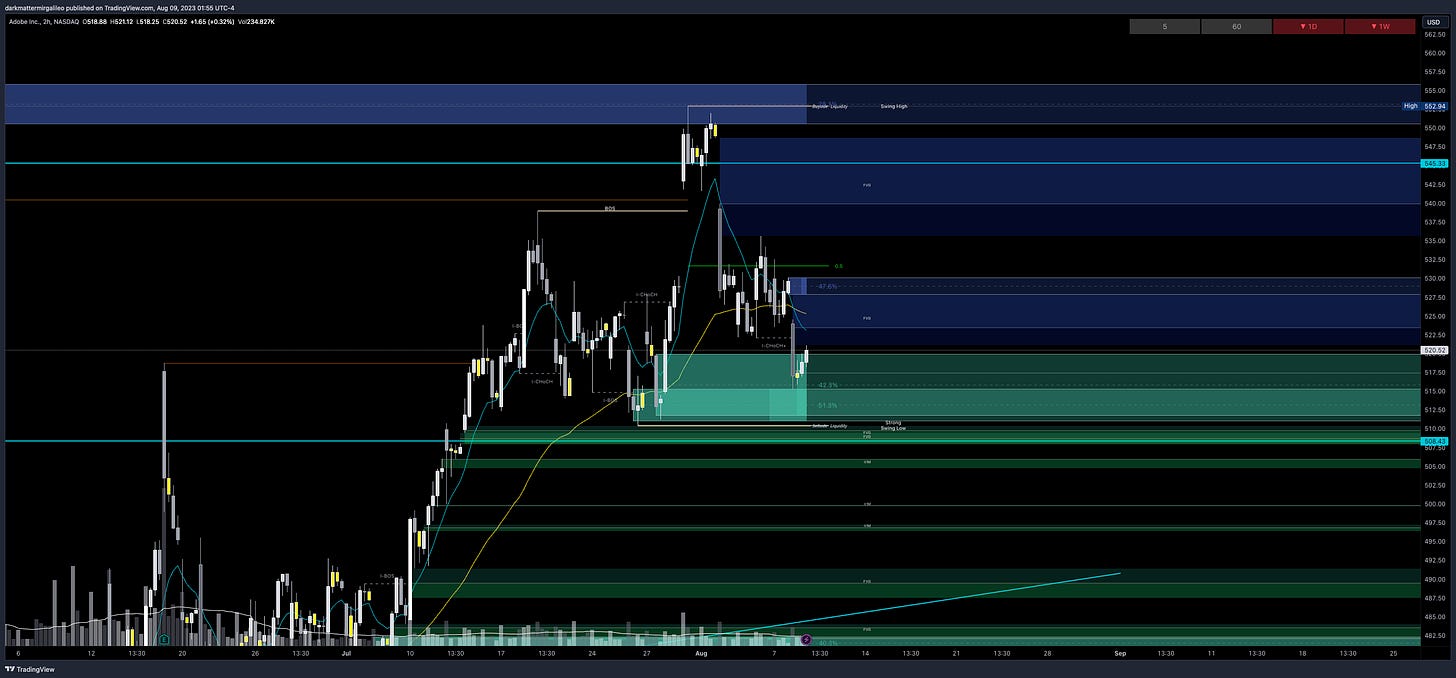
ADBE
525 is the level I would be watching to see how price reacts. If it can’t break 525 we target 520 then 515. Above 525 target 529, but higher risk trade.
If there is a failed breakout of 525 target 520 then 515
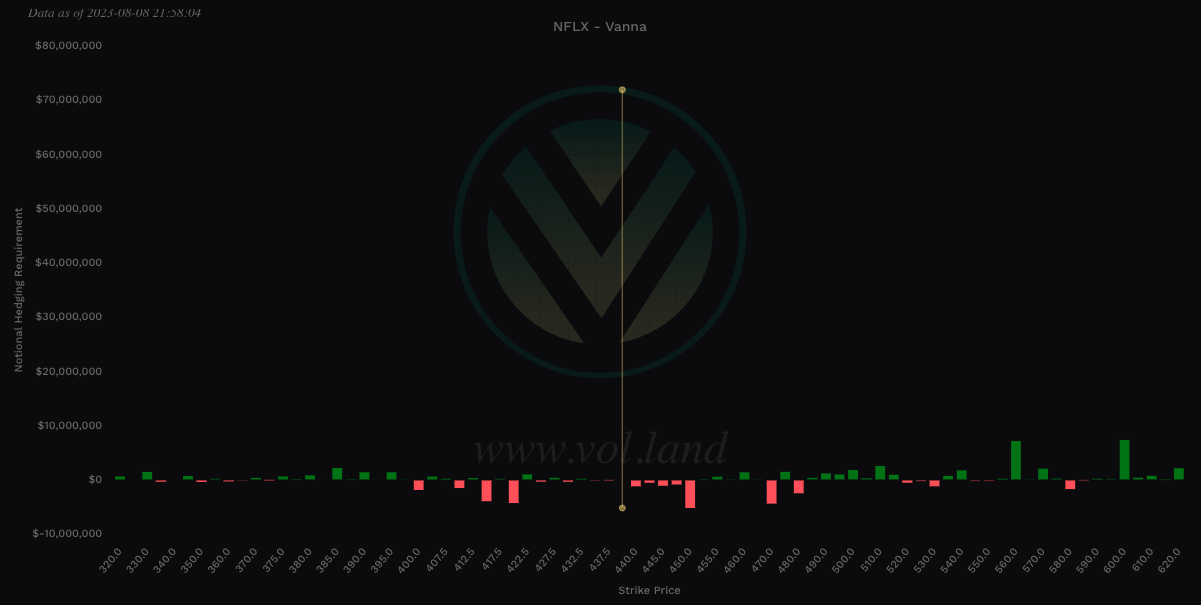
NFLX
We broke 440 and it will be a key level going forward. I would continue to be bearish below 440 with speed bumps at 437.5 and 435.
Below 440 target 437.5 then 435
For intraday updates please follow me on Twitter @DarkMatterTrade.
News Catalyst
1:00pm est - 10-y Bond Auction

For more information on news events, visit the Economic Calendar
8/9 - SPX/ES/SPY Trade Plan
Bullish bias:
Above 4505 target 4520
If there is a failed breakdown of 4500 target 4520
Bearish bias:
Below 4500 target 4485
If there is a breakdown of 4480 target 4465
If there is a failed breakout of 4455 target 4440
As always keep an eye on Volland30, VOLD indicator, and the VIX for trend continuation or reversals.
Remember you can use this SPX trade plan to trade ES or SPY. ES value is approx. 20pts more than the SPX levels shared. To get SPY levels simply take the SPX levels and divide by 10.03.
SPX - The Why Behind the Plan
Key Levels
Above Spot:
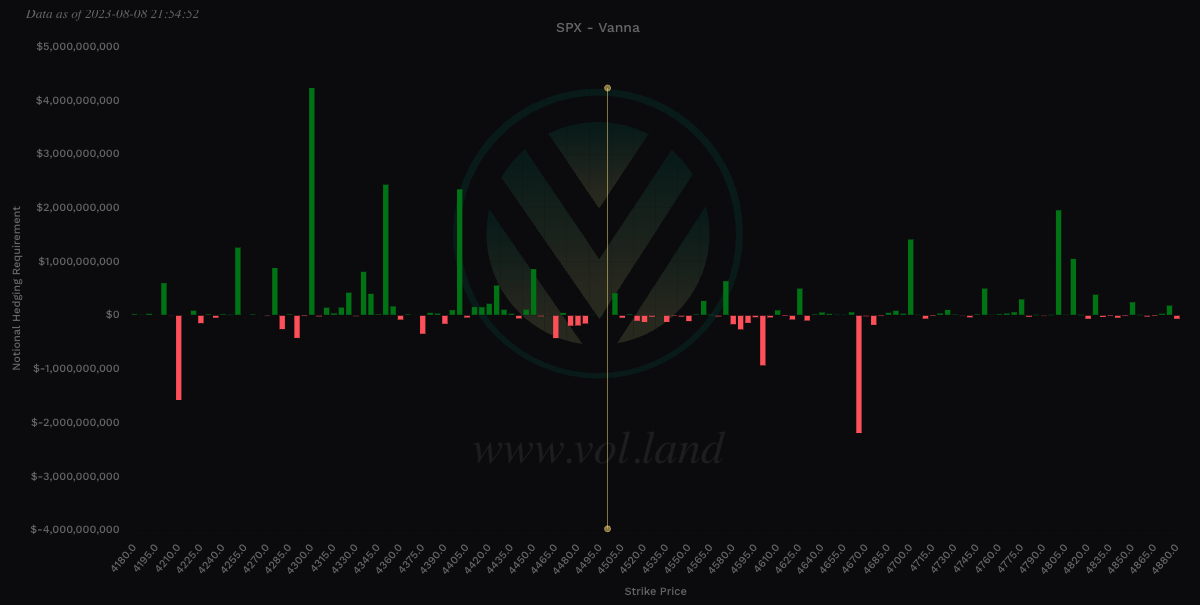
4505 - negative vanna
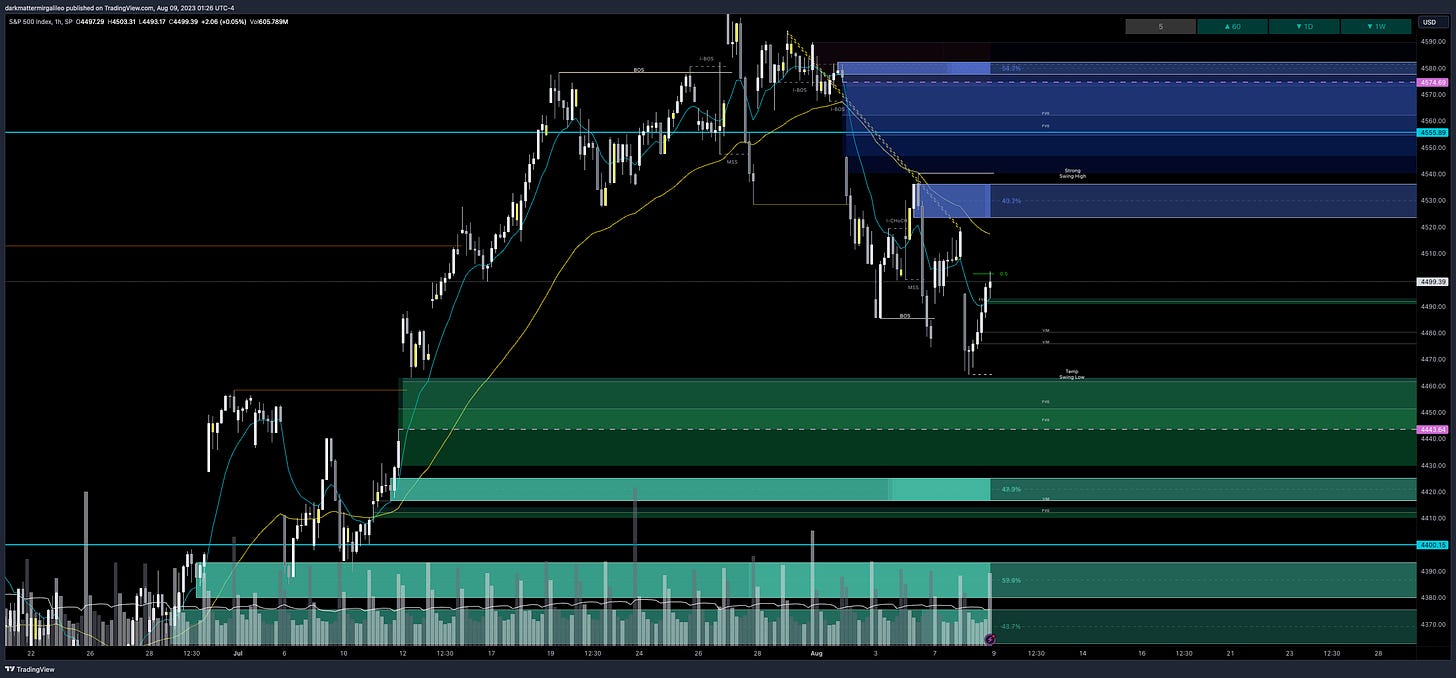
4508-4519 - OB (30min chart)
4513 midline
4503-4522 - 450.89-449.03 - $26.53B
4520-4550 - negative vanna
4523-4536 - OB (1hr chart)
4529 midline
4534-4538 - 452.49-452.14 - $15.81B
4520-4550 - negative vanna
4534-4540 - OB (30min chart)
4537 midline
4570 - negative vanna
4554-4567 - 455.41-454.08 - $19B
4580-4605 - negative vanna
4572-4582 - OB (2hr, 4hr chart)
4577 midline
4577-4590 - 457.64-456.43 - $12.26B
Below Spot:
4485-4475 - negative vanna
4479-4471 - 446.65-445.79 - $8.32B
4465 - negative vanna
4455 - negative vanna
4453-4444 - 444.02-443.15 - $8.93B
4440 - negative vanna
4438 - 442.52 - $6.46B
4425-4416 - OB (1hr chart)
4421 midline
4405 - negative vanna
4408-4399 - OB (2hr chart)
4404 midline
4410-4397 - 439.74-438.47 - $15.96B
Dark Pool Levels
Above Spot:
4503-4522 - 450.89-449.03 - $26.53B
4534-4538 - 452.49-452.14 - $15.81B
4554-4567 - 455.41-454.08 - $19B
4577-4590 - 457.64-456.43 - $12.26B
Below Spot:
4479-4471 - 446.65-445.79 - $8.32B
4453-4444 - 444.02-443.15 - $8.93B
4438 - 442.52 - $6.46B
4410-4397 - 439.74-438.47 - $15.96B
I get my dark pool levels from Quant Data.
Orderblocks (OB) and Fair Value Gaps (FVG)
These are smart money concepts and some areas I am looking to see how price reacts. I will give higher credence to OB’s whereas FVG’s could be areas of basing/consolidation if they break. I use Sonarlab’s indicator on Tradingview to plot these.
Resistance levels - at these levels I want to see if price rejects to short or consolidates for a push up. I couple this data with Volland, intraday option flows, and Dark Pool levels. Higher timeframe OB’s or FVG will be harder to break. OB’s are the stronger levels over FVG’s.
4508-4519 - OB (30min chart)
4513 midline
4523-4536 - OB (1hr chart)
4529 midline
4534-4540 - OB (30min chart)
4537 midline
4572-4582 - OB (2hr, 4hr chart)
4577 midline
4638-4660 - FVG (4hr chart)
4652-4665 - OB (1hr, 2hr chart)
4658 midline
Support levels - at these levels I want to see if price rejects to long or consolidates for a push down. I couple this data with Volland, intraday option flows, and Dark Pool levels. Higher timeframe OB’s or FVG will be harder to break. OB’s are the stronger levels over FVG’s.
4425-4416 - OB (1hr chart)
4421 midline
4408-4399 - OB (2hr chart)
4404 midline
4393-4380 - OB (1hr, 2hr chart)
4387 midline
4344-4328 - OB (2hr chart)
4336 midline
Weekly Option Expected Move
SPX’s weekly option expected move is ~77.87 points. SPY’s expected move is ~7.86. That puts us at 4555.89 to the upside and 4400.15 to the downside. For SPY these levels are 454.67 and 438.95.
Remember over 68% of the time price will resolve it self in this range by weeks end.
Volland Data
For a better understanding of the various greeks below I would suggest you visit the Volland YouTube Page. Volland provides unique data showing where dealers are positioned providing in my opinion a higher degree of conviction to where price may move to.
Vanna - Levels where price may repel or act as magnet
Remember for price to go above spot through a magnet or repellent VIX and IV must decrease or stay flat. For price to go below spot through a magnet or repellent VIX and IV must increase.
Positive vanna - will act as magnet
Negative vanna - will act as repellent
When price goes through a positive or negative level it will flip it - ie negative becomes positive and vice versa.
Above Spot:
4505 - negative vanna
4520-4550 - negative vanna
4570 - negative vanna
4580-4605 - negative vanna
Below Spot:
4485-4475 - negative vanna
4465 - negative vanna
4455 - negative vanna
4440 - negative vanna
4405 - negative vanna
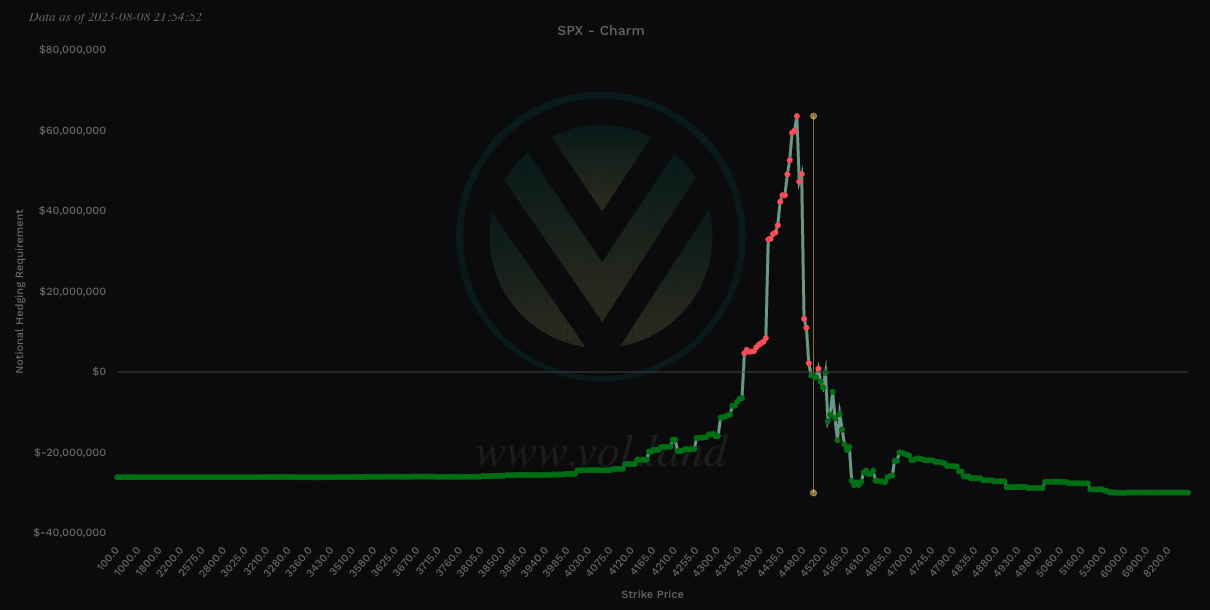
Charm
Remember if IV is not expanding Charm will start to overtake Vanna especially 0DTE as it comes closer to expiration.
For all expiry’s, Charm total notional value is bullish - negative is bullish and positive bearish - take the total of the far left and far right values. This is a longer term view of the market and suggests we find key dips to buy to long.
To cover our basis…
Welcome to my Substack where I provide a daily SPX trading plan to help guide my intraday trading. The purpose of this letter is not to advice you on your trading or investment decisions. I am simply documenting my daily trading plan for myself to help with planning and execution. These are simply my opinions and the data sourced from the likes of vol.land, TradingView, Quant Data and others. The stock market is risky, gains are not guaranteed. This is not about getting rich quick, but learn to educate yourself and make the necessary financial decisions on your own. This is not financial advice.


