April 17, 2023 SPX, SPY, ES Trade Plan
OPEX Week, Lite News Catalysts Until Friday, and FED Speakers All Week
Good evening/day/morning traders. At a high level this week will be interesting and could present us many opportunities for traps, failed breakouts or breakdowns as we gear into April’s OPEX on Friday. So reminder, take your profits and don’t let them turn from green to red and cut any losses earlier than holding onto them and even worst cost averaging into them.
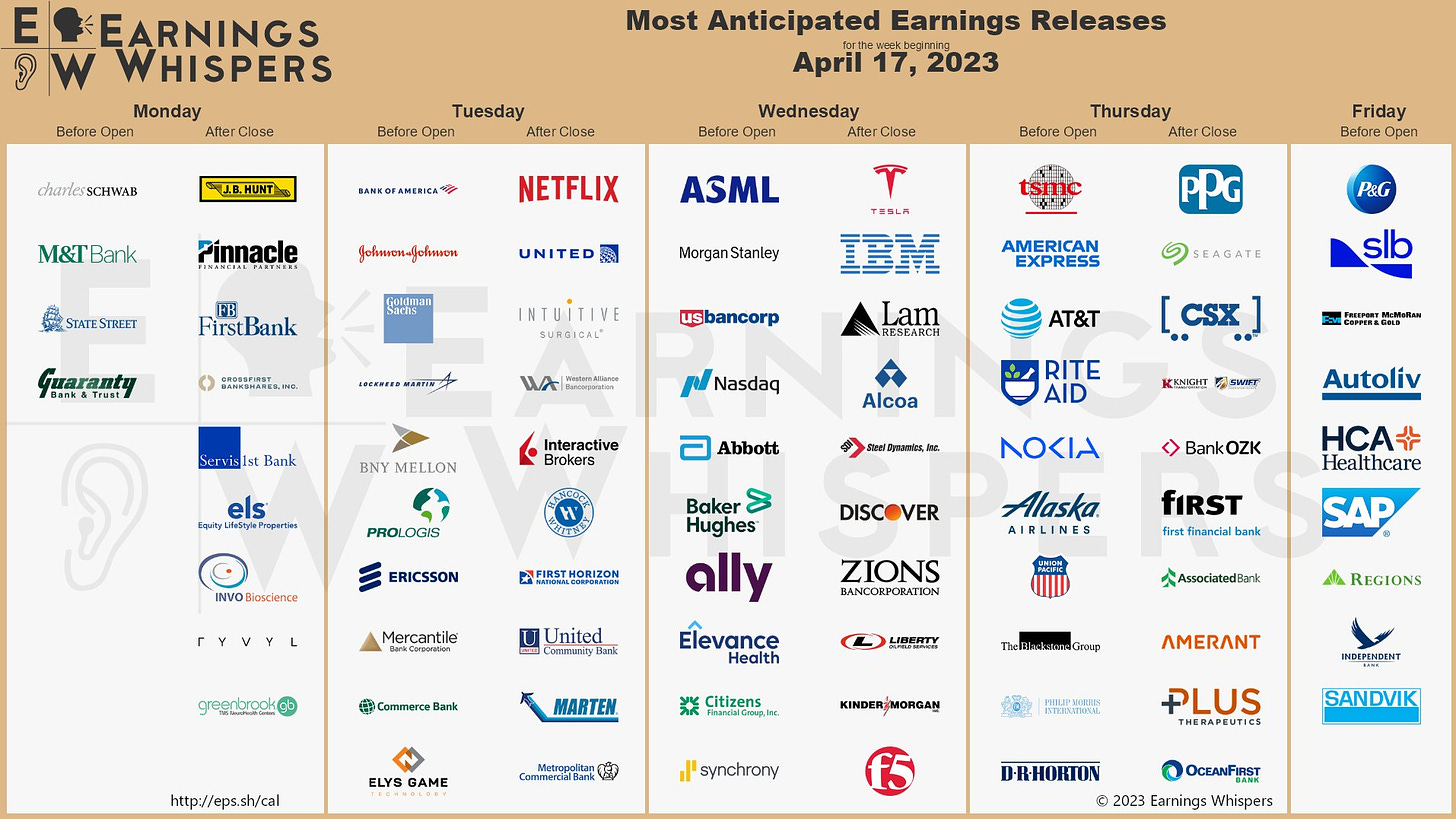
While news catalysts are minimal this week, we do have more earnings reports this week. Weekly Snapshot of companies reporting include Tesla, Netflix, United Airlines, Goldman Sachs, Lockheed Martin, ASML, Lam, and TSMC.
Last session trading recap
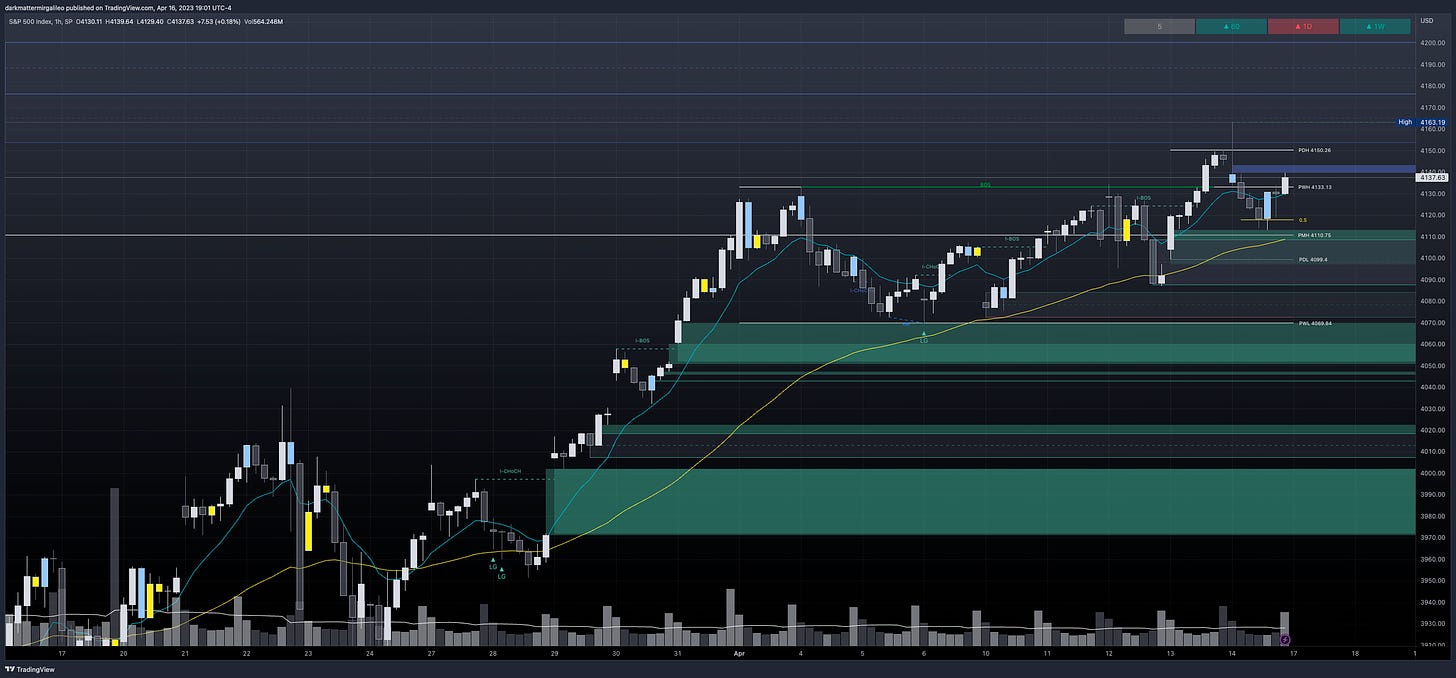
Friday was a tough day to trade the open. This is why we must be careful with news and data points that come out after the bell and at that 10am est time slot. By all means it felt bullish as heck where we broke our 4150 bias level and rode immediately 13pts up to a high of 4163 before price stalled waiting for the news catalyst.
Above 4150 target 4190
It is right after hitting that high, the news came out and the market immediately begin to sell below 4150 again and triggering our second trade of the day. It is never easy to predict and I don’t try to predict here, but had news gone our way we would have seen the upper zone of the target in the plan. The fact we got 13pts is still great, and for consideration I did add in one of our key levels the below:
4143-4160 - OB (30min chart)
While yes it broke above this and therefore mitigating it if you went into a 45min or even 1hr timeframe we didn’t mitigate this supply or order block zone.
Our second trade that hit stress free was our bearish idea and its low went as far as 4113.
Below 4145 target 4130-25
Let’s get into the trade plan and review our key levels…
I enjoy interacting and learning from other traders so continue to share your trades, ideas, and how you use this trade plan by messaging me on Twitter @DarkMatterTrade.
News Catalyst
10:00am est - NAHB Housing Market Index
While we have a slower than expected week of news, we do have the continuation of earnings reports coming out.
For more information on news events, visit the Economic Calendar
SPX/ES/SPY Trade Plan
Remember you can use this SPX trade plan to trade ES or SPY. ES value is approx. 27-30pts more than the SPX levels shared below.
Bullish bias:
Above 4145 target 4160
If there is a failed breakdown of 4125 target 4140
Bearish bias:
Below 4140 target 4125
If there is a breakdown of 4125 target 4100
If there is a failed breakout of 4160 target 4145
SPX - The Why Behind the Plan
Key Levels
Below Spot - support:
4133-4124 - OB (15min chart)
4125 - negative vanna
4125 - positive gamma
4113-4097 - FVG (2hr chart)
4108-4088 - OB (1hr chart)
4100 - positive gamma
4075 - negative vanna
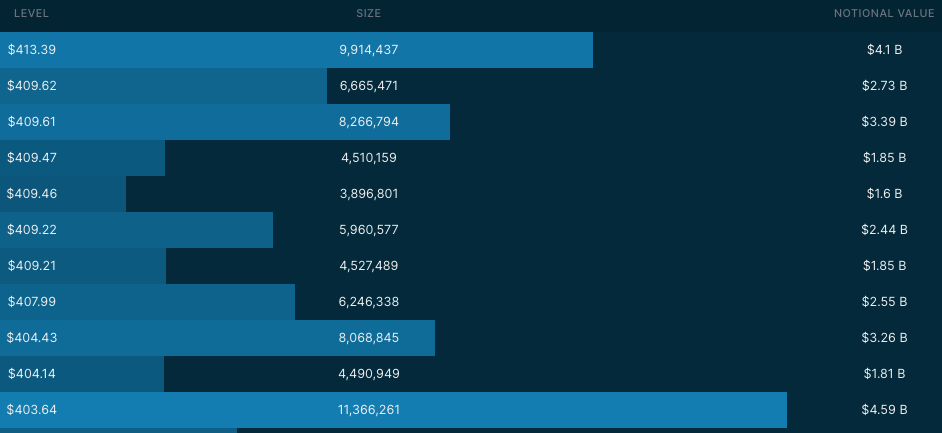
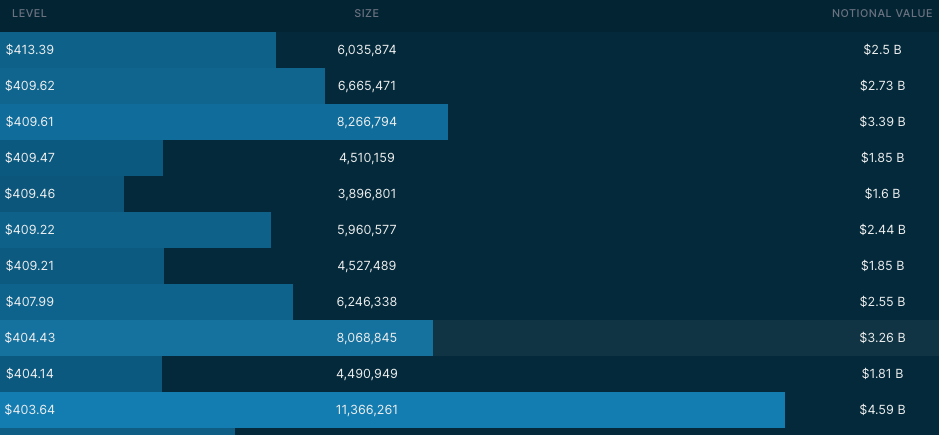
4104-08 - (409.21, 409.46, 409.61) - Over $13.91B has printed at this level
4045-55 - (403.63) - $6B has printed at this level
Above Spot - resistance:
4139-4143 - FVG (1hr chart)
4140 - negative vanna
4145 - positive gamma
4146 - (413.39) - $4.1B has printed at this level
4153-4176 - OB (1hr chart)
4150 - negative vanna
4160 - positive gamma
4175 - positive gamma
4176-4200 - OB (2hr chart)
Dark Pool Levels
We need to pay attention to some key levels that have Dark Pool buildup. Mark them on your chart as key levels that we should pay attention to. I get my dark pool levels from Quant Data.
4146 - (413.39) - $4.1B has printed at this level
4104-08 - (409.21, 409.46, 409.61) - Over $13.91B has printed at this level
4092 - (407.99) - $2.55B was printed at this level
4045-55 - (403.63) - $6B has printed at this level
4000 - (398.76) - $5.77B has printed at this level
3950-70 - (395.62) - Over $8B has printed at this zone
3910-15 - (390.11) a key dark pool level that kept the market supportive
Here is a summary chart from Quant Data that shows the key levels that have been bought up in dark pool prints since the beginning of March 1, 2023. Remember the levels where we see dark pool prints greater than $2B should peak our interest.
Orderblocks (OB) and Fair Value Gaps (FVG)
These are smart money concepts and some areas I am looking to see how price reacts. I will give higher credence to OB’s whereas FVG’s could be areas of basing/consolidation if they break.
Resistance levels - at these levels I want to see if price rejects to short or consolidates for a push up. I couple this data with Volland, intraday option flows, and Dark Pool levels. Higher timeframe OB’s or FVG will be harder to break. OB’s are the stronger levels over FVG’s.
4139-4143 - FVG (1hr chart)
4153-4176 - OB (1hr chart)
4176-4200 - OB (2hr chart)
Support levels - at these levels I want to see if price rejects to long or consolidates for a push down. I couple this data with Volland, intraday option flows, and Dark Pool levels. Higher timeframe OB’s or FVG will be harder to break. OB’s are the stronger levels over FVG’s.
4133-4124 - OB (15min chart)
4113-4097 - FVG (2hr chart)
4113-4106 - FVG (15min chart)
4108-4088 - OB (1hr chart)
4084-4072 - OB (1hr chart)
4070-4060 - FVG (1hr chart)
4060-4051 - FVG (2hr chart)
The 2HR chart is also showing a growing order block growing in the 4127-4087. This is a key critical demand zone to mark on your charts - once this demand zone breaks I think that is when we will see us target 4050.
Volume Profile
Let’s review the volume profile and some key levels there. If you are unfamiliar with the Volume Profile I highly suggest reviewing some YouTube videos or reading this quick overview on it.
Some keywords to be aware of:
VAH = value area high
VAL = value area low
POC = point of control
A naked POC means it hasn’t been tested after it was formed - these will typically act as magnets
For a thorough review of the Volume Profile visit Captain’s SPY trade plan…You can take his levels and multiple by 10.03 to get SPX levels.
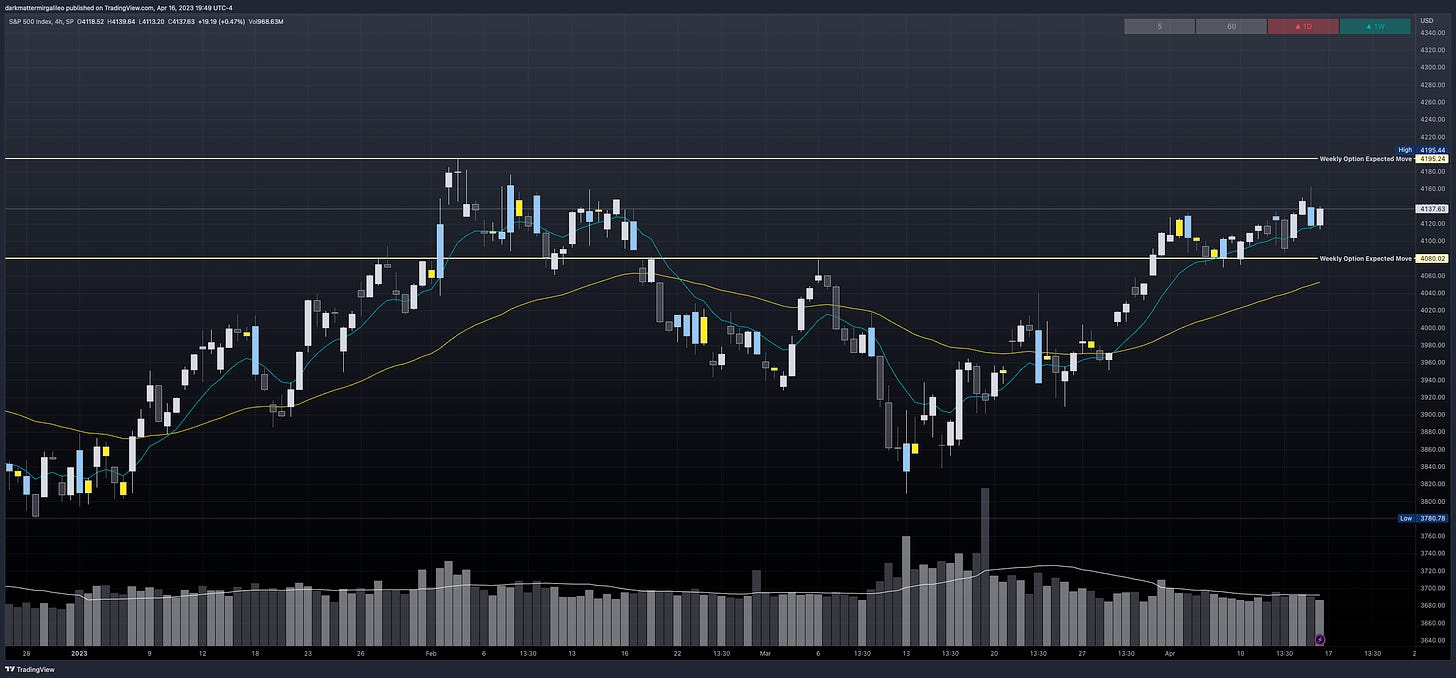
Weekly Option Expected Move
SPX’s weekly option expected move is ~57.61 points. SPY’s expected move is ~5.95. Remember over 68% of the time price will resolve it self in this range by weeks end.
VIX Update
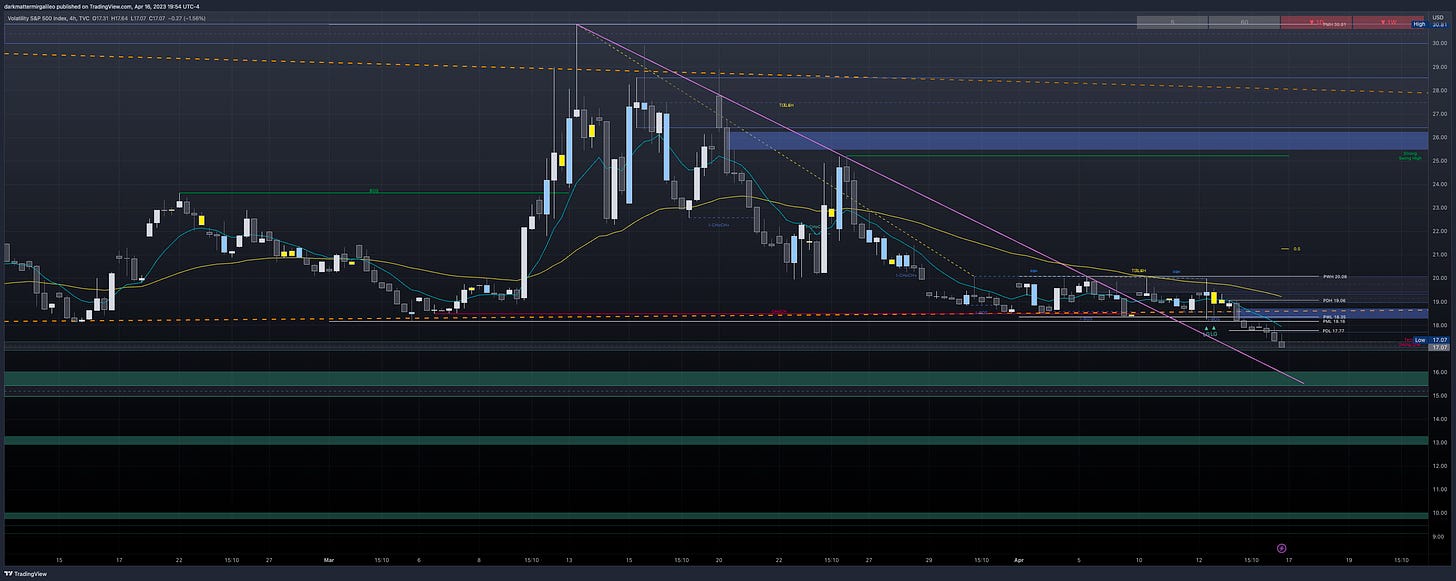
Let’s review the VIX chart and its key levels…
Above Spot:
18.29-18.72
18.96-19.32
19.41-20.10
Below Spot:
17.32-16.92
We are right in the middle of this OB
16.40-16.00
16.04-15.44
15.44-14.95
14.13-12.95
Remember, typically VIX going down correlates with a uptrend in the market and vice versa for a downtrend in the market.
Volland Data
For a better understanding of the various greeks below I would suggest you visit the Volland YouTube Page. Volland provides unique data showing where dealers are positioned providing in my opinion a higher degree of conviction to where price may move to.
Vanna - Levels where price may repel or act as magnet
Remember for price to go above spot through a magnet or repellent VIX and IV must decrease or stay flat. For price to go below spot through a magnet or repellent VIX and IV must increase.
Positive vanna - will act as magnet
Negative vanna - will act as repellent
When price goes through a positive or negative level it will flip it - ie negative becomes positive and vice versa.
Above Spot:
4140 - negative vanna
4150 - negative vanna
4155-4210 - positive vanna
4215 - negative vanna
Below Spot:
4135 - negative vanna
4125 - negative vanna
4120-4080 - positive vanna
4075 - negative vanna
Gamma and Delta-Adjusted Gamma (DAG)
Positive Gamma Above Spot - acts as resistance
Positive Gamma Below Spot - acts as support
Negative Gamma - becomes permissive to price as it moves there - aka neither resistance nor support - simply just chillin and watching what’s happening…
Above Spot:
4145 - positive gamma
4155-4210 - positive gamma
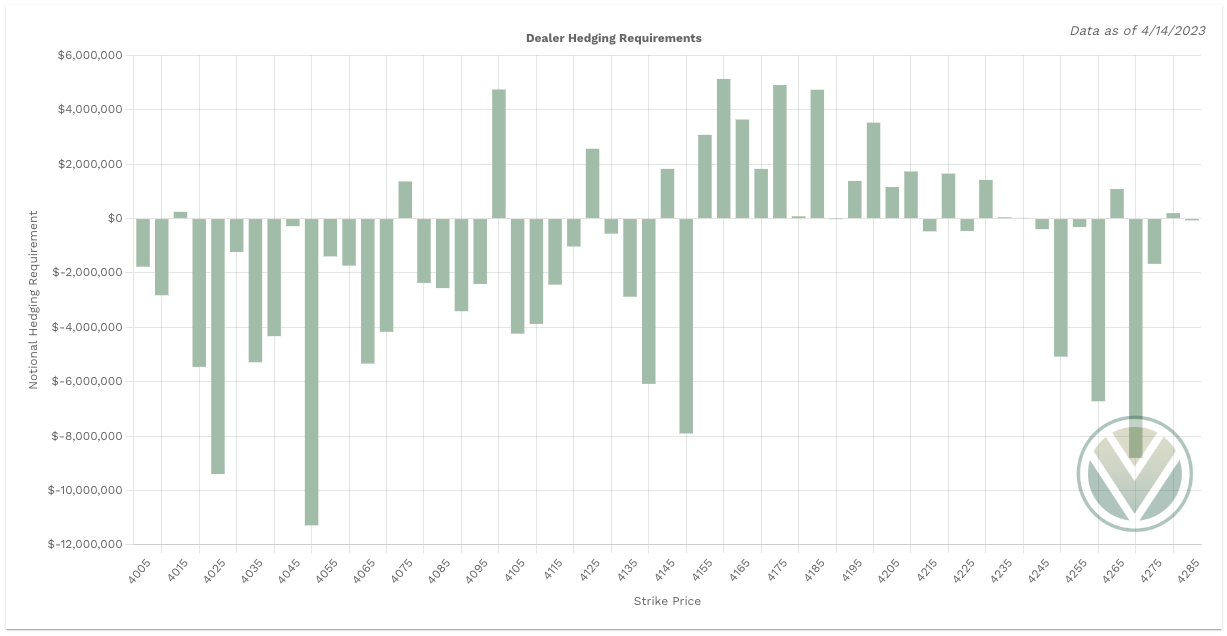
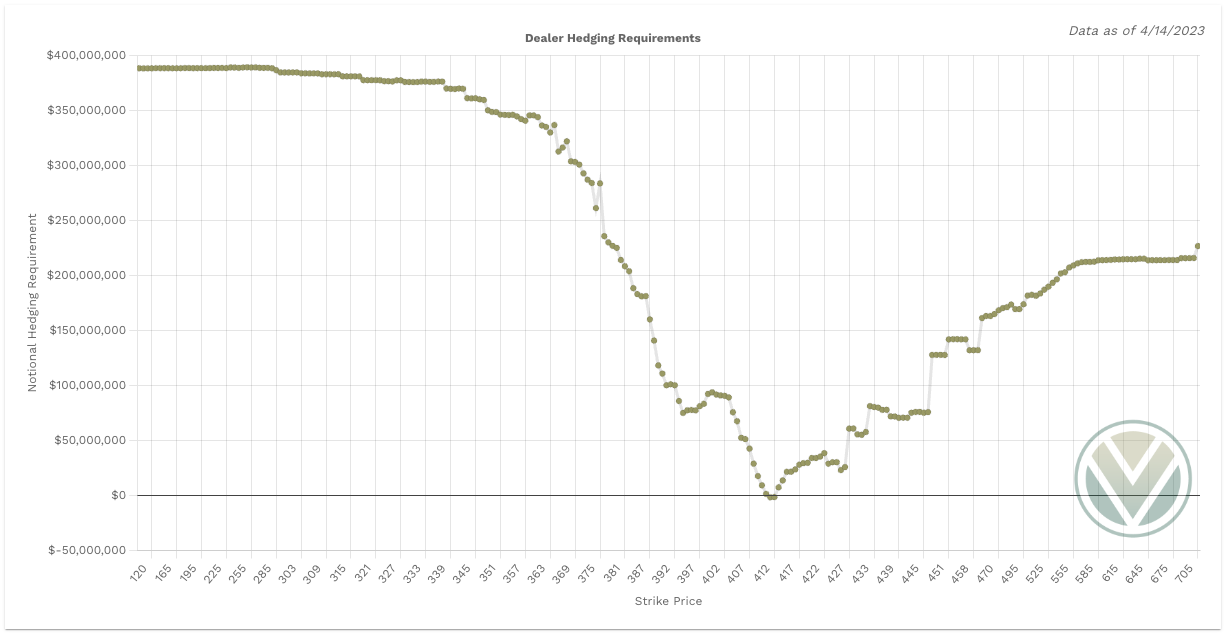
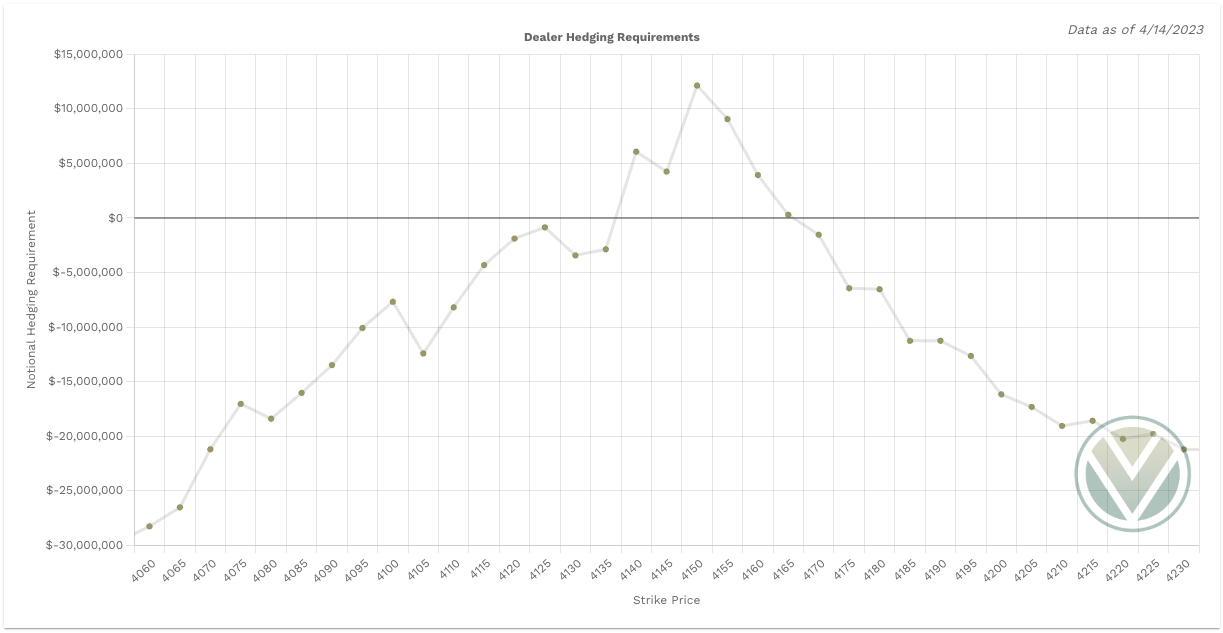
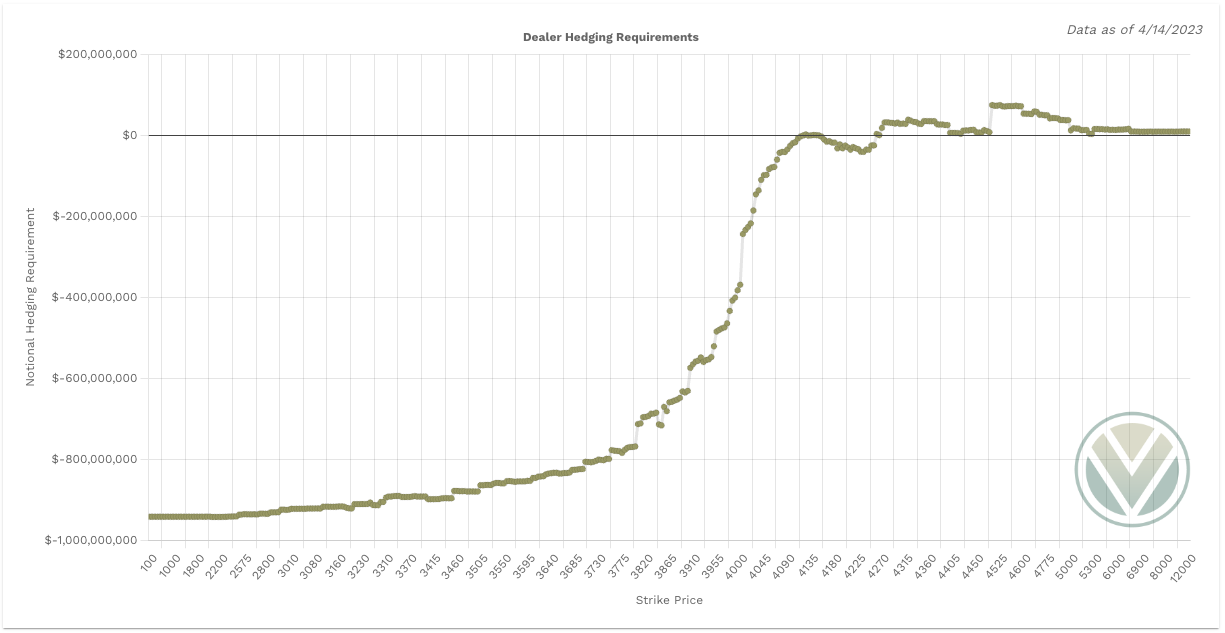
Dealers must buy between 4140-4160
Below Spot:
4125 - positive gamma
4100 - positive gamma
4075 - positive gamma
Dealers must sell below 4135 and above 4170
Charm
Charm is negative on SPX. This suggests that Charm will have little a more bullish impact on SPX, but the total notional value is minimal. While bullish I don’t see major upside from any charm effect. Again this is an aggregate view of SPX - doesn’t guarantee 0DTE bullish bias.
When reviewing Charm we also need to account for SPY’s charm. It is leaning bearish and continues to grow from last week.
For the full charm effect to play out ideally we want to see SPX and SPY in sync.
To cover our basis…
Welcome to my Substack where I provide a daily SPX trading plan to help guide my intraday trading. The purpose of this letter is not to advice you on your trading or investment decisions. I am simply documenting my daily trading plan for myself to help with planning and execution. These are simply my opinions and the data sourced from the likes of vol.land, TradingView, Quant Data and others. The stock market is risky, gains are not guaranteed. This is not about getting rich quick, but learn to educate yourself and make the necessary financial decisions on your own. This is not financial advice.


