April 13, 2023 SPX, SPY, ES Trade Plan
Mild recession they now say huh? What happened to no recession...
Good evening/day/morning traders. CPI came and we had the initial fakeout on initial news announcement and after that we sold off to then retrace some of what we sold off only to then trap bulls to sell off in the last couple hours of the session.
These are tough markets and even with data if you are not managing risks or oversizing your trades your emotions will catch up to you and make you have a bad decision. Add on top of that if you are trading 0DTE options the decay and the sideways or rubberband snapback like moves will completely destroy your bank.
So if there is anything you have learned in this market this week it is:
Take profit while you can - on the initial break of 4110 we got a 10pt selloff - while the levels and targets are there to guide you never let a trade go from green to red. Take those profits, reassess, and enter the trade again
0DTE options are risky as hell and as more money makers use it as an opportunity to hedge or even tilt the market in their favor you will get chopped up quickly with how fast the decay in these premiums occur. Simply trade 1DTE options at minimum or if you are trading SPY go weekly - the reward may not be as high, but the emotional toll and potential drawdown can be minimized
Last session trading recap
Today I ended up taking three trades - more than I normally do but on a rather large day of news catalysts premarket and in the afternoon opportunities will present itself. The first one being…
If there is a failed breakout of 4135-40 target 4115
This move came extremely fast and all within the first 10 minutes of market open. In these 2 5 min candles we had a double top, sellers pushing price down as it got near the highs. On big news event days I will get into a trade as quickly as I did because it hit a key level and based on my data this level would be a tough one to break. So I didn’t wait the full half hour like I usually did. The premarket move did it for me…
Now the mistake I did make and should have called it out and although we pushed down past 4110 and had another trade idea during the first selloff we bounced or rallied at 4095. At 4100 was a gamma level of interest and while I took puts on the break of 4110 I sold them when I started to see price hold the 4095-4100 level. This was a great call as we rallied almost 30pts from these lows into 4125.
This is when I saw SPX/SPY hit a bearish OB/resistance prior to the FOMC minutes and added puts at 4120 and I did get some heat on this post FOMC minutes, but I quickly analyzed the minutes and headlines and what did we see? FED sees the increase chances of a mild recession lasting up to 2 years. Wow you got to be kidding me and this is after a FED that has been saying there will be no recession…
The rest is history although I had a few points draw against me we finally had the market selloff and then enjoyed and took our puts with us to the bank…
Congrats if you joined us today and were able to take profit on the put side…
I enjoy interacting and learning from other traders so continue to share your trades, ideas, and how you use this trade plan by messaging me on Twitter @DarkMatterTrade.
News Catalyst
8:30am est - PPI - major news catalyst
For more information on news events, visit the Economic Calendar
SPX/ES/SPY Trade Plan
Remember you can use this SPX trade plan to trade ES or SPY. ES value is approx. 27-30pts more than the SPX levels shared below.
Bullish bias:
If there is a failed breakdown of 4075 target 4100
If there is a breakout of 4120 target 4135
Bearish bias:
Below 4100 target 4080
If there is a failed breakout of 4110 or 4120 target 4100 then 4075
If there is a breakdown of 4075 target 4060
This could be a trap so manage risk on a potential reversal
SPX - The Why Behind the Plan
Key Levels
Below Spot - support:
4075 - positive gamma
4084-4072 - OB (1HR chart)
4070-4060 - FVG (1HR chart)
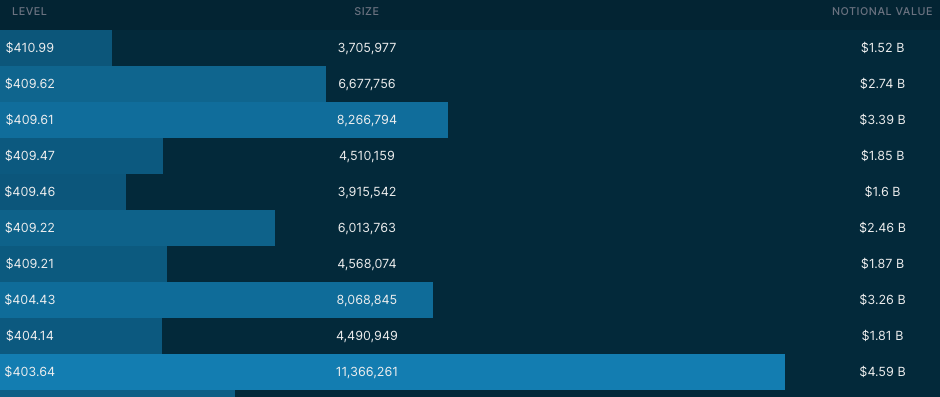
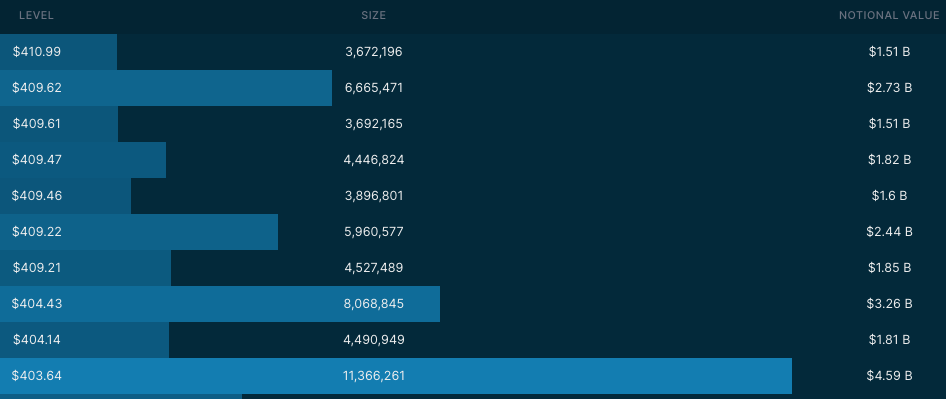
4045-55 - (403.63) - $6B dark pool printed at this level
4060-4051 - FVG (2HR chart)
4049-4035 - OB (2HR chart)
Above Spot - resistance:
4104-08 - (409.21, 409.46, 409.61) - Over $13.91 has been printed at this level
4097-4107 - FVG (1HR chart)
4094-4088 - FVG (2HR chart)
4110-20 - negative vanna
4095-4100 - positive gamma
4125-4135 - positive gamma
4135-4148 - OB (2HR chart)
4140 - negative vanna
4153-4176 - OB (1HR chart)
4150 - negative vanna
Dark Pool Levels
We need to pay attention to some key levels that have Dark Pool buildup. Mark them on your chart as key levels that we should pay attention to. Note I get my dark pool levels from Quant Data.
4104-08 - (409.21, 409.46, 409.61) - Over $13.91 has been printed at this level
An additional $1.96B was printed at this level
4045-55 - (403.63) - $6B has printed at this level
3950-70 - (395.62) - Over $8B has been printed at this zone
3910-15 - (390.11) a key dark pool level that kept the market supportive
Here is a summary chart from Quant Data that shows the key levels that have been bought up in dark pool prints since the beginning of March 1, 2023. Remember the levels where we see dark pool prints greater than $2B should peak our interest.
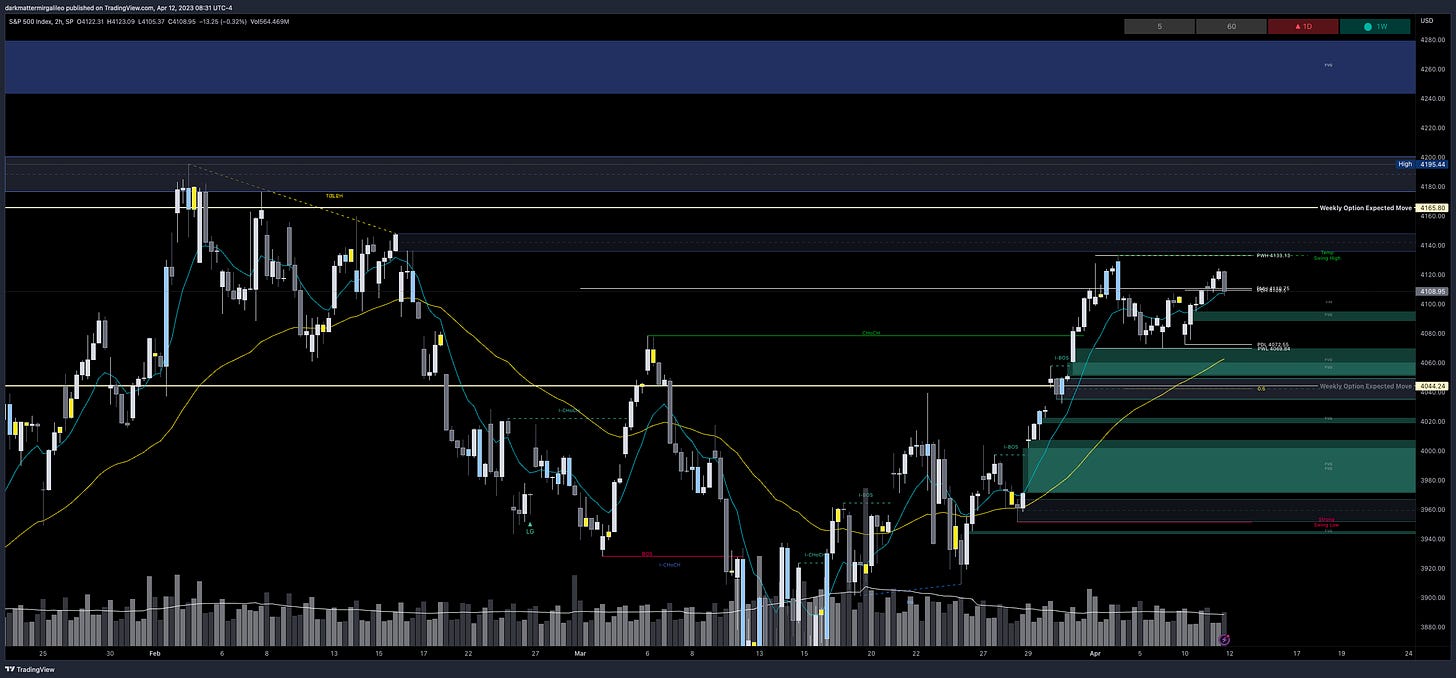
Orderblocks (OB) and Fair Value Gaps (FVG)
These are smart money concepts and some areas I am looking to see how price reacts. I will give higher credence to OB’s whereas FVG’s could be areas of basing/consolidation if they break.
Resistance levels - at these levels I want to see if price rejects to short or consolidates for a push up. I couple this data with Volland, intraday option flows, and Dark Pool levels. Higher timeframe OB’s or FVG will be harder to break. OB’s are the stronger levels over FVG’s.
4097-4107 - FVG (1HR chart)
4135-4148 - OB (2HR chart)
4153-4176 - OB (1HR chart)
4176-4200 - OB (2HR chart)
Support levels - at these levels I want to see if price rejects to long or consolidates for a push down. I couple this data with Volland, intraday option flows, and Dark Pool levels. Higher timeframe OB’s or FVG will be harder to break. OB’s are the stronger levels over FVG’s.
4084-4072 - OB (1HR chart)
4070-4060 - FVG (1HR chart)
4060-4051 - FVG (2HR chart)
4049-4035 - OB (2HR chart)
4018-4007 - OB (1HR chart)
Volume Profile
Let’s review the volume profile and some key levels there. If you are unfamiliar with the Volume Profile I highly suggest reviewing some YouTube videos or reading this quick overview on it.
Some keywords to be aware of:
VAH = value area high
VAL = value area low
POC = point of control
A naked POC means it hasn’t been tested after it was formed - these will typically act as magnets
Some key updates reviewing the volume profile with the biggest being our rejection of February’s POC twice. I suggest you visit Captain Wick’s trade plan where he breaks down the volume profile changes in full detail. It’s a good read…
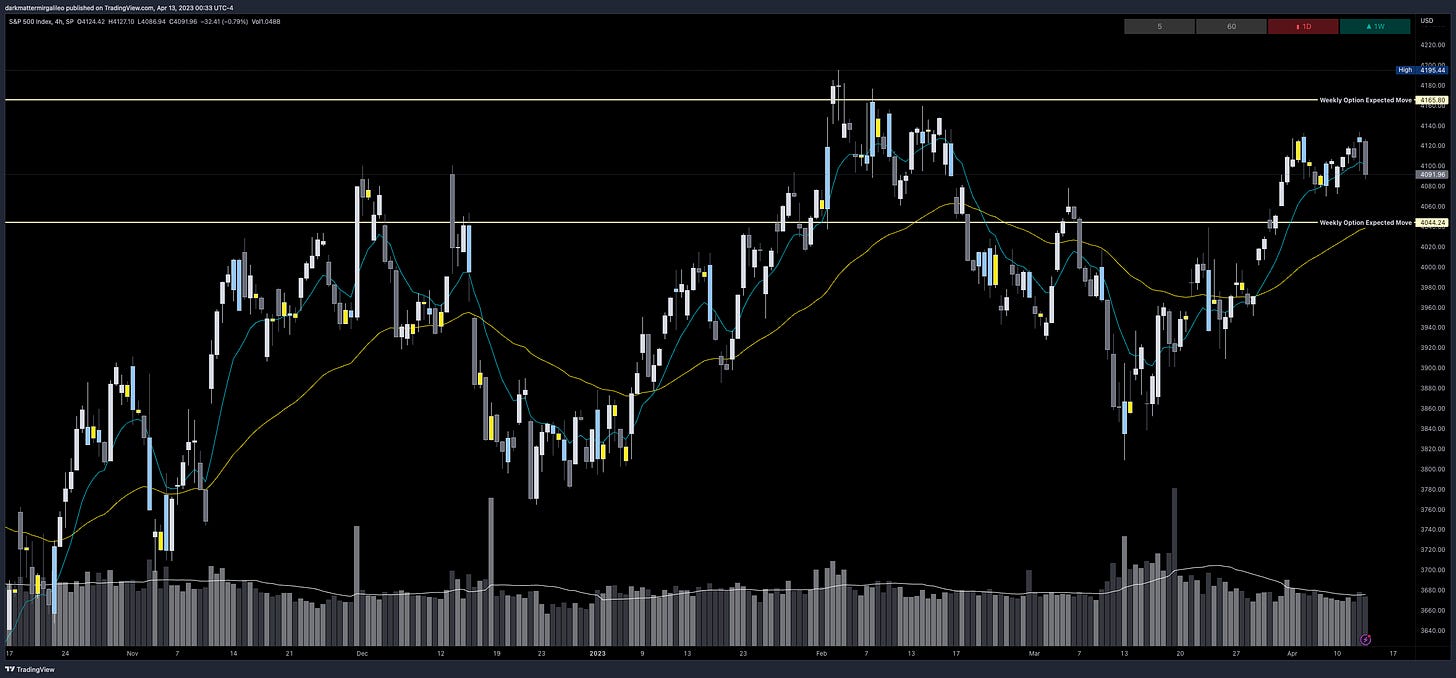
Weekly Option Expected Move
SPX’s weekly option expected move is ~60.78 points. SPY’s expected move is ~7.64. Remember over 68% of the time price will resolve it self in this range by weeks end.
VIX Update
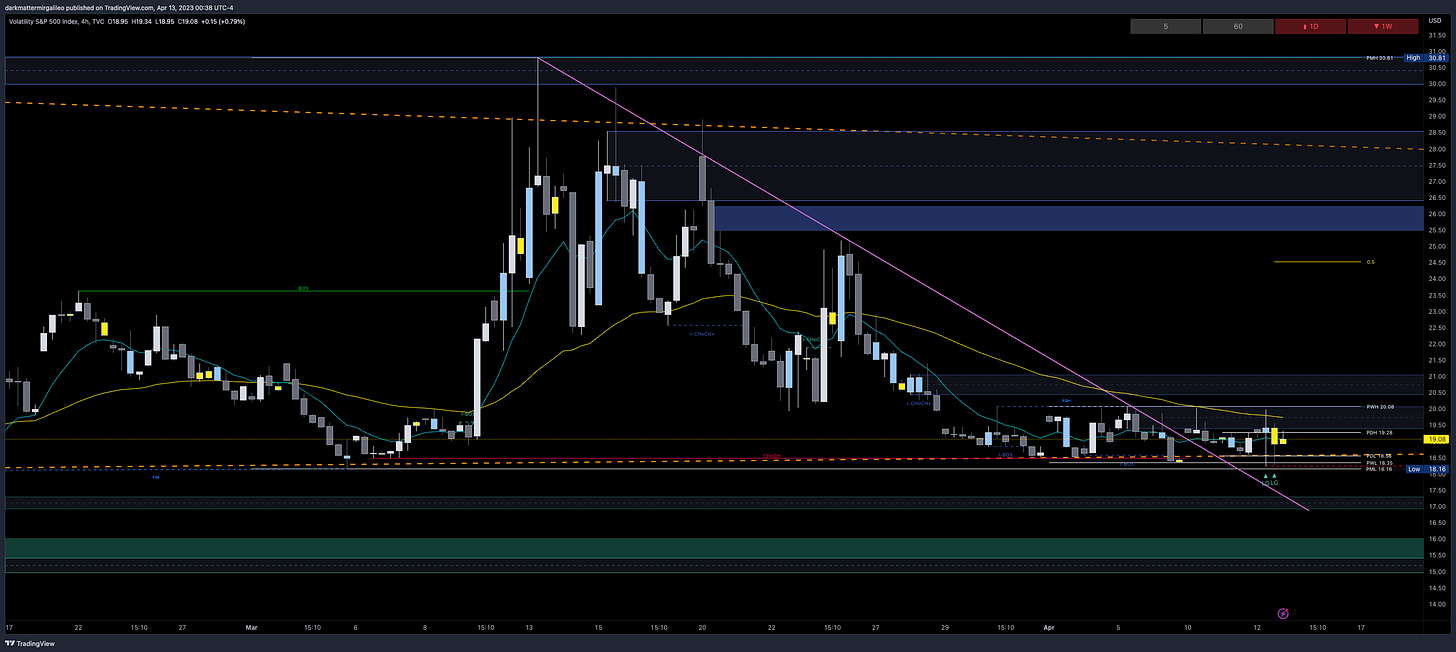
Let’s review the VIX chart. The VIX bounced off nicely from our wedge briefly breaking it and then pushing back up to again breaking the wedge only to end the day getting sucked back up.
Above Spot:
19.41-20.10
20.45-21.06
Below Spot:
18.96-18.68
17.32-16.92
16.40-16.00
16.04-15.44
15.44-14.95
14.13-12.95
Remember, typically VIX going down correlates with a uptrend in the market and vice versa for a downtrend in the market.
Vol.land Data
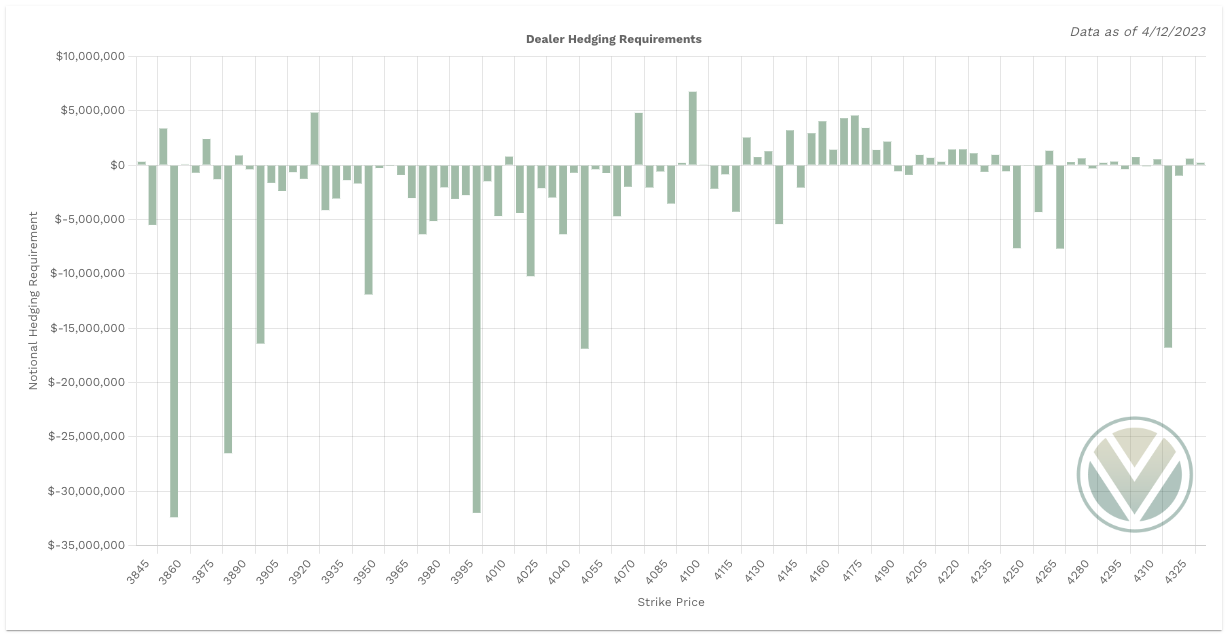
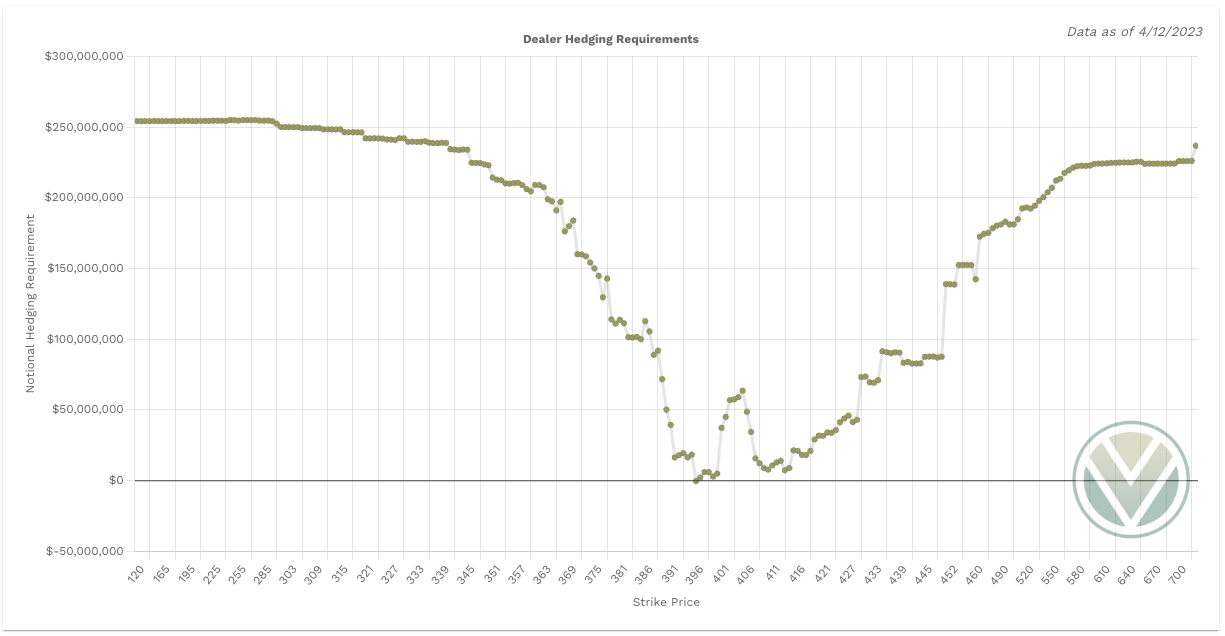
For a better understanding of the various greeks below I would suggest you visit the Volland YouTube Page. Volland provides unique data showing where dealers are positioned providing in my opinion a higher degree of conviction to where price may move to.
Vanna - Levels where price may repel or act as magnet
Remember for price to go above spot through a magnet or repellent VIX and IV must decrease or stay flat. For price to go below spot through a magnet or repellent VIX and IV must increase.
Positive vanna - will act as magnet
Negative vanna - will act as repellent
When price goes through a positive or negative level it will flip it - ie negative becomes positive and vice versa.
Above Spot:
4095-4100 - positive vanna
4100 the largest vanna
4110-4120 negative vanna
4120 the largest vanna
4125-4135 positive vanna
4140 - negative vanna
4150 - negative vanna
Below Spot:
4090-4080 - positive vanna
4075 - negative vanna
4070-4060 - positive vanna
4055 - negative vanna
4050-4020 - positive vanna
4050 and 4025 largest vanna’s
4015 - negative vanna
Gamma and Delta-Adjusted Gamma (DAG)
Positive Gamma Above Spot - acts as resistance
Positive Gamma Below Spot - acts as support
Negative Gamma - becomes permissive to price as it moves there - aka neither resistance nor support - simply just chillin and watching what’s happening…
Above Spot:
4095-4100 - positive gamma
4100 largest gamma
4125-4135 - positive gamma
4145 then 4155-4190 - positive gamma
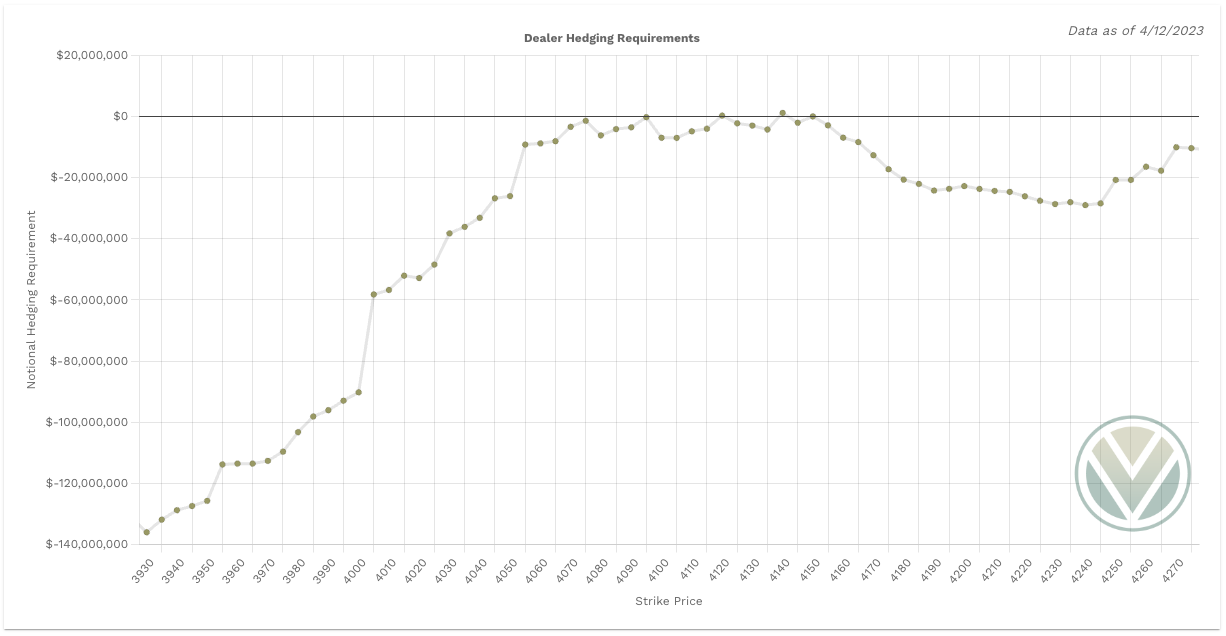
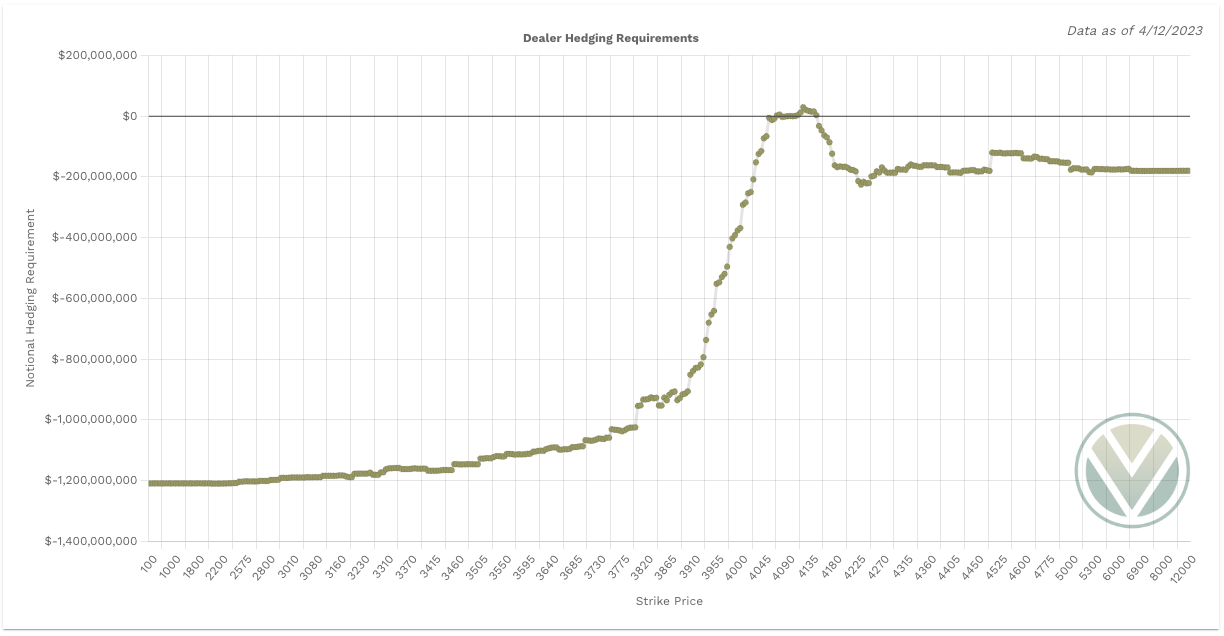
Dealers have no level they need to buy
Below Spot:
4075 - positive gamma
4015 - positive gamma
Dealers must sell below 4095 till 4075
Charm
Charm is negative on SPX. This suggests that Charm will have little a more bullish impact on SPX, but note how large its value is - roughly only $1B - take the left amount and right amount and subtract. So if any bullish bias plays out it will have minimal impact until that value increases. Again this is an aggregate view of SPX - doesn’t guarantee 0DTE bullish bias.
When reviewing Charm we also need to account for SPY’s charm. It is leaning bearish.
For the full charm effect to play out ideally we want to see SPX and SPY in sync.
To cover our basis…
Welcome to my Substack where I provide a daily SPX trading plan to help guide my intraday trading. The purpose of this letter is not to advice you on your trading or investment decisions. I am simply documenting my daily trading plan for myself to help with planning and execution. These are simply my opinions and the data sourced from the likes of vol.land, TradingView, Quant Data and others. The stock market is risky, gains are not guaranteed. This is not about getting rich quick, but learn to educate yourself and make the necessary financial decisions on your own. This is not financial advice.

