Readers,
Does anyone else feel like July was 3 months long? Anyway, if you. are a scalper you probably had a very exciting week of trading this past week. The levels of support and resistance both presented pretty good trading opportunities if you had the time to sit, watch, and trade.
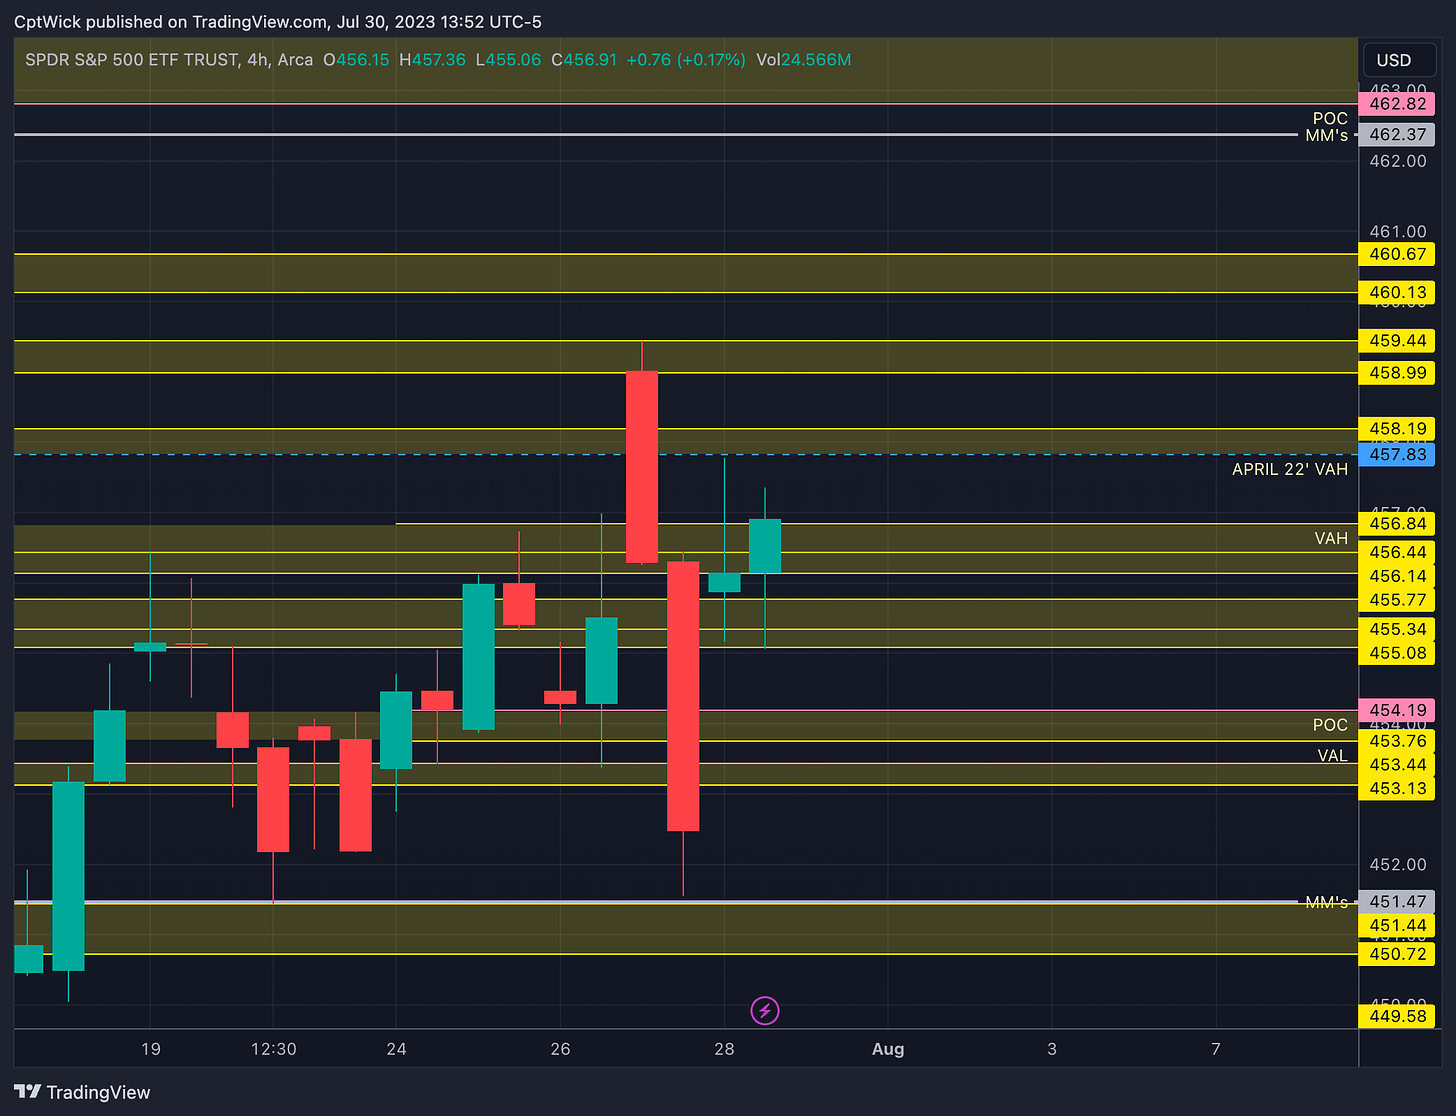
Market Makers (MMs) Weekly Expected Range
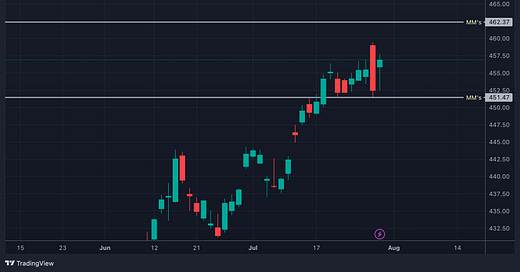
The MMs are expecting a weekly move in SPY of 5.45 this week. Notice the chart pattern that formed the last two trading sessions. We had a big fat outside bearish engulfing candle and an inside bar the following session. Some body is trapped I can promise you that.
462.37 High
451.47 Low
Monthly Volume Profile Levels
Current Value Area
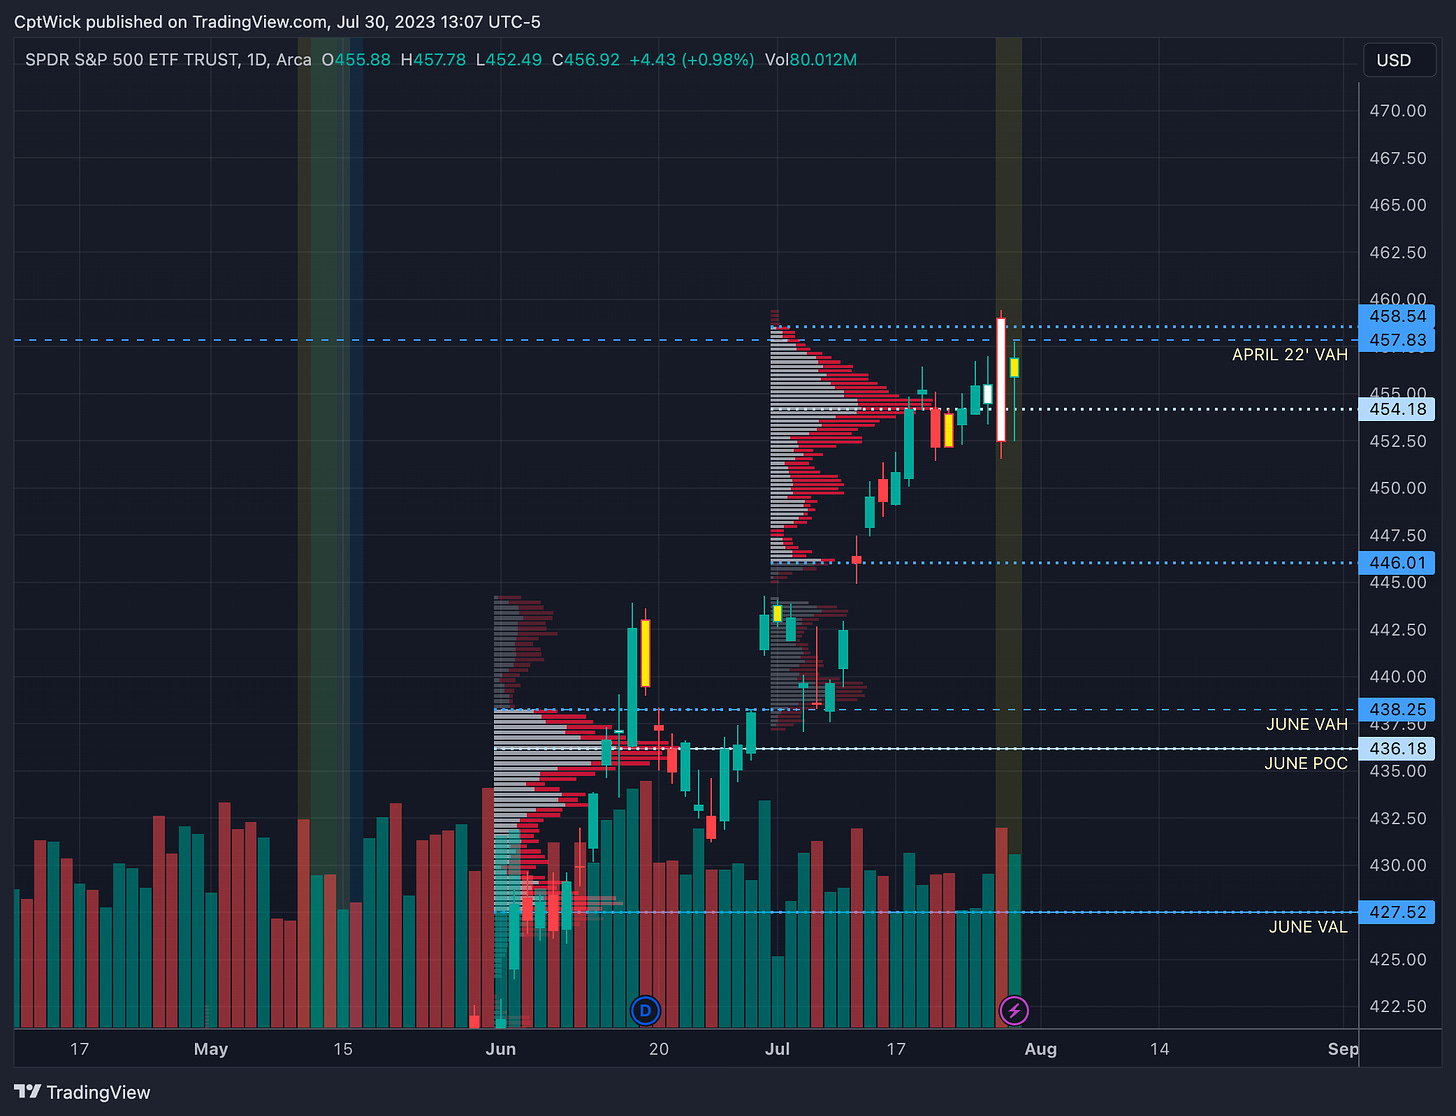
458.54 Value Area High (VAH)
454.18 Point of Control (POC)
446.01 Value Area Low (VAL)
June’s Value Area
438.25 VAH (breached)
436.18 POC
427.52 VAL
Notable Naked Levels
411.56 May POC
409.77 May VAL
A few things to point out here, tomorrow is the last trading session for this current profile. Do you like how we came right up to April 22’s value area high and paused? Notice how we are building value around this level, it is also forming to be July’s VAH but at the close tomorrow we will know what that value will stick as. Remember, we have no naked values above us right now on this profile all of the unviolated levels are below. Does that mean we have to go down? No, but I think we do have some unfinished business at that June POC of 436.18, so will that level be tested? Yes it will, but I don’t know it will be be after ATH’s or not, time will tell.
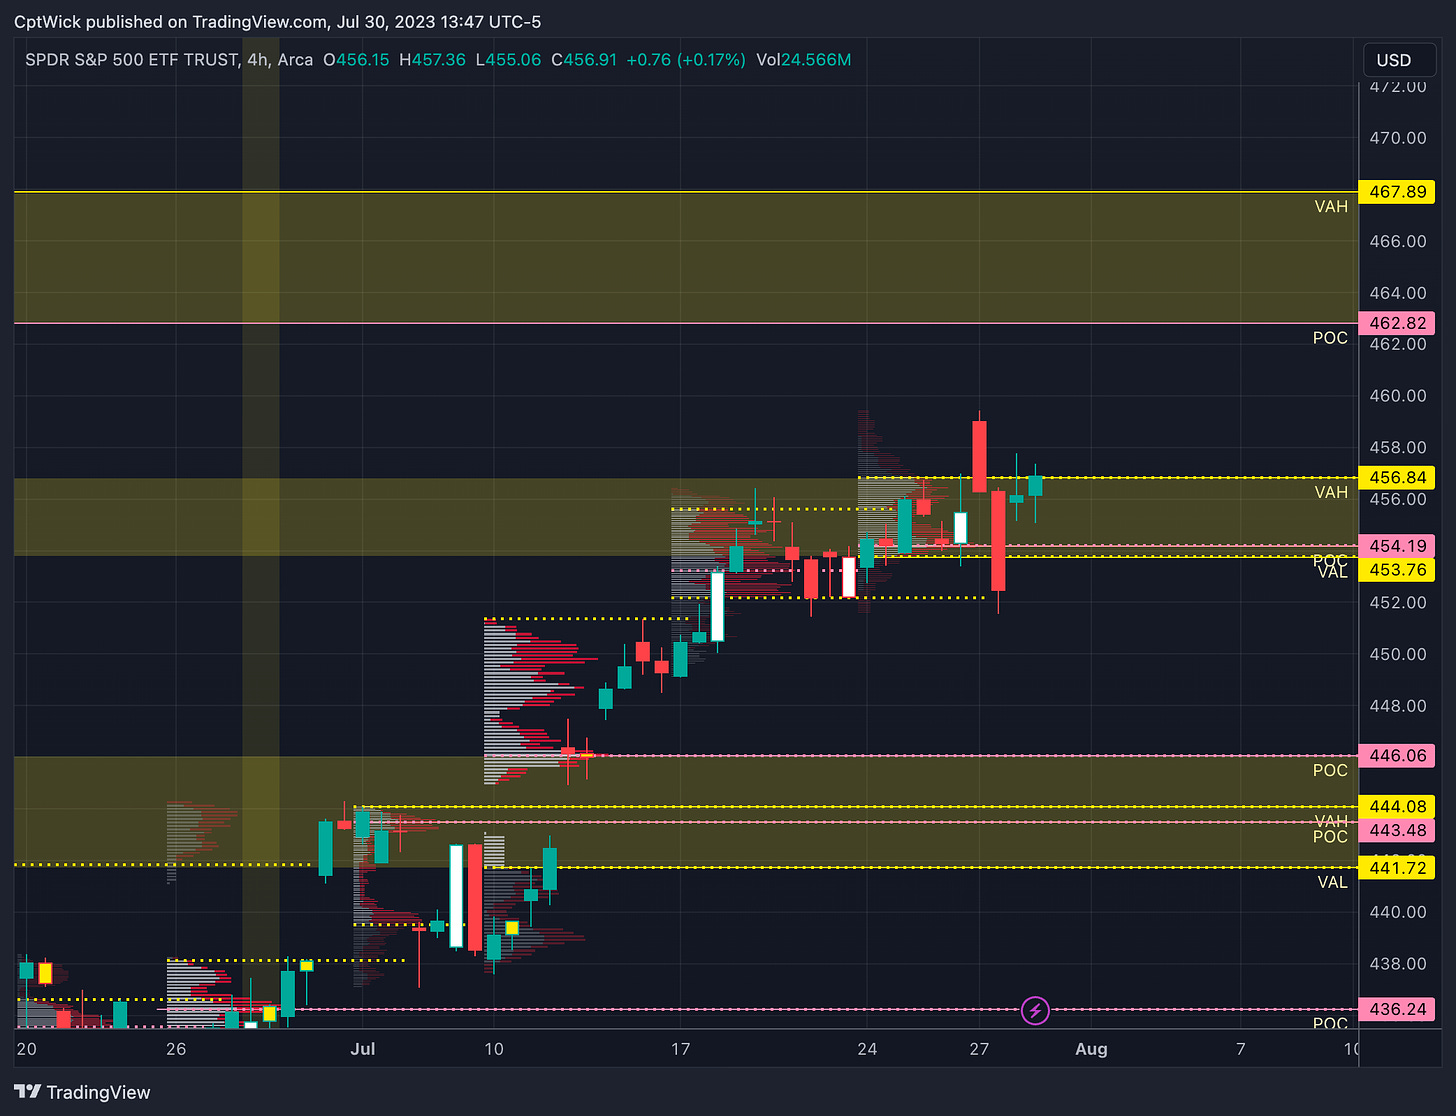
Weekly Volume Profile Levels
Last Week's Levels
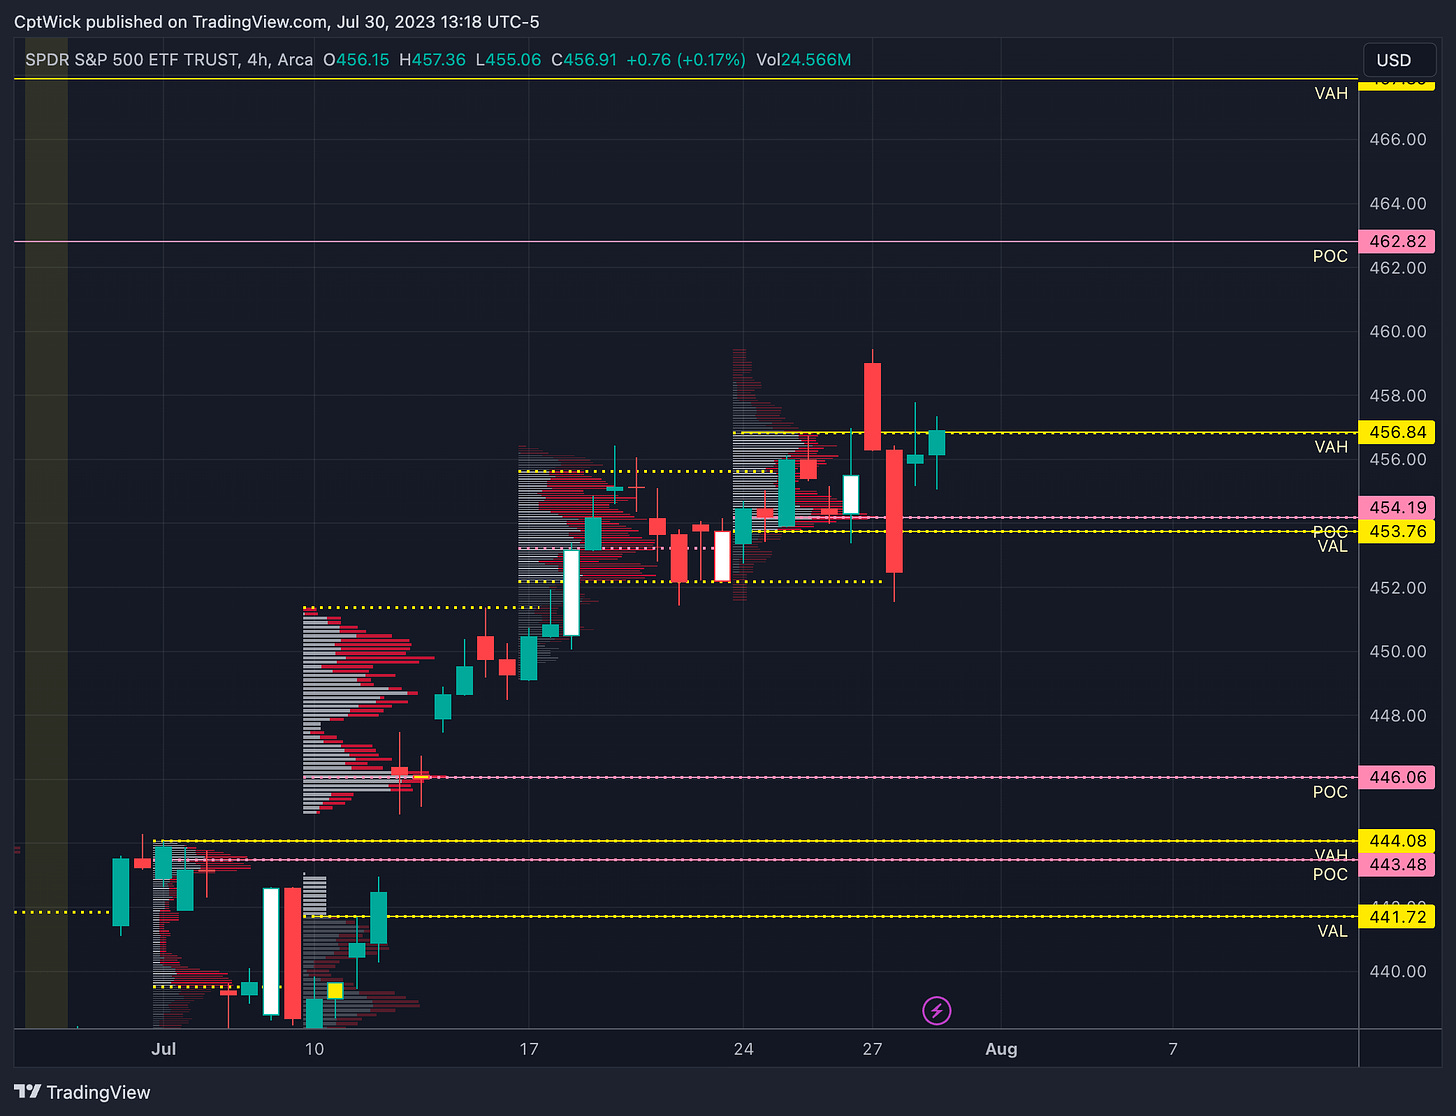
456.84 VAH
454.19 POC
453.76 VAL
Notable Naked Levels
467.89 VAH
462.82 POC
446.06 POC
444.08 VAH
443.48 POC
436.24 POC
We keep building value here, this zone has been frustrating because the top keeps getting rejected but the bottom keeps holding. Like we stated above, there are many trapped traders here, I wouldn't be surprised if we have a big move out of this zone once we finally get some direction. So when that big move happens, we need to be very mindful of a potential retest.
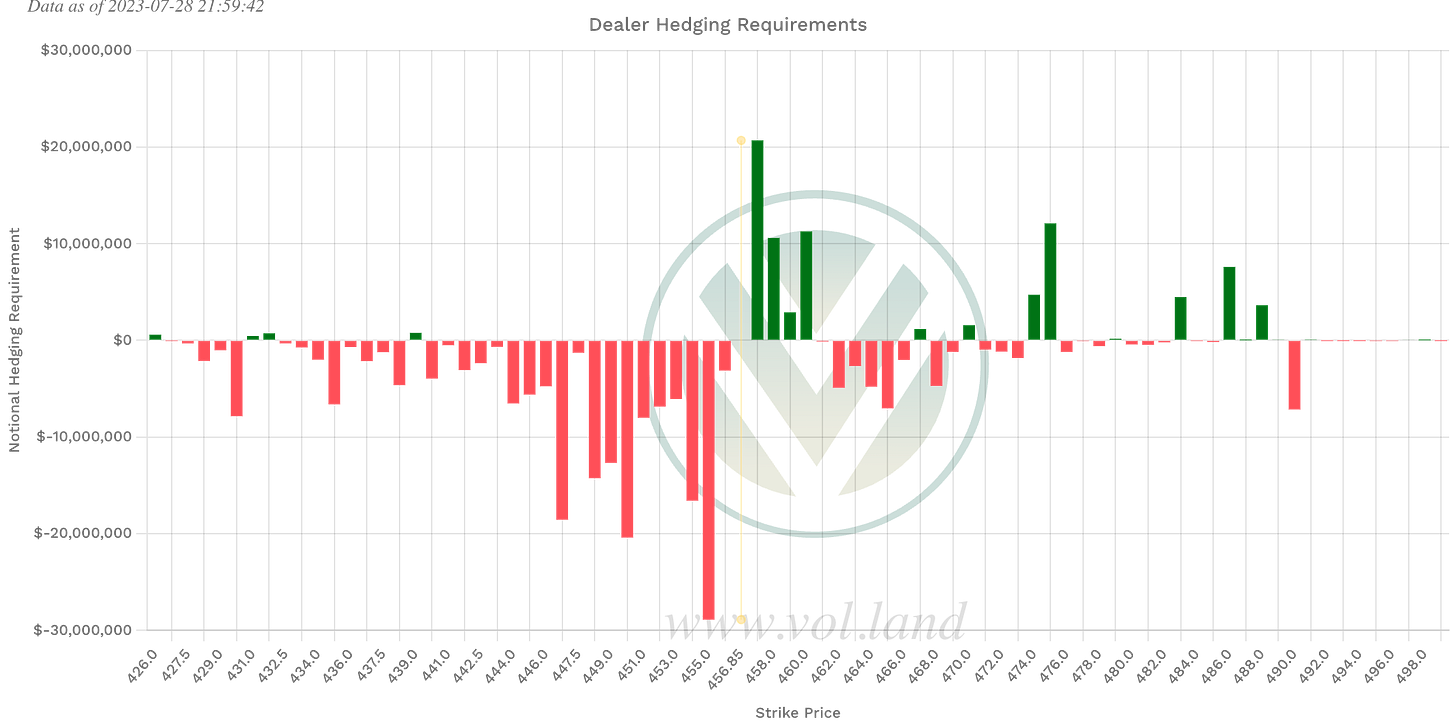
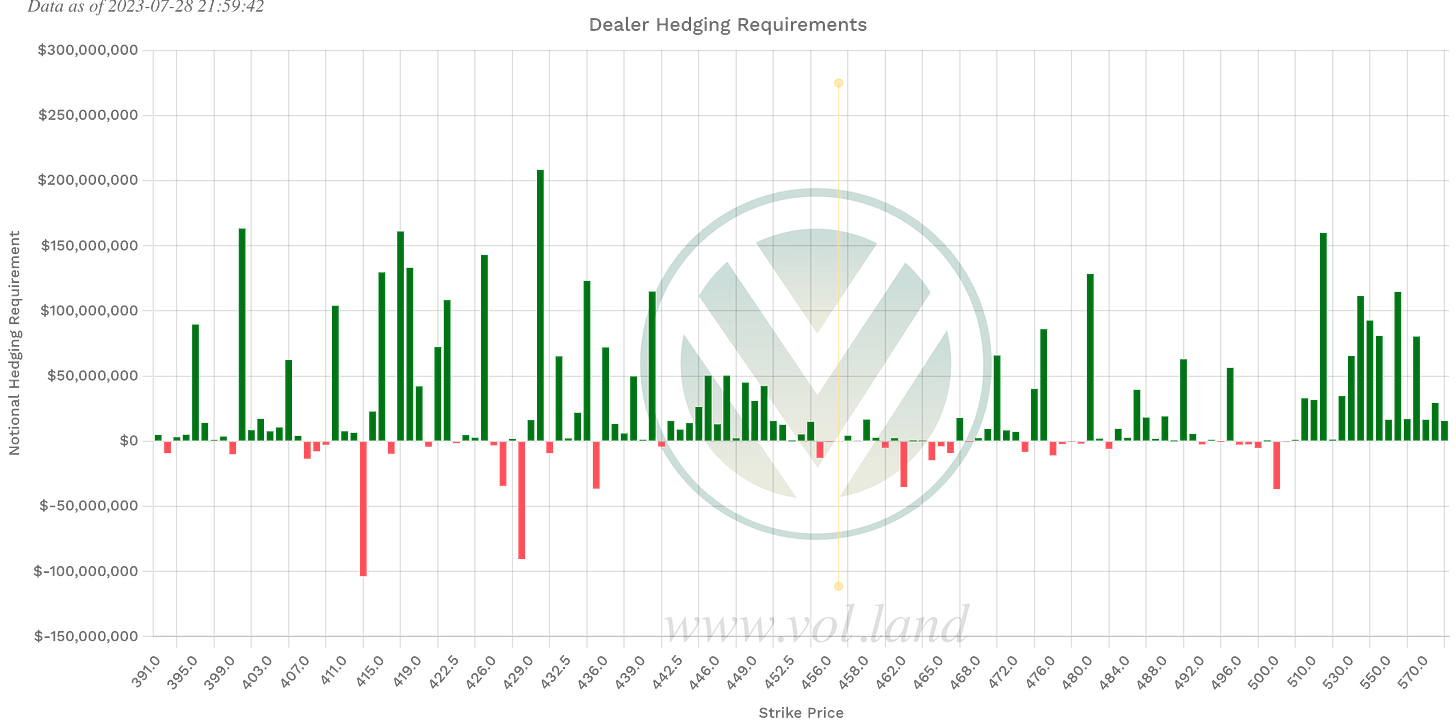
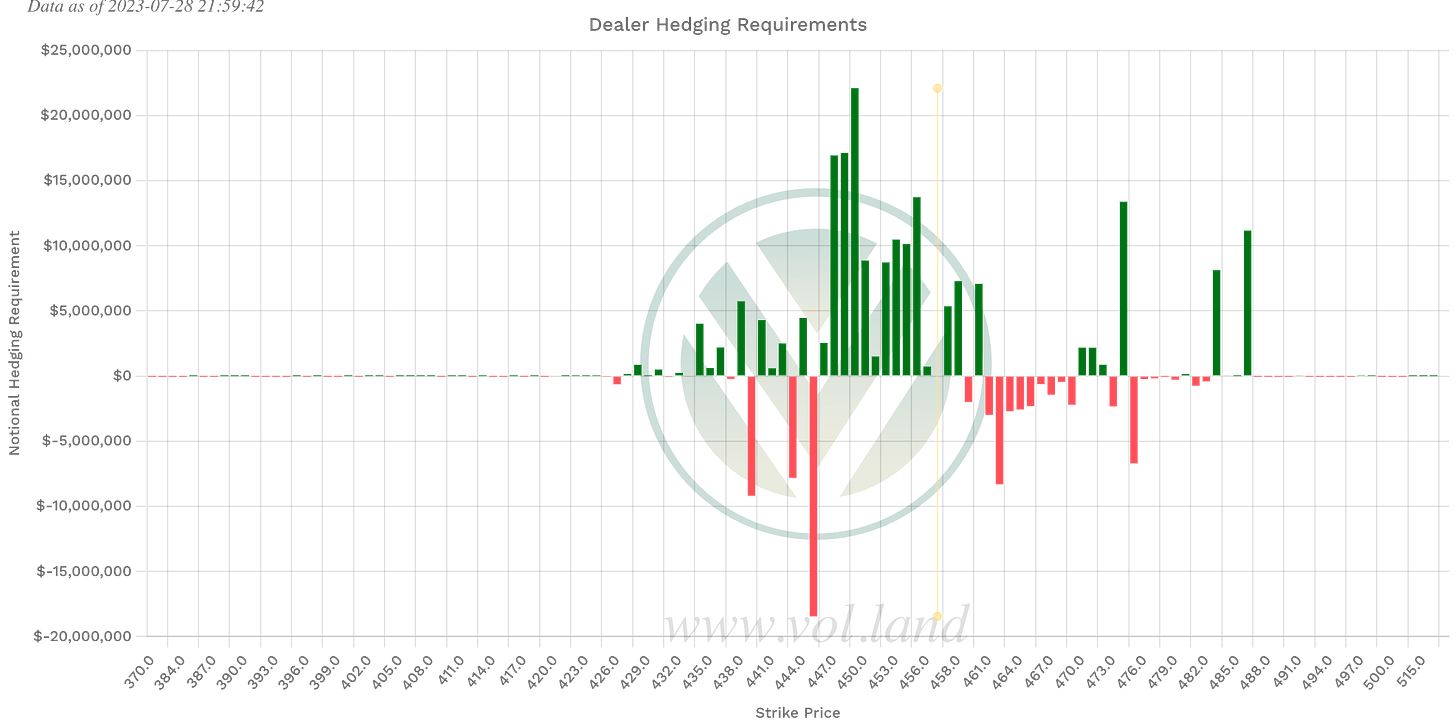
Positive Gamma
Aggregate
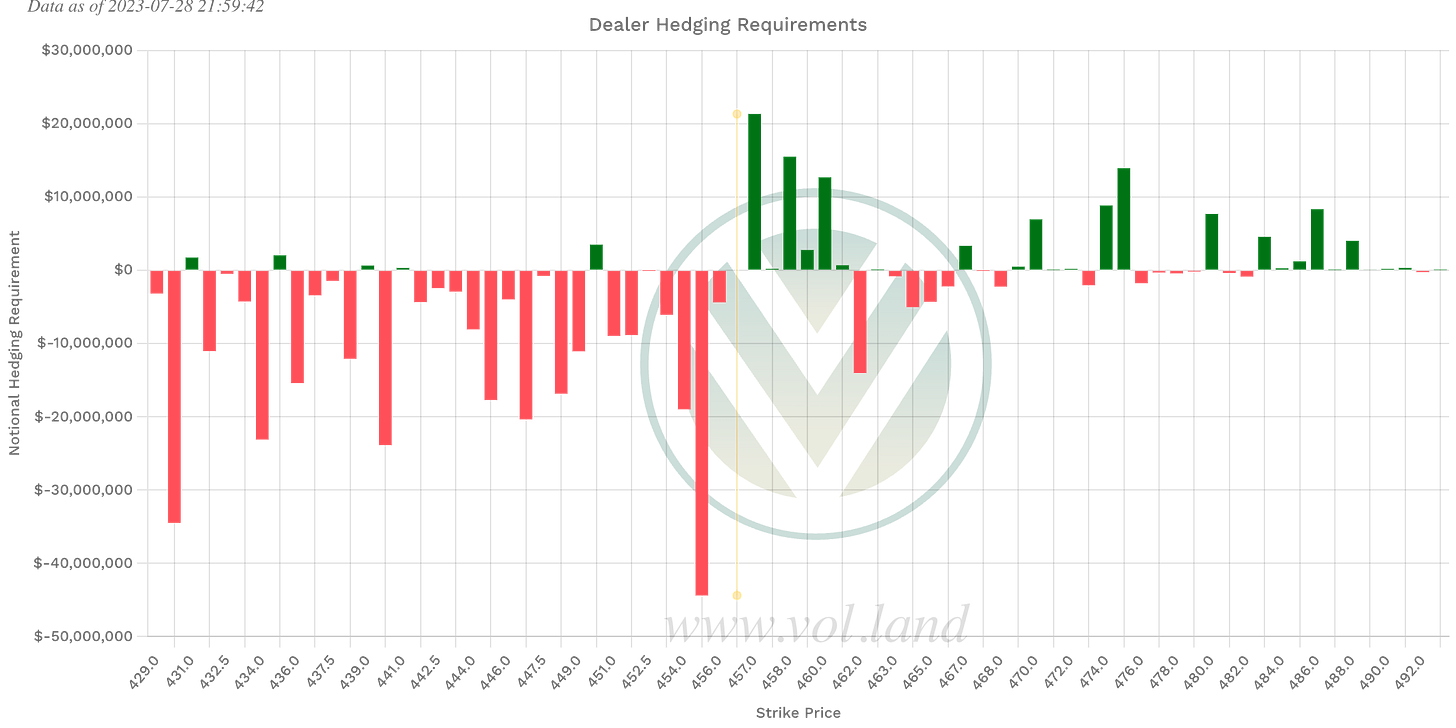
450, 457-461, 467
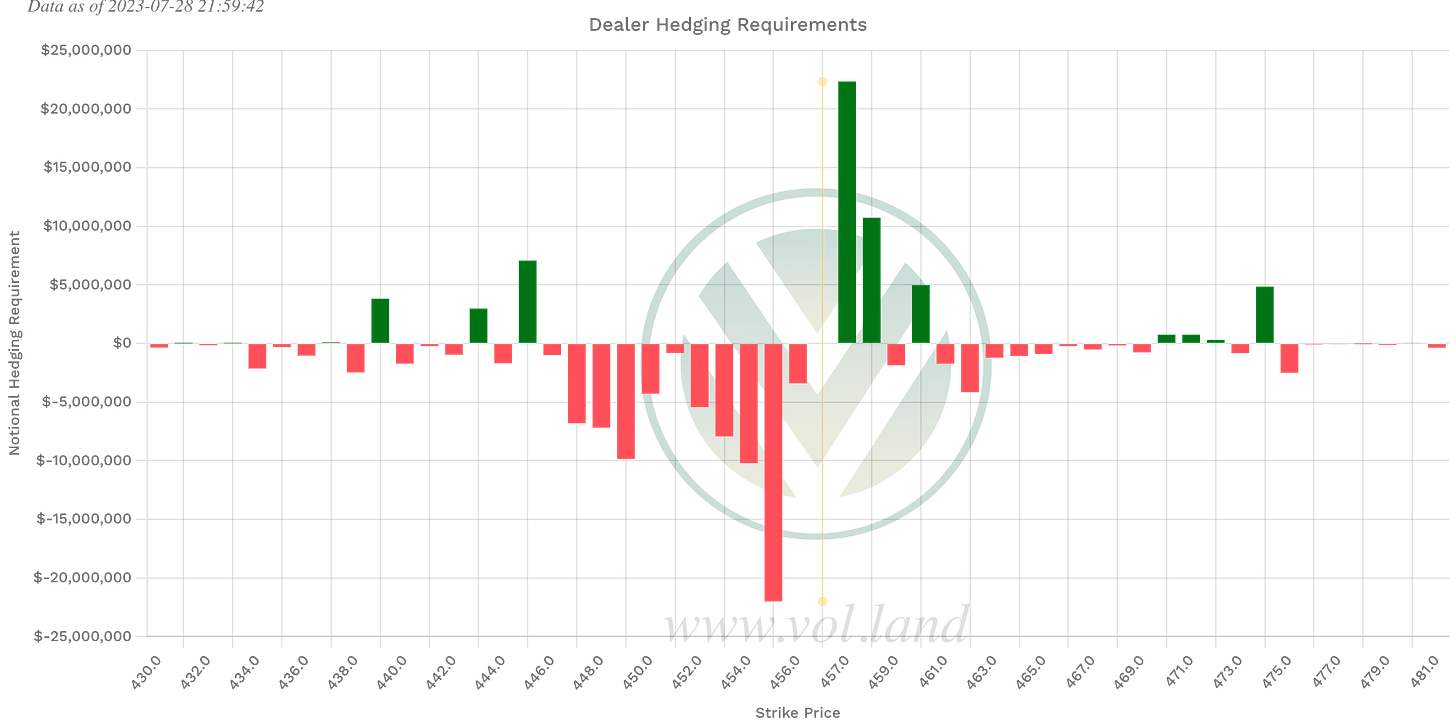
This week
439, 457-460, 467, 470, 475
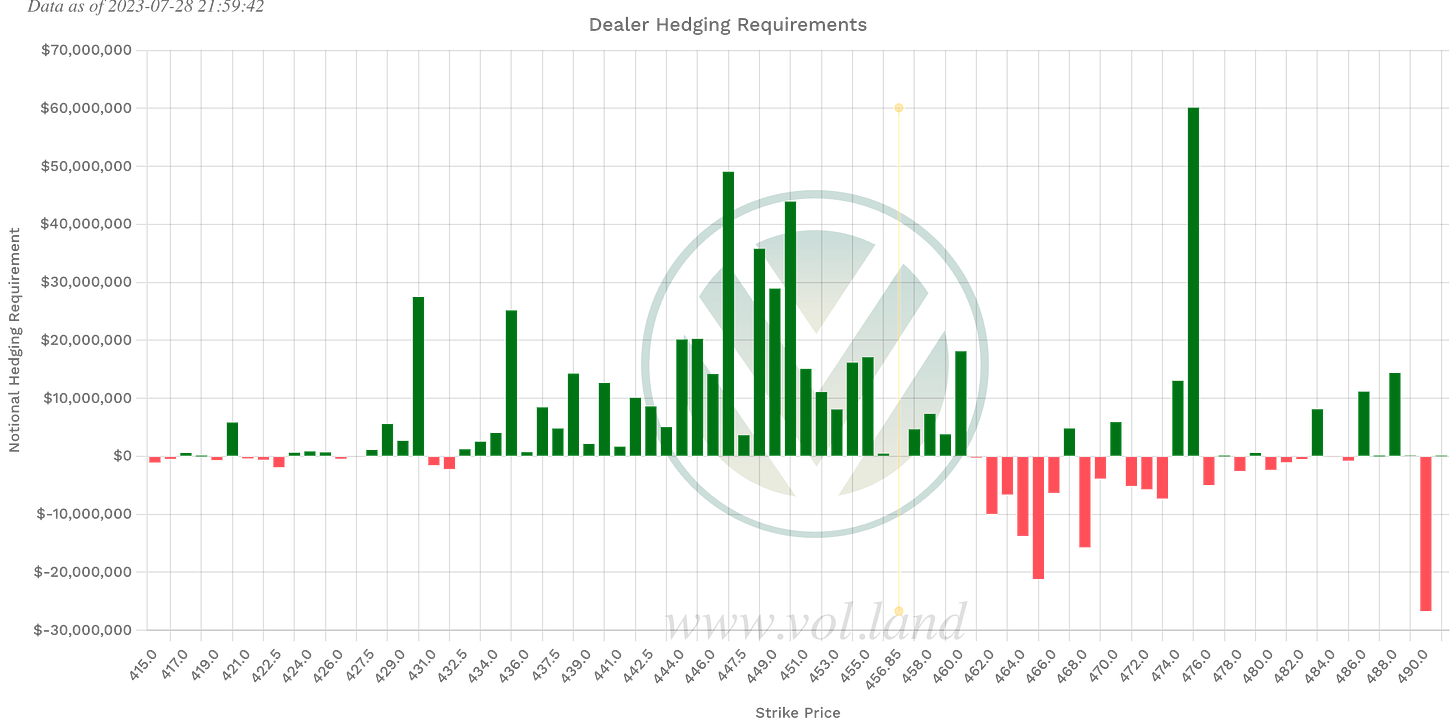
1DTE (tomorrow’s expiration)
439, 443, 445, 457, 458, 460, 470
Negative Vanna
Aggregate
428, 435, 441, 455, 460-466
This week
432, 462+
1DTE (tomorrow’s expiration)
439, 443, 445, 459, 461+
The chart above is what I am watching this week. I want to see a move above 456.84 to target 462.82, or I want to see price moved under 453.76 for a shot at 446 and under. I will use last weeks value area to help guide me in the correct direction.
It could be choppy again if we stay here so keep that in mind, here are some additional levels to keep in mind. It looks busy and that’s because it is. This is how you identify chop. We need an imbalance to find good trading opportunities.
On a side note, I am making a short video series on how I use this information. I will be posting information about them on my Twitter @CaptainWick, if that is something that you might be interested in.
Happy Trading,
—WICK—
To cover our basis…
Welcome to my Substack where I provide a daily SPY trading plan to help guide my intraday trading. The purpose of this letter is not to advise you on your trading or investment decisions. I am simply documenting my daily trading plan for myself to help with planning and execution. These are simply my opinions and the data sourced from the likes of vol.land, TradingView, Quantdata.us and others. The stock market is risky, gains are not guaranteed. This is not about getting rich quick, but learn to educate yourself and make the necessary financial decisions on your own. This is not financial advice.

