Readers,
As you have probably heard NFLX and TSLA, two major players reported after the close. TSLA finished its after hours move with a bid of 279 (closed at 291.26) and NFLX’s current bid is 438 (closed at 477.59). Does this mean we crash? No. There are still many more companies to report. I am in the camp that thinks there needs to be a little bit of a selloff, maybe a retest of 447-444 could be a good spot to reload. But then I look at the volume profile and I think we might have a little more room up before we get that selloff. I am not going to predict, I am going to react and take what the market gives me.
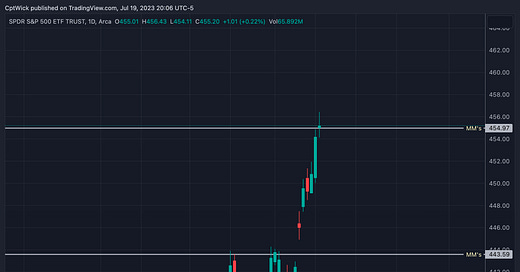
Market Makers (MMs) Weekly Expected Range
Here is an update to the MMs expected weekly move. I will remind you that it is only Wednesday and we have hit this move again. There is another opportunity that the market gets it wrong again and closes outside of this range. Trading is fun isn’t it!
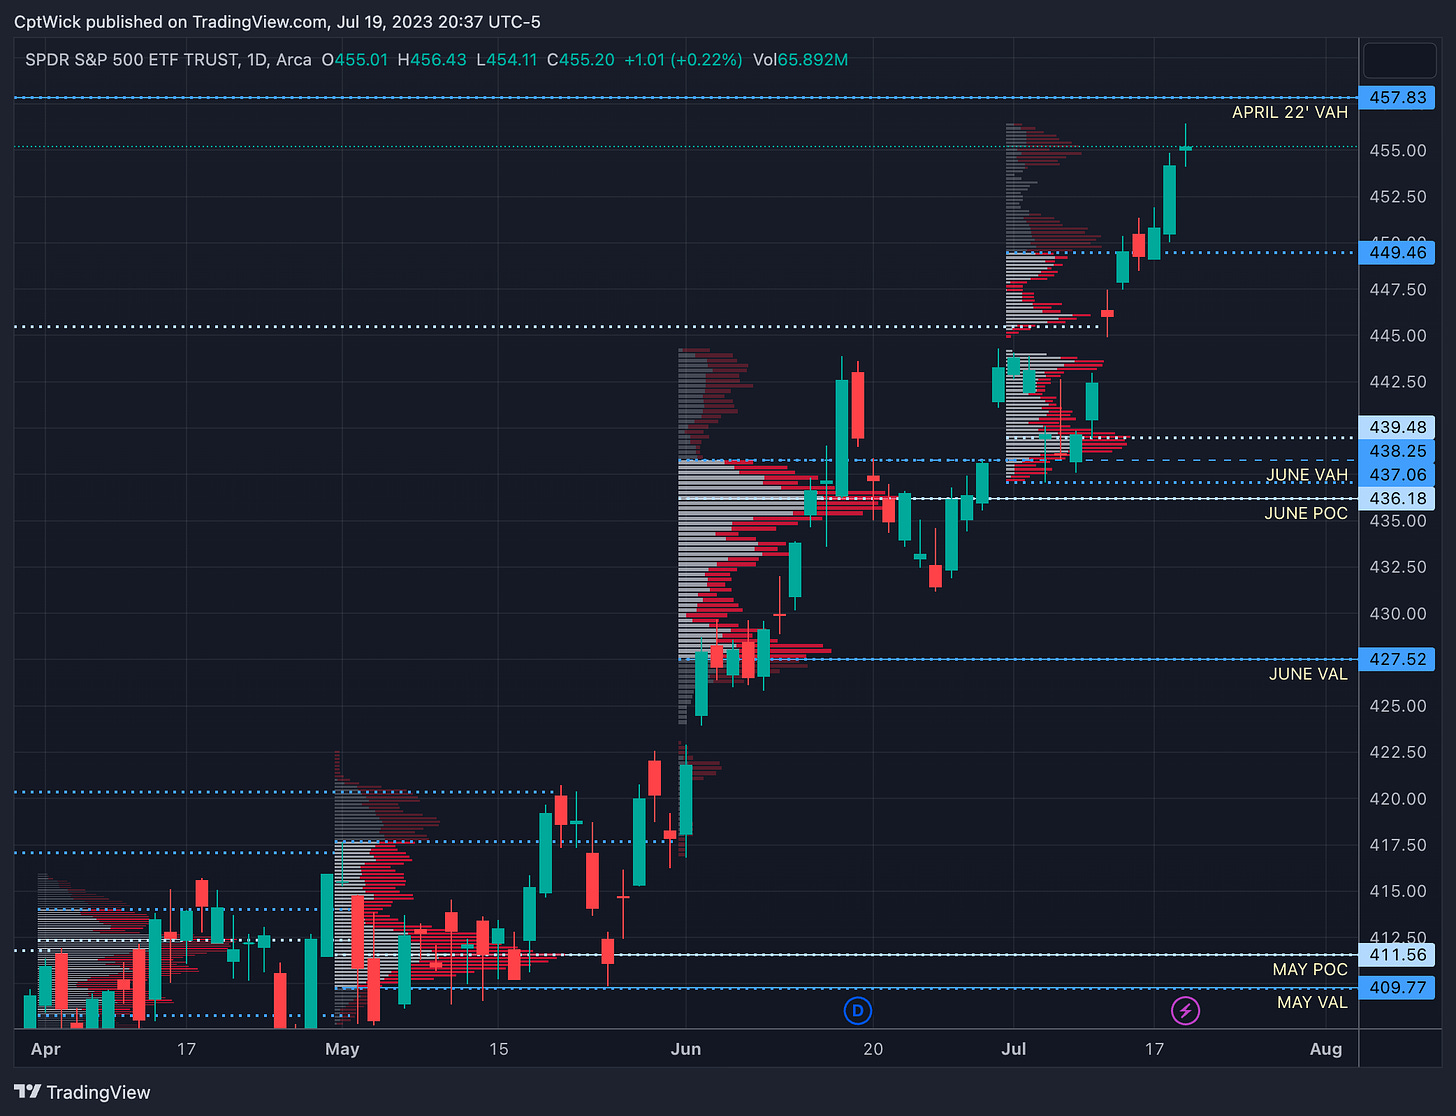
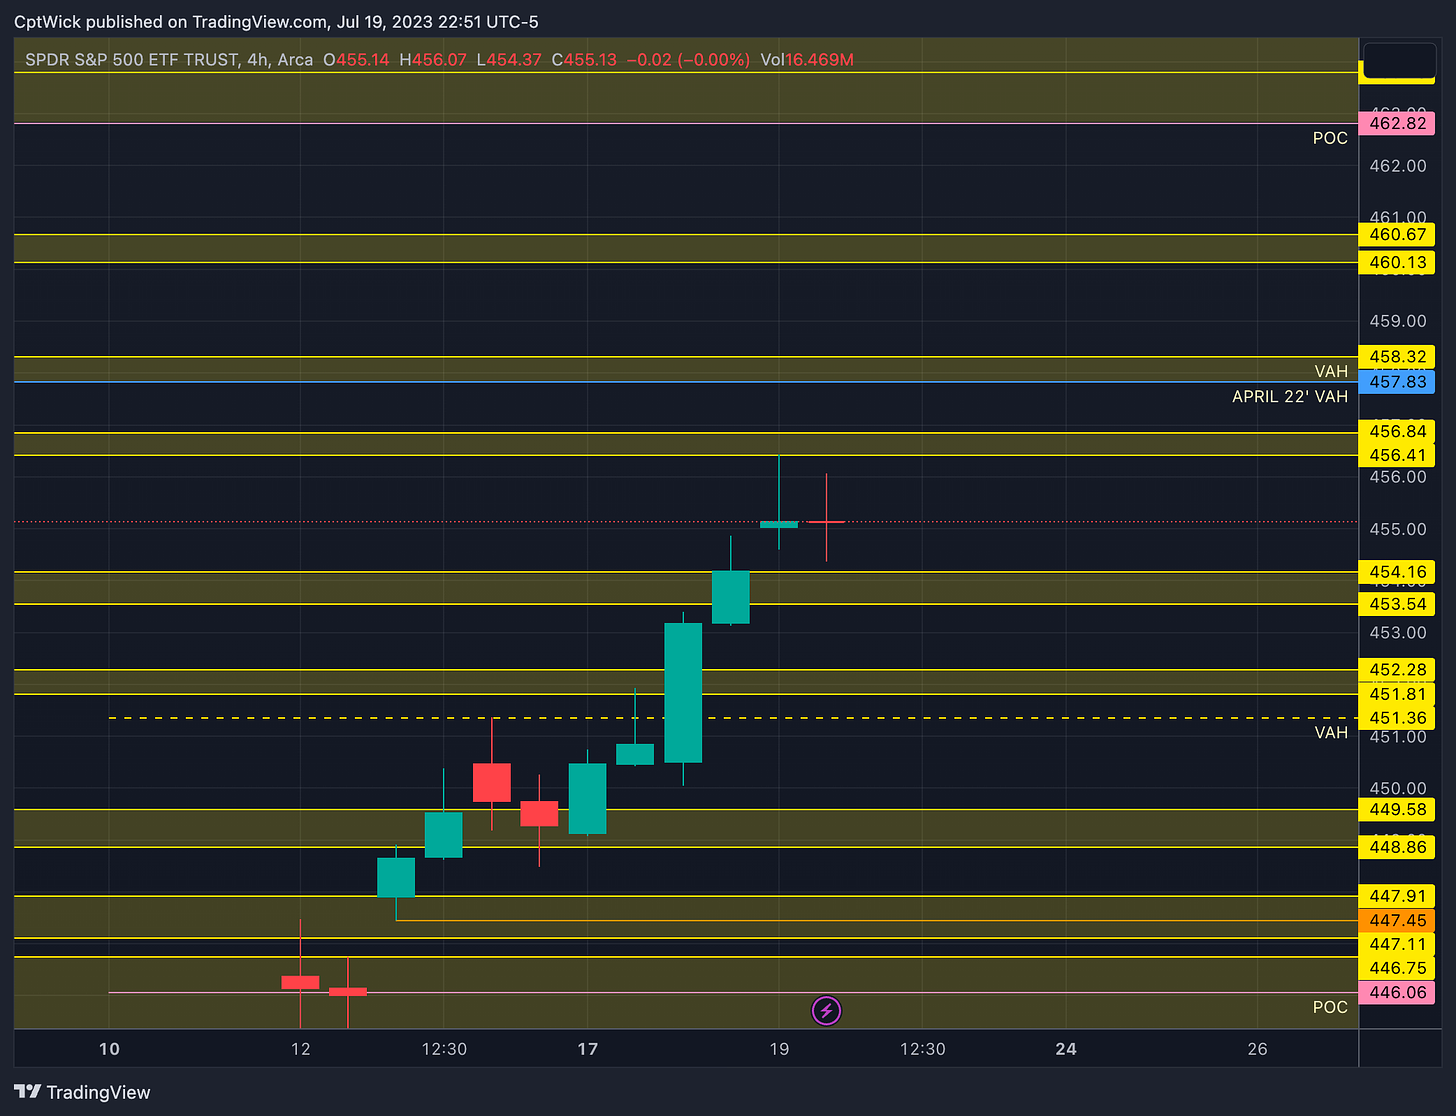
Monthly Volume Profile Levels
Current Value Area
449.46 Value Area High (VAH)
439.48 Point of Control (POC)
437.06 Value Area Low (VAL)
June’s Value Area
438.25 VAH (violated)
436.18 POC
427.52 VAL
Notable Naked Levels
457.83 April 22’ VAH
411.56 May POC
409.77 May VAL
Regarding the monthly profile, a notable observation is the current imbalance to the upside and the profile is “thin”, the VAL and POC have not moved. If you look at the cluster of volume at the current POC you can see that 450-449 could easily be the new POC if price trades there again. Additionally, we are approaching April 22's VAH, representing the last naked value level to the upside according to the monthly profile.
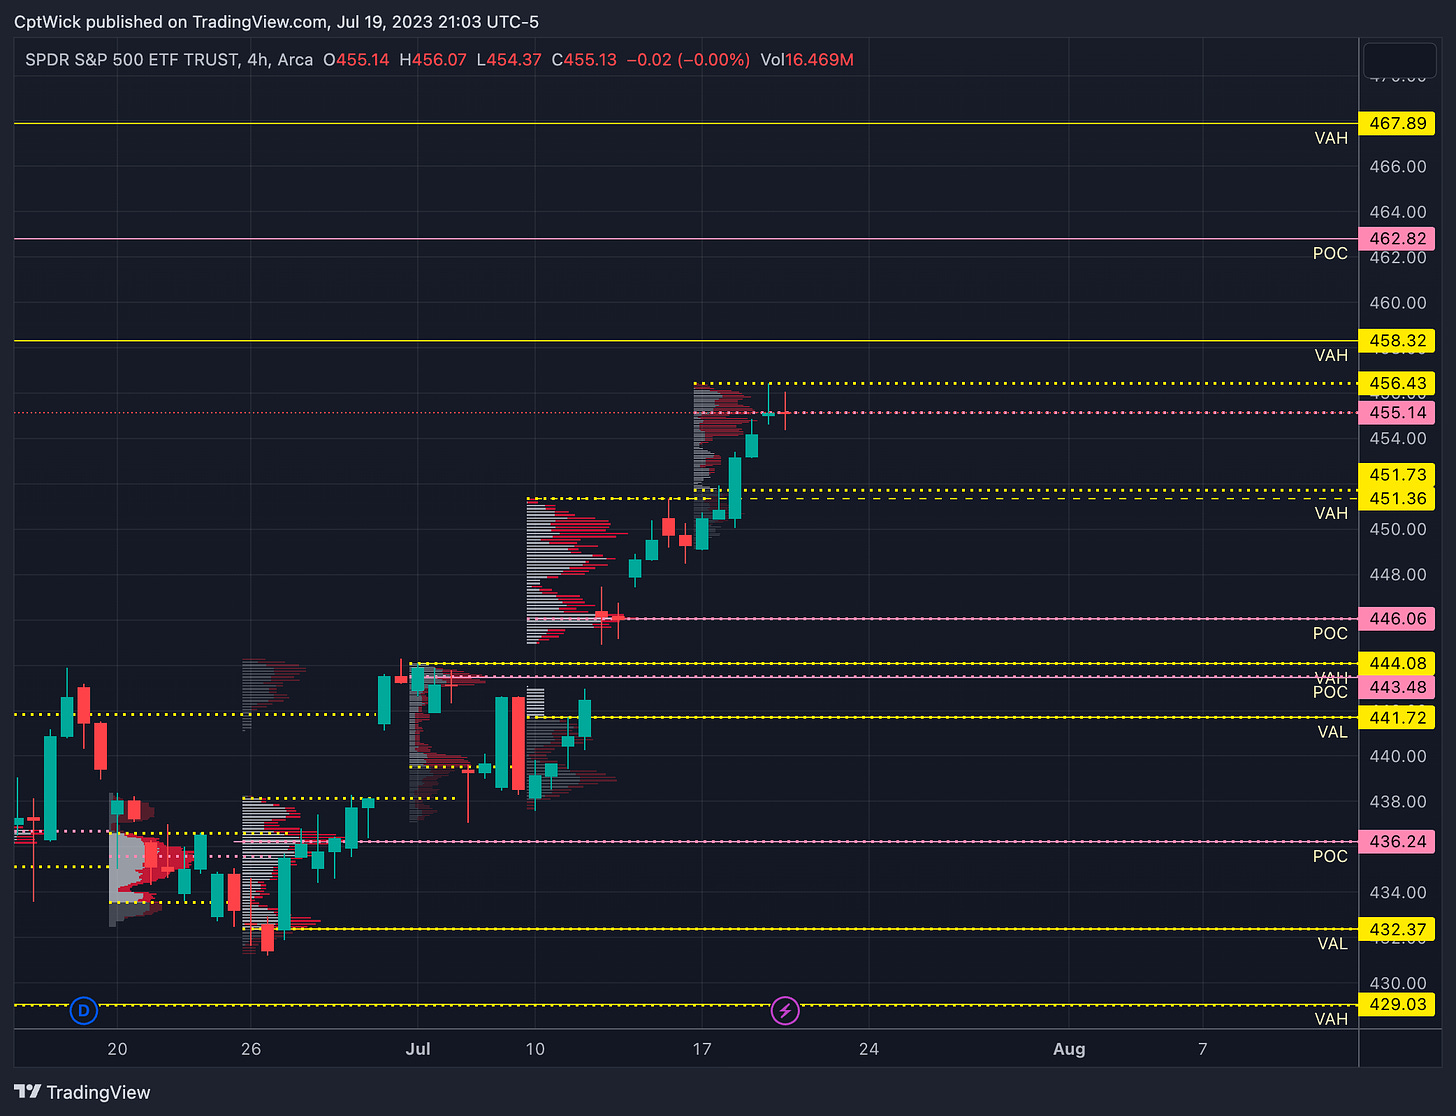
Weekly Volume Profile Levels
Current Levels
456.43 VAH
455.14 POC
451.73 VAL
Last Week's Levels
451.36 VAH (violated)
446.06 POC
441.72 VAL
Notable Naked Levels
444.08 VAH
443.48 POC
436.24 POC
458.32 VAH
462.82 POC
467.89 VAH
We are building value above last weeks value area after breaching it on Tuesday. In the last plan I gave you 451.36 as the key level to break for more upside with a chance of hitting 458.32, I still think that might be the case but we need to be cautious if the market wants to dip for a retest of 446.06.
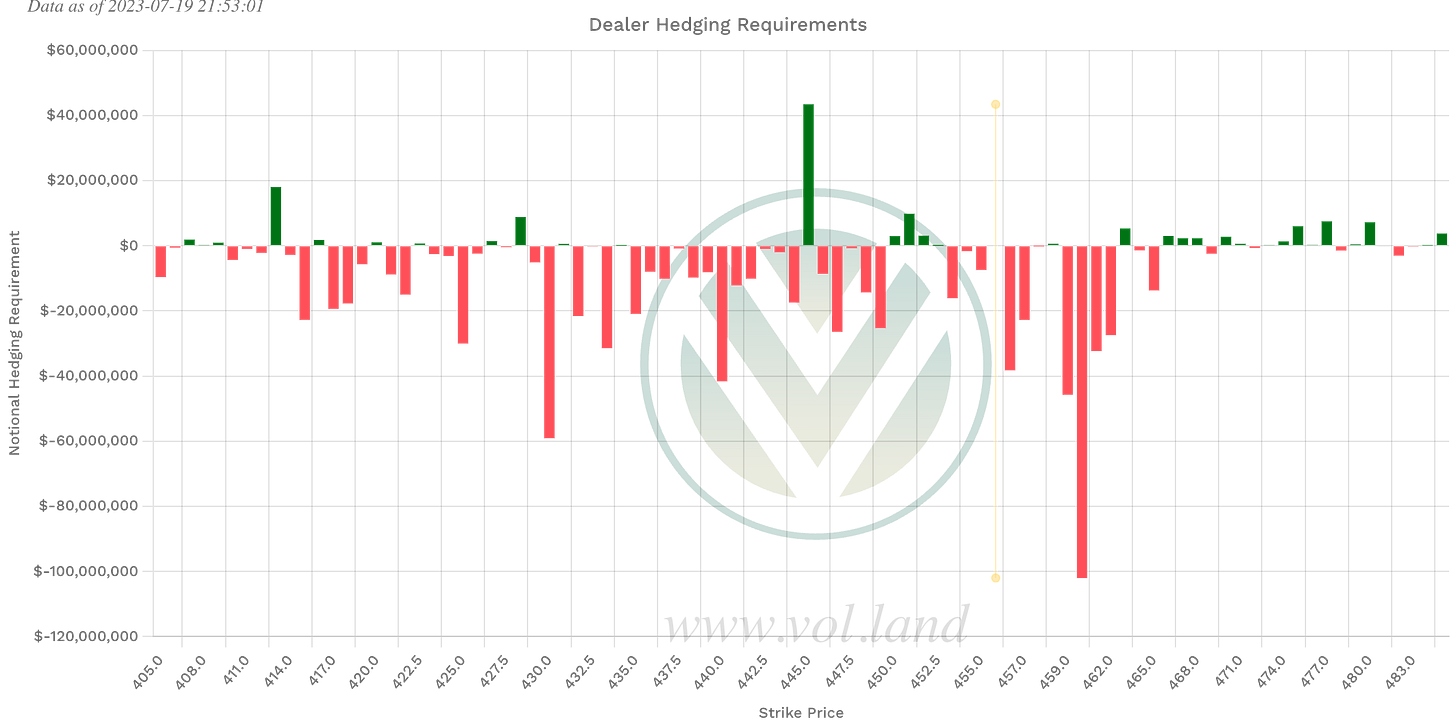
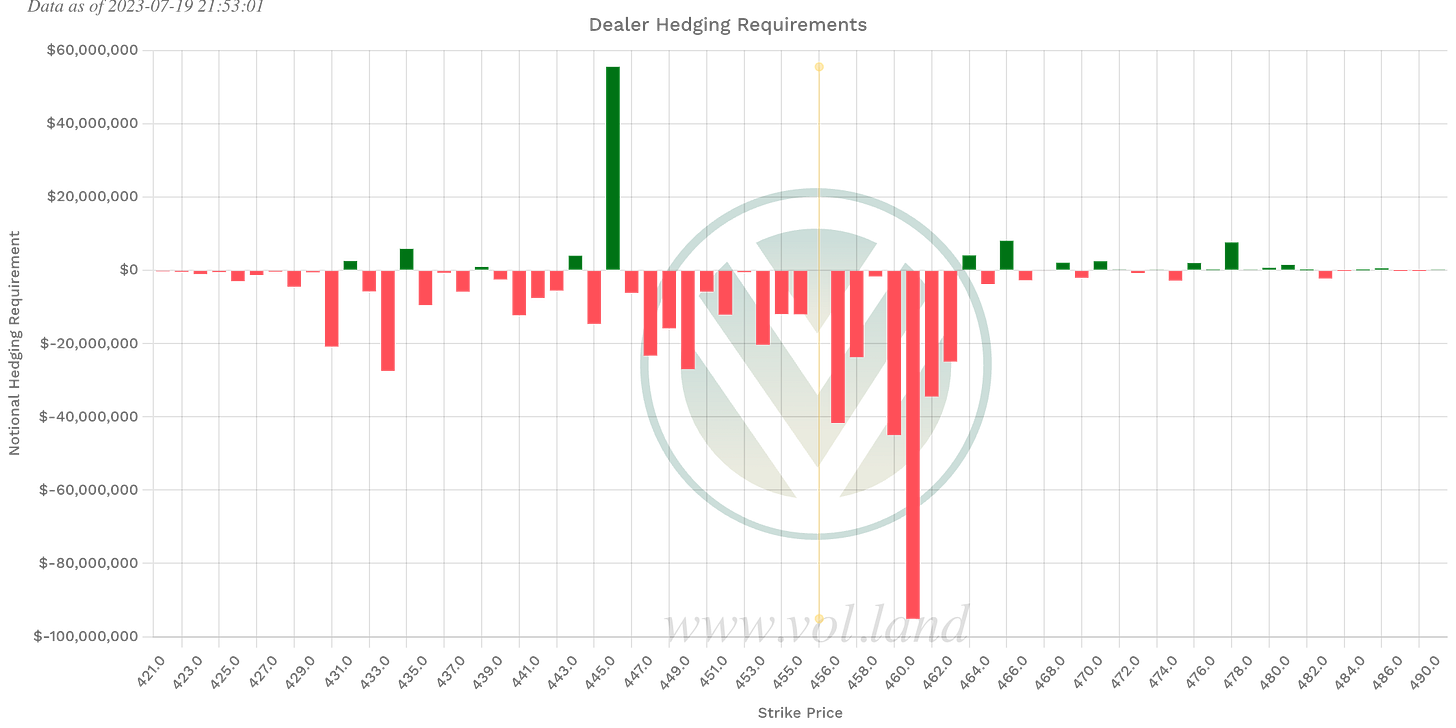
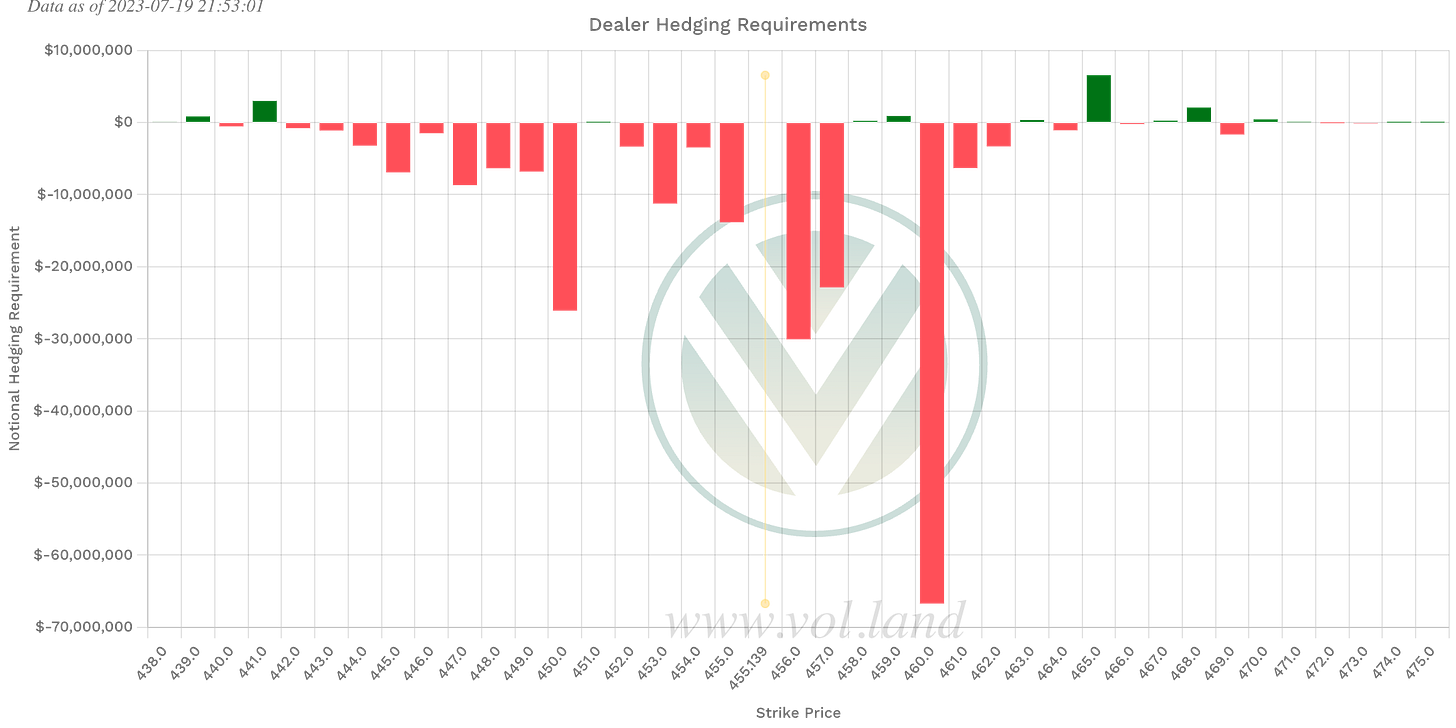
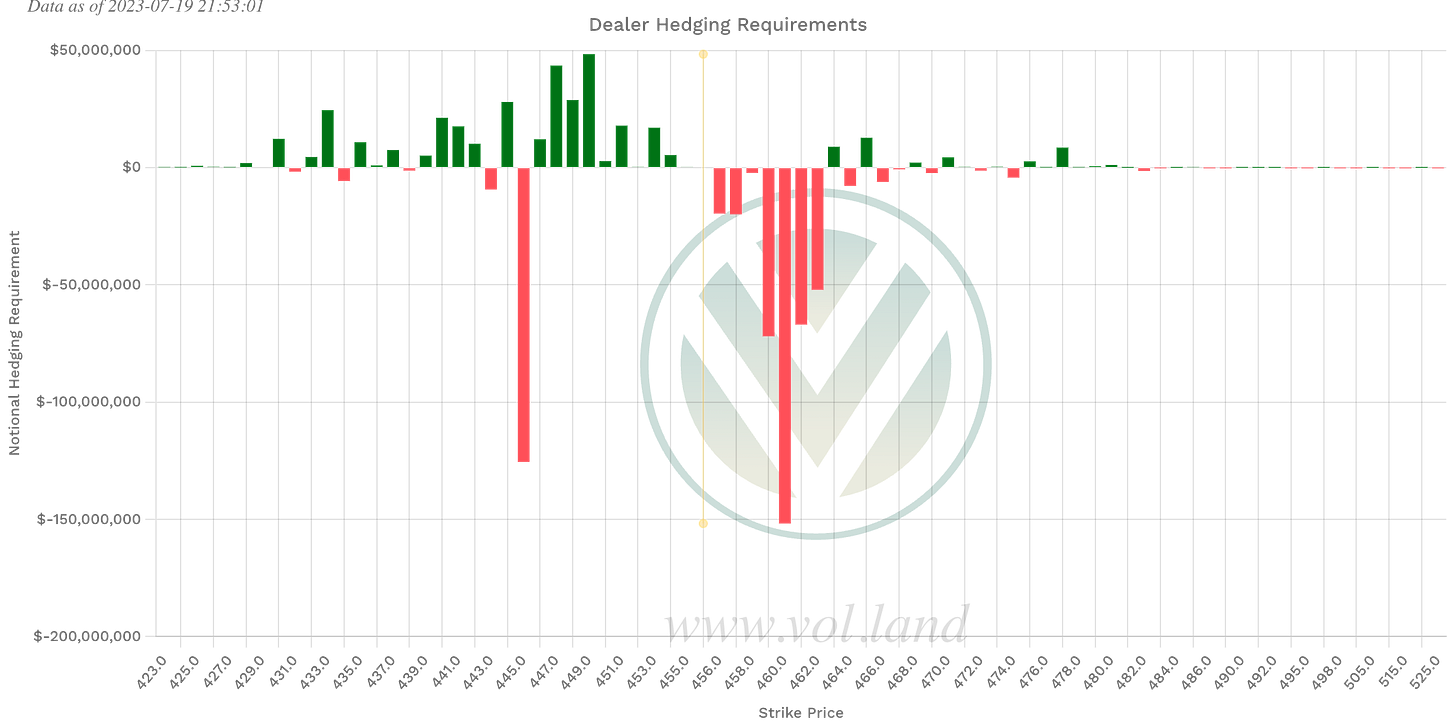
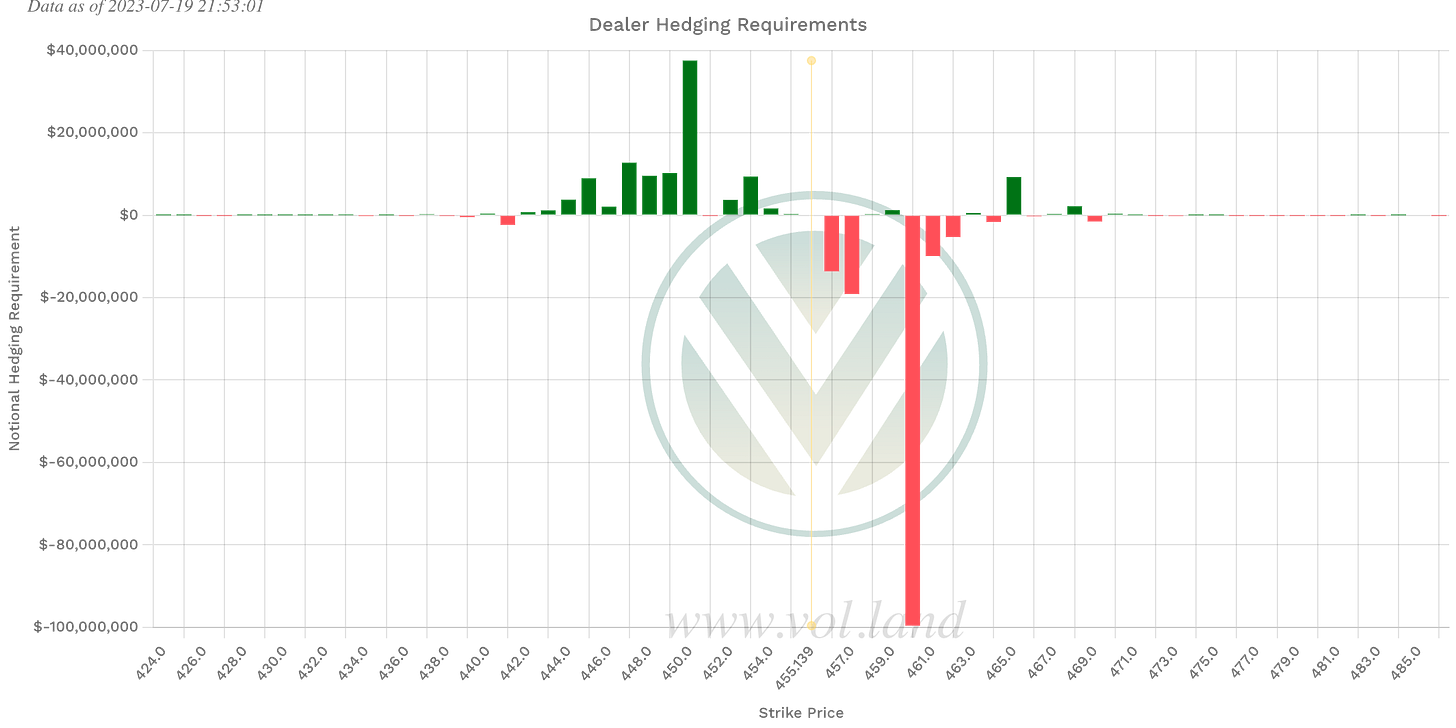
Positive Gamma
Aggregate
428, 445, 450, 451, 452, 463
This week
434, 443, 445, 463
1DTE (tomorrow’s expiration)
441, 459, 465
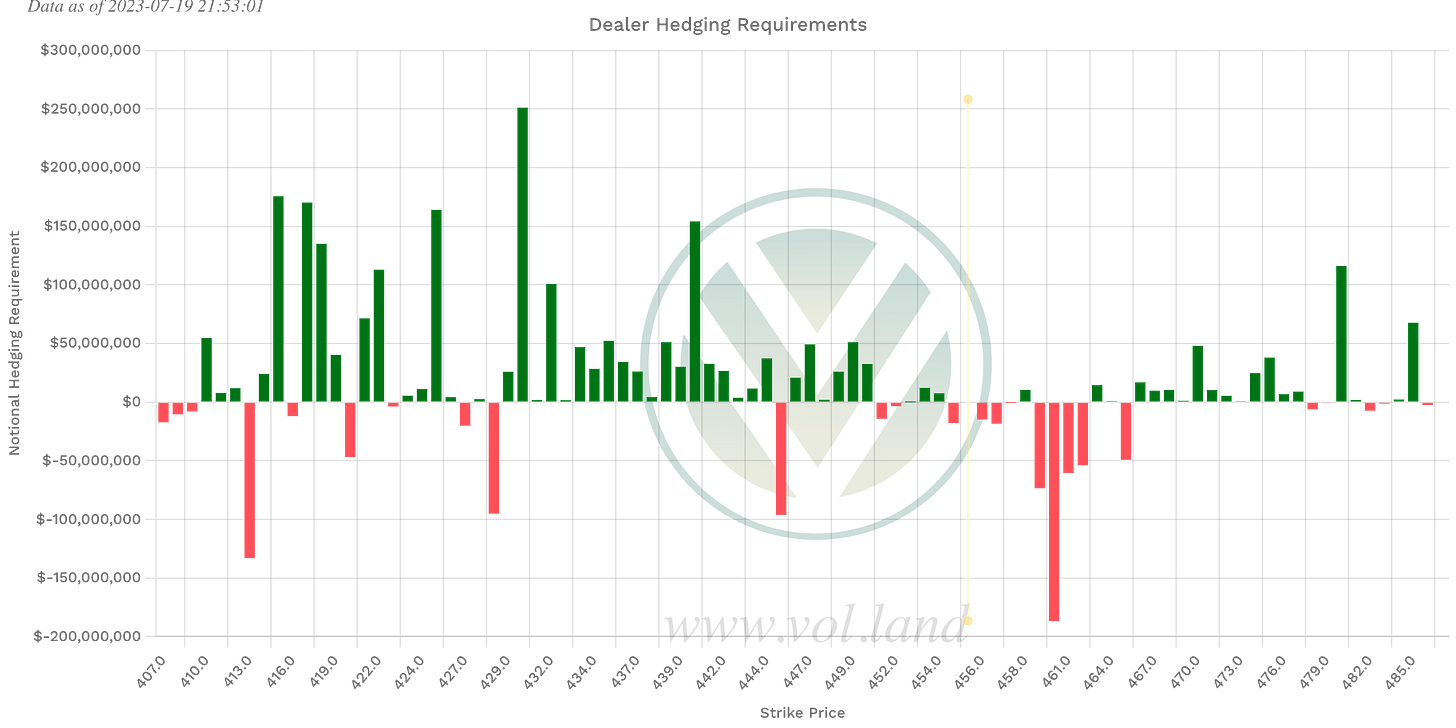
Negative Vanna
Aggregate
428, 445, 451, 455, 456, 457, 459-462
This week
443-445, 456-462
1DTE (tomorrow’s expiration)
441, 456, 457, 460-462
Levels
Happy Trading,
—WICK—
To cover our basis…
Welcome to my Substack where I provide a daily SPY trading plan to help guide my intraday trading. The purpose of this letter is not to advise you on your trading or investment decisions. I am simply documenting my daily trading plan for myself to help with planning and execution. These are simply my opinions and the data sourced from the likes of vol.land, TradingView, Quantdata.us and others. The stock market is risky, gains are not guaranteed. This is not about getting rich quick, but learn to educate yourself and make the necessary financial decisions on your own. This is not financial advice.

