7/17 SPY Trade Plan
ER season is upon us!
Readers,
The resilience of the bulls in keeping the price elevated is truly impressive. It's incredible to think that we're inching closer to the realm of all-time highs. To be honest, I didn't anticipate this happening so soon. The market is a complex beast and we need to use the tools at our disposal to help us make educated trading decisions. Lets jump in!
Market Makers (MMs) Weekly Expected Range
The MMs are expecting a weekly move in SPY of 5.69 this week. If you have noticed, the market has been closing outside of this range for the past few weeks, which means the market has been getting it wrong.
454.97 High
443.59 Low
Monthly Volume Profile Levels
Current Value Area
445.78 Value Area High (VAH)
439.56 Point of Control (POC)
437.06 Value Area Low (VAL)
June’s Value Area
438.25 VAH (breached)
436.18 POC
427.52 VAL
Notable Naked Levels
457.83 April 22’ VAH
411.56 May POC
409.77 May VAL
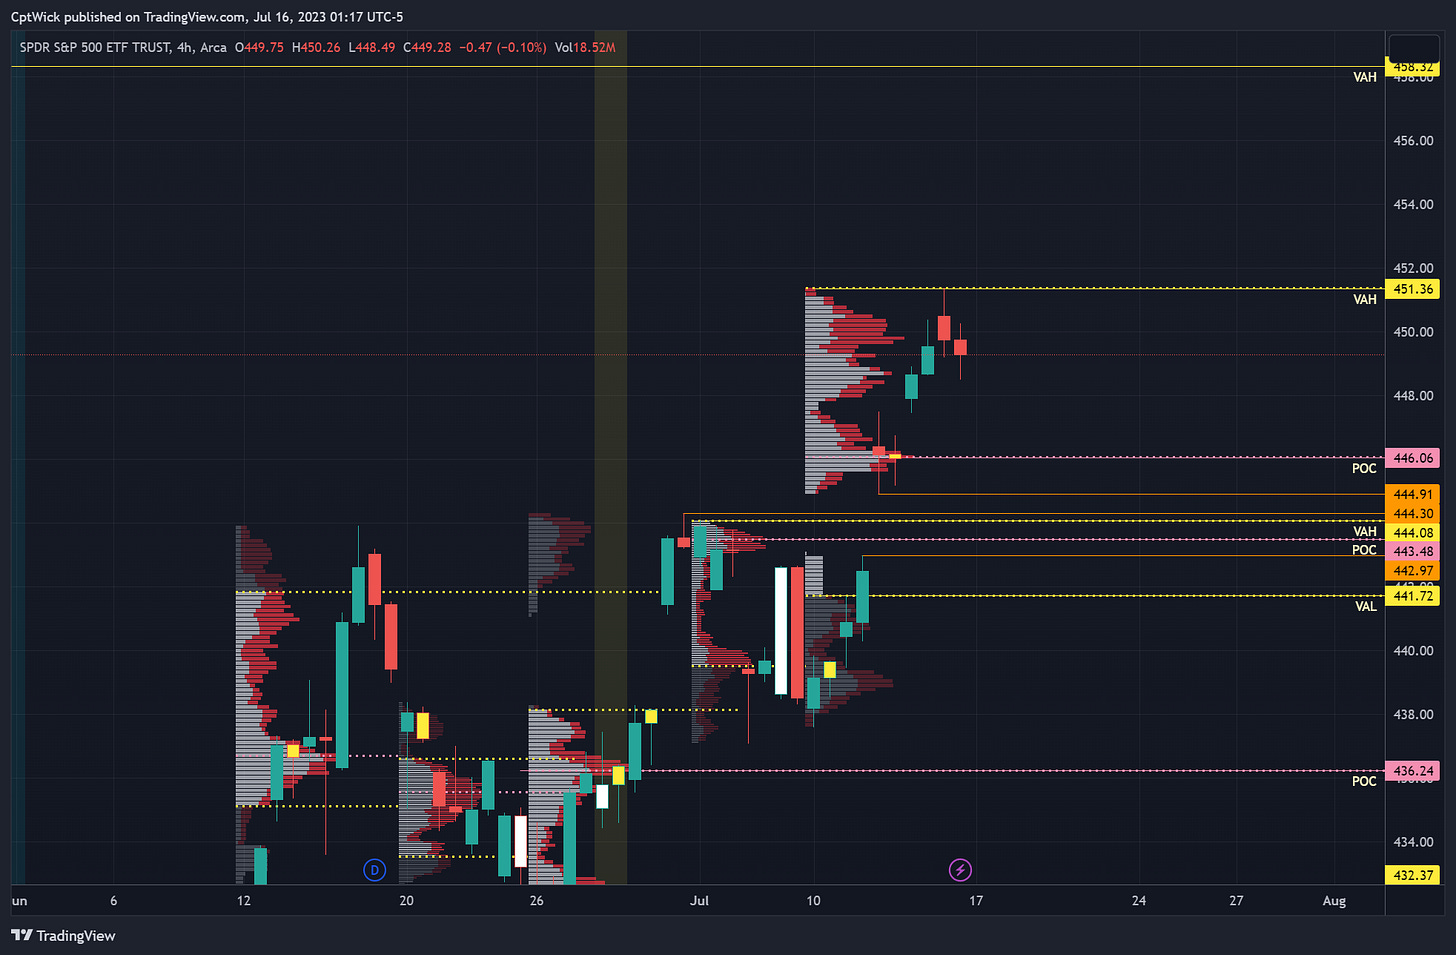
When looking at the monthly profile, it becomes apparent that we are currently experiencing an upside imbalance. The price is currently trading above the Point of Control (POC) from April 22, which resides around 445.50, along with this month's current Value Area High (VAH). This becomes a significant area of interest. Notably, the April 22 VAH at 457.83 represents the last naked value level to the upside. Surpassing this price level would unlock the gateway to all-time highs (ATH) and new realms of price discovery. Anticipating such a scenario, it is highly likely that as we approach and potentially surpass this level, a process of rebalancing will unfold, ultimately establishing new areas of value within the ATH vicinity.
The range of 445-443 is highly significant and captures considerable attention. A break below the volume gap could lead to a potential test of the 439.50-436 range, presenting an opportunity for the bears to seize momentum and explore further downside prospects. If this area trades and it is defended by the bulls, it could make for a good opportunity to long calls.
Weekly Volume Profile Levels
Last Week's Levels
451.36 VAH
446.06 POC
441.72 VAL
Notable Naked Levels
444.08 VAH
443.48 POC
436.24 POC
458.32 VAH
462.82 POC
Looking at the weekly profile, we should note that we ended the week inside of the weekly value area (this is opposite from the monthly profile, and this is also why we need to use these profiles on multiple timeframes to help us make a more informed decision). The key focus now lies on the bulls' pursuit of breaking the 451.36 level, while the bears are determined to defend it. Also, there exists a notable gap in volume where two weekly profiles overlap, indicating its significance. It is my belief that this gap is likely to be revisited in the near future, ultimately determining the direction in which we are headed. This particular gap (represented by the orange levels) is the closest to the spot price that remains unfilled. It stands out among the various gaps to the upside, including those leading to all-time highs, as they have all been closed. Logically, it appears probable that this gap will be filled within the current week, considering the multitude of levels of interest residing in its vicinity. The question remains: Will the price rally out of the gap, or will the bears regain control? The answer lies ahead, and we shall remain prepared for whatever unfolds.
Positive Gamma
Aggregate
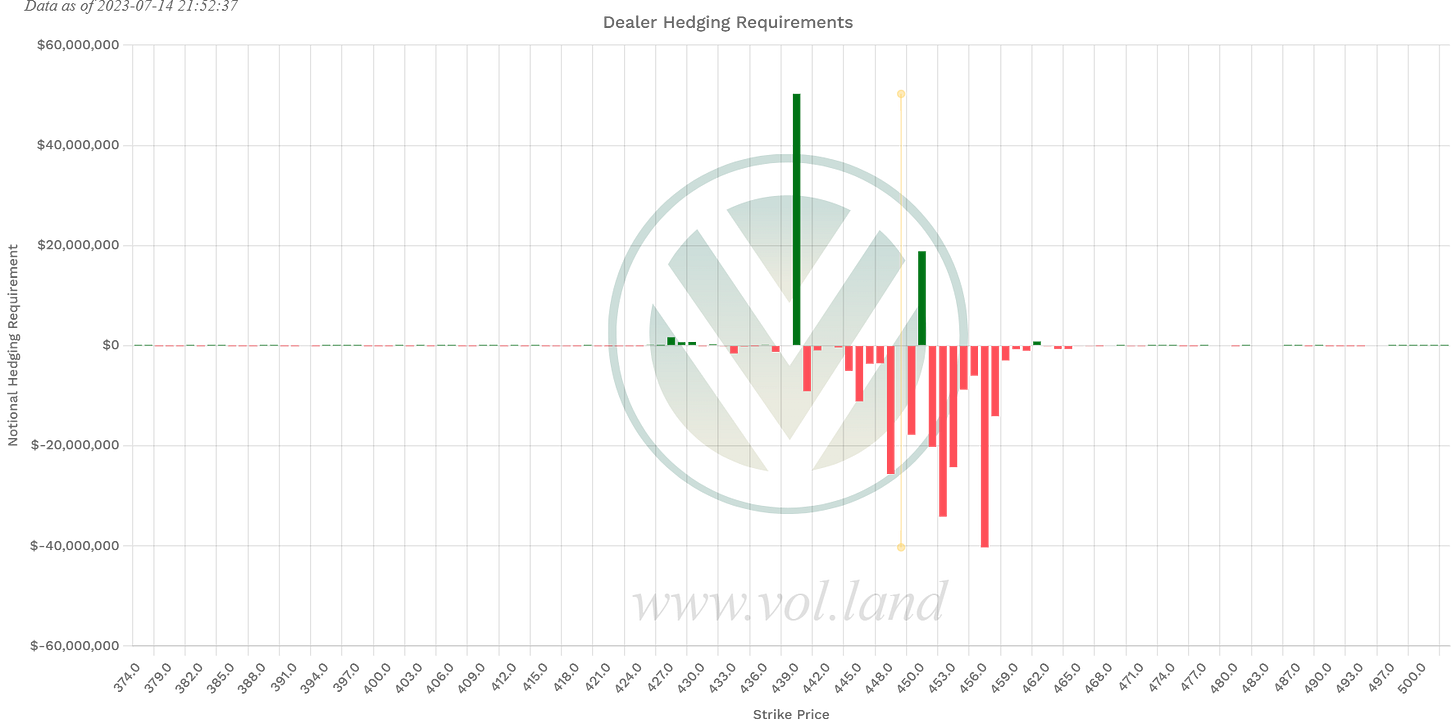
439, 444, 445, 450
This week
431, 434, 439, 443-445, 450
1DTE (tomorrow’s expiration)
439, 450
If you are new here, or if you need a refresher: Positive Gamma above spot should act as resistance, and Positive Gamma below spot should act as support. Does it always work 100% of the time? No, but when we couple it with the volume profile if can help us determine what price is going to do at those levels. Negative Gamma is permissive, price can pass through freely.
Negative Vanna
Aggregate
431, 439, 444, 445, 452+
This week
431, 434, 439, 443-445, 449, 451+
1DTE (tomorrow’s expiration)
439, 449, 451+
If you are new here, or if you need a refresher: Negative Vanna above spot should act as a repellent or resistance and below spot price it should act as support, assuming implied volatility (IV) is acting in accordance with its spot-vol correlation - meaning that if spot price is going up and we are coming into a Negative Vanna level and IV stays the same or increases it should act as resistance. If IV decreases there is a chance we can push through that Negative Vanna. On the flip side, if spot price is falling into a Negative Vanna level and IV stays the same or decreases it should act as support. If IV increases there is a chance we push under that Negative Vanna. Again, we use this data in relationship to the volume profile in order to make a smart decision on where the market is headed.
Key Levels Above - (previous close 449.28)
Key Levels Below - (previous close 449.28)
Final Thoughts
At the start of the week, our primary focus should be on how the price reacts to last week's value area. Key information to consider is that the Value Area High (VAH) from last week stands at 451.36, and we closed the week at 449.28, indicating a balanced state. Under these levels opens to door to test the waters at 446-444. Additionally, it's crucial to note that the 450 level has the most Gamma exposure, while levels above 451 exhibit Negative Vanna. As a result, caution is warranted when considering long call positions. However, if the bulls manage to push above 451.36, it could potentially unlock further upside towards the 458 level, subject to IV conditions.
Another critical area that demands attention is the range of 445-443. This zone harbors multiple factors of significance. We observe the presence of Negative Vanna and Positive Gamma, alongside the market makers' weekly expected downside target at 443.59. There is a gap fill potential starting at 444.91, coupled with the naked weekly value area. This confluence presents an enticing opportunity for both sides of the market. If this area holds as support, it may serve as a favorable entry point for long call positions. If it transforms into resistance, it could pave the way for potential long put plays. Monitoring price action in relation to these levels will be crucial in determining the optimal trading strategy.
Happy Trading,
—WICK—
To cover our basis…
Welcome to my Substack where I provide a daily SPY trading plan to help guide my intraday trading. The purpose of this letter is not to advise you on your trading or investment decisions. I am simply documenting my daily trading plan for myself to help with planning and execution. These are simply my opinions and the data sourced from the likes of vol.land, TradingView, Quantdata.us and others. The stock market is risky, gains are not guaranteed. This is not about getting rich quick, but learn to educate yourself and make the necessary financial decisions on your own. This is not financial advice.


