Readers,
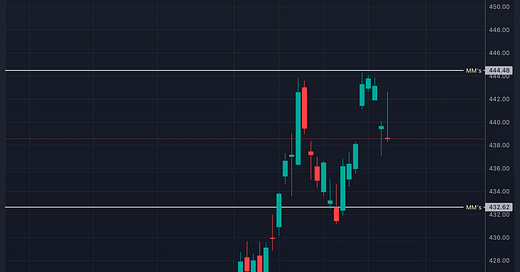
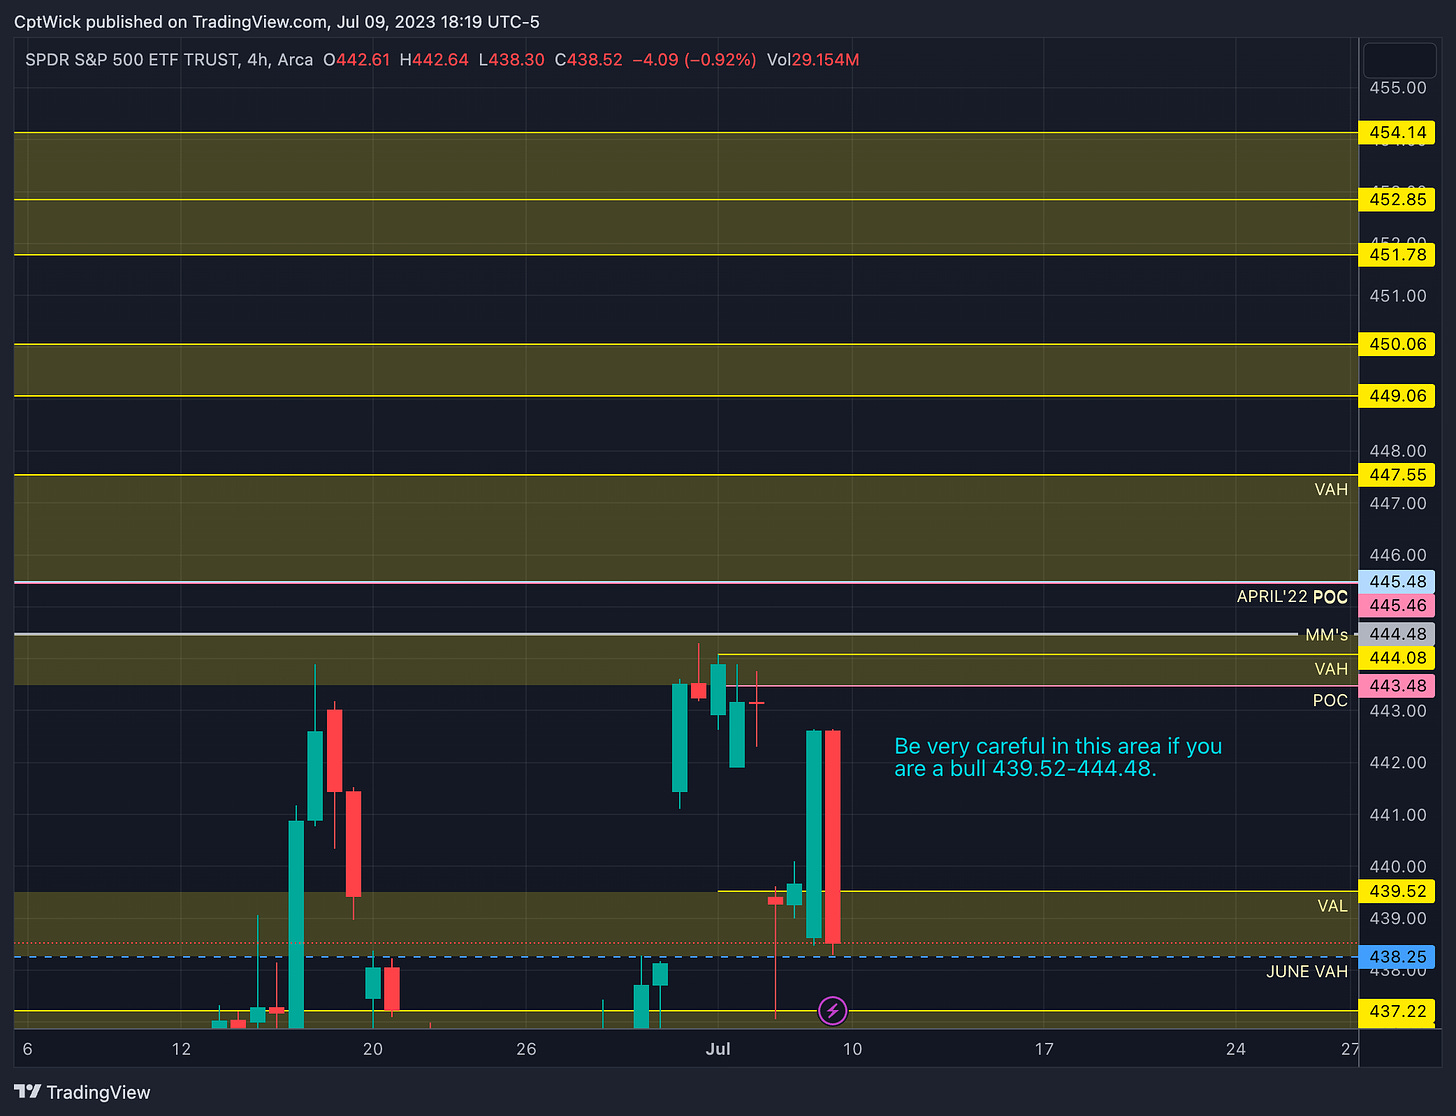
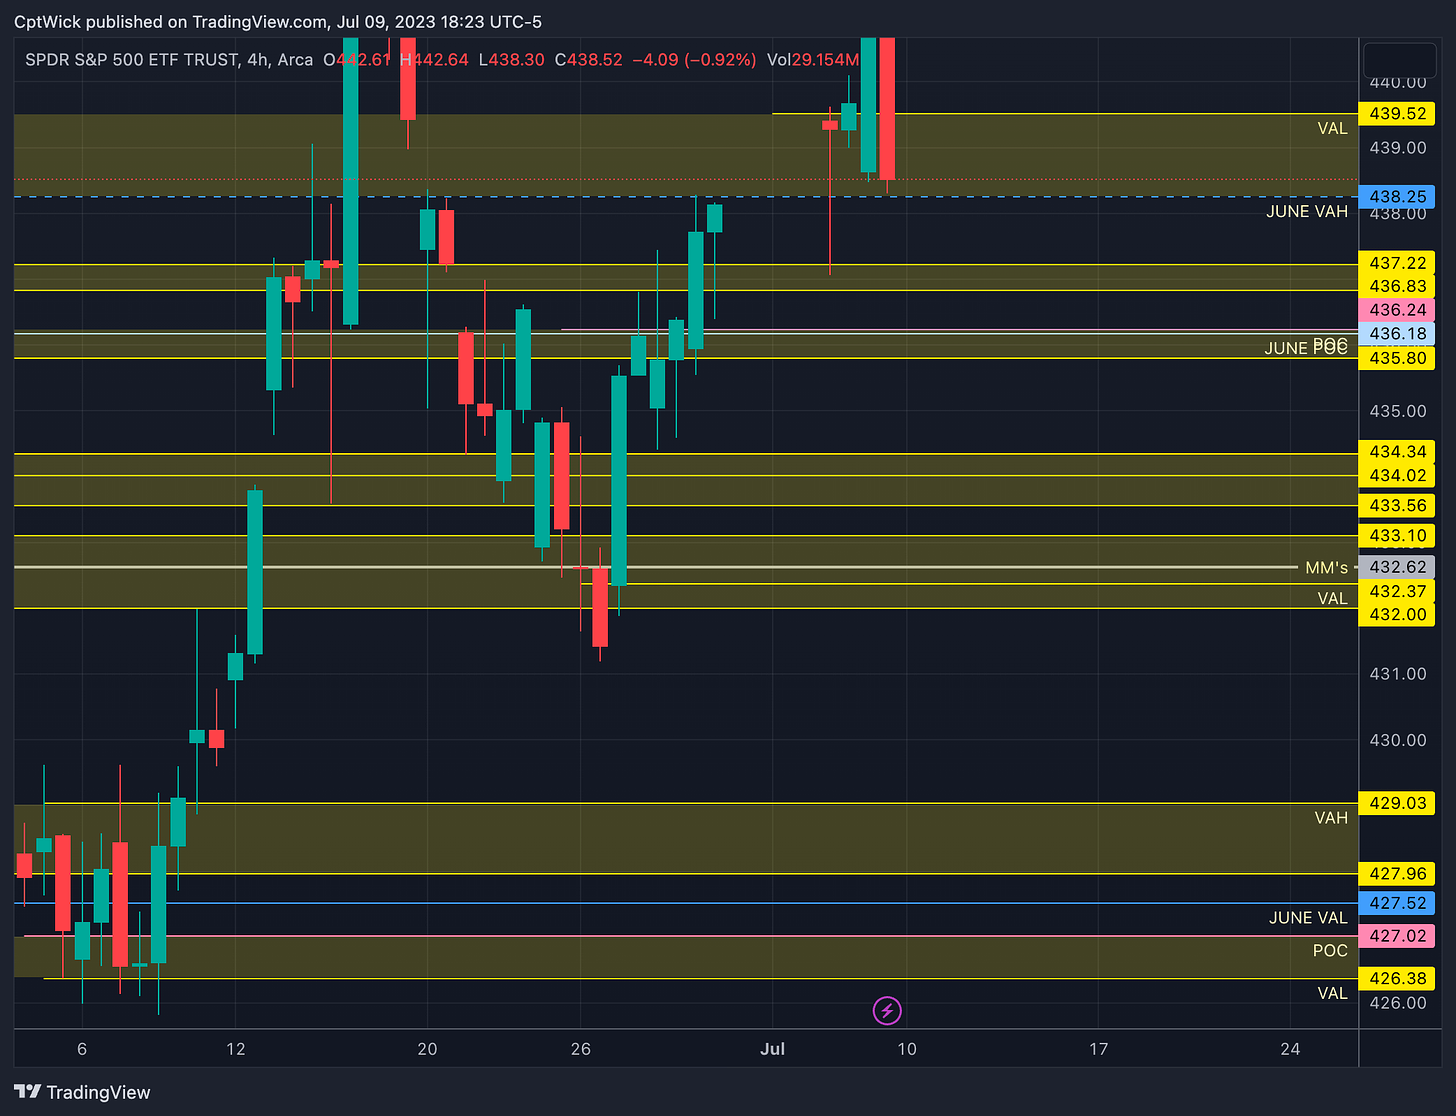
Apologies for not posting last week. I hope everyone had a wonderful time with their family and friends during the holiday. Now, let's dive back into the trading routine and concentrate on identifying promising trade entries. To kickstart our analysis, let's first determine the Market Makers' expected move for the week ahead. They are expecting a move of $5.93, giving us an upper range of 444.48 and a lower range of 432.62.
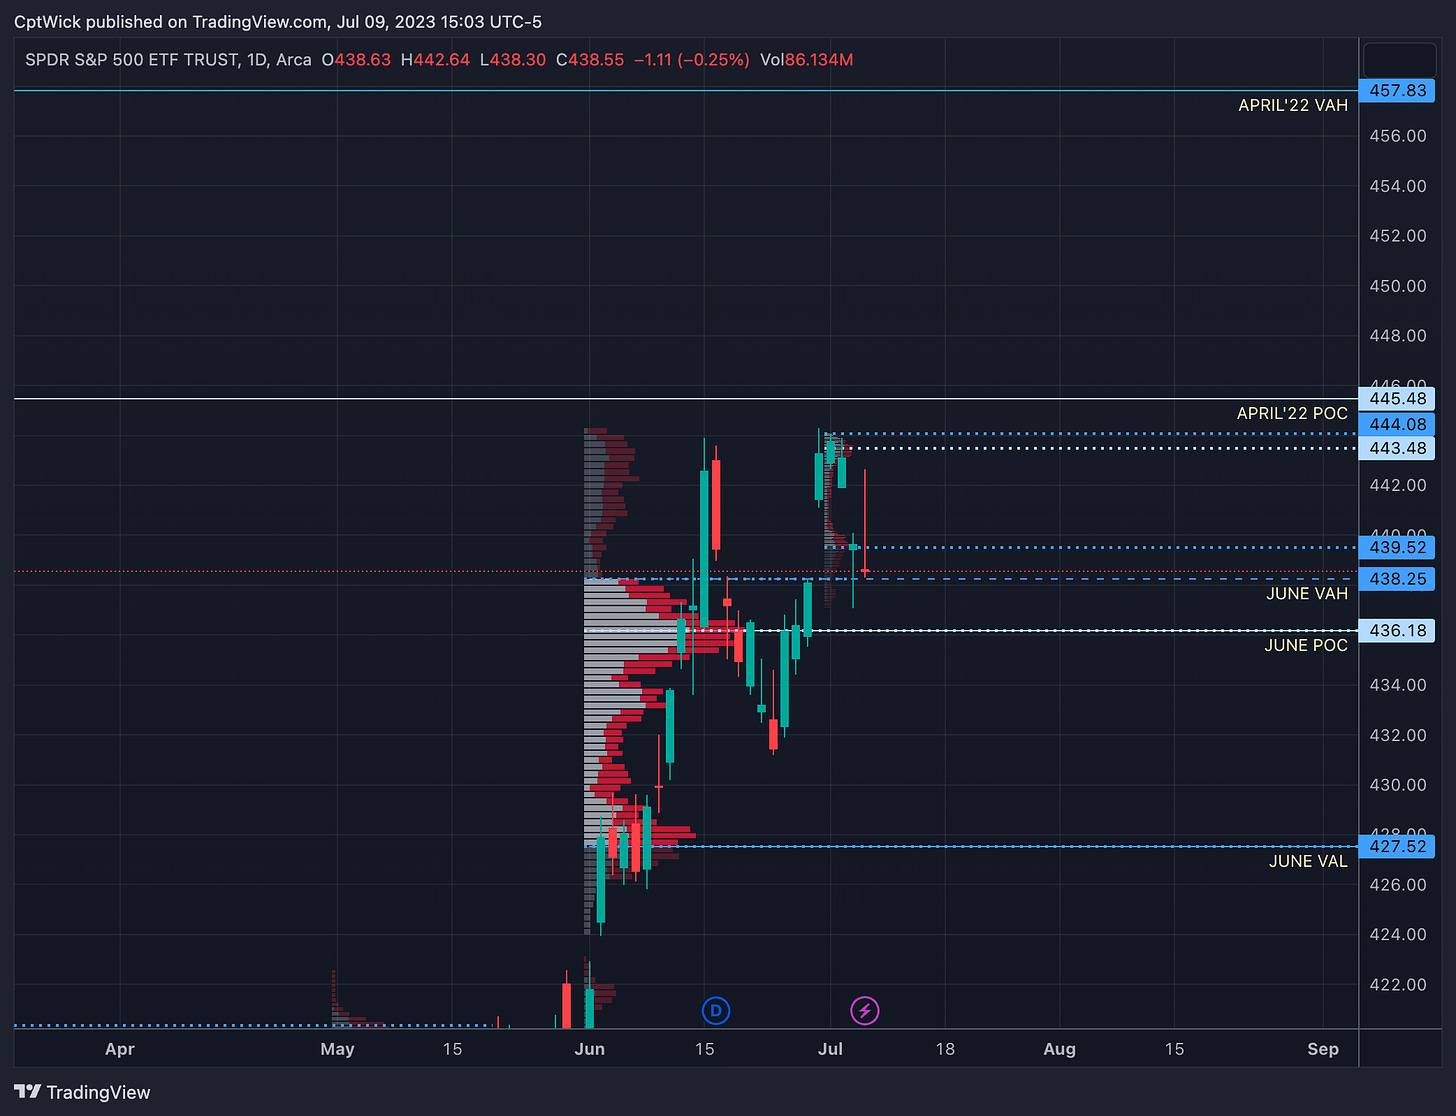
Is this a double top? Or do we breakout above 445? Let's analyze this further by looking at the volume profile’s.
On Thursday, the price retraced and tested the value area high from June's profile at 438.25. It experienced a rally afterward. However, on Friday, the price closed outside of July's current profile, leaving us in a situation where we are now stuck between the two value areas. To capitalize on this scenario, our focus should be on positioning ourselves correctly to capture the potential move, whether it be an upward or downward movement. The goal is to be on the right side of the market, ready to take advantage of the upcoming price action. The volume from 440 to 443 is pretty thin, so if we were to trade there again I would either expect price to come into this zone again and fail, or for it to get accepted and we finally see that naked monthly POC at 445.48+
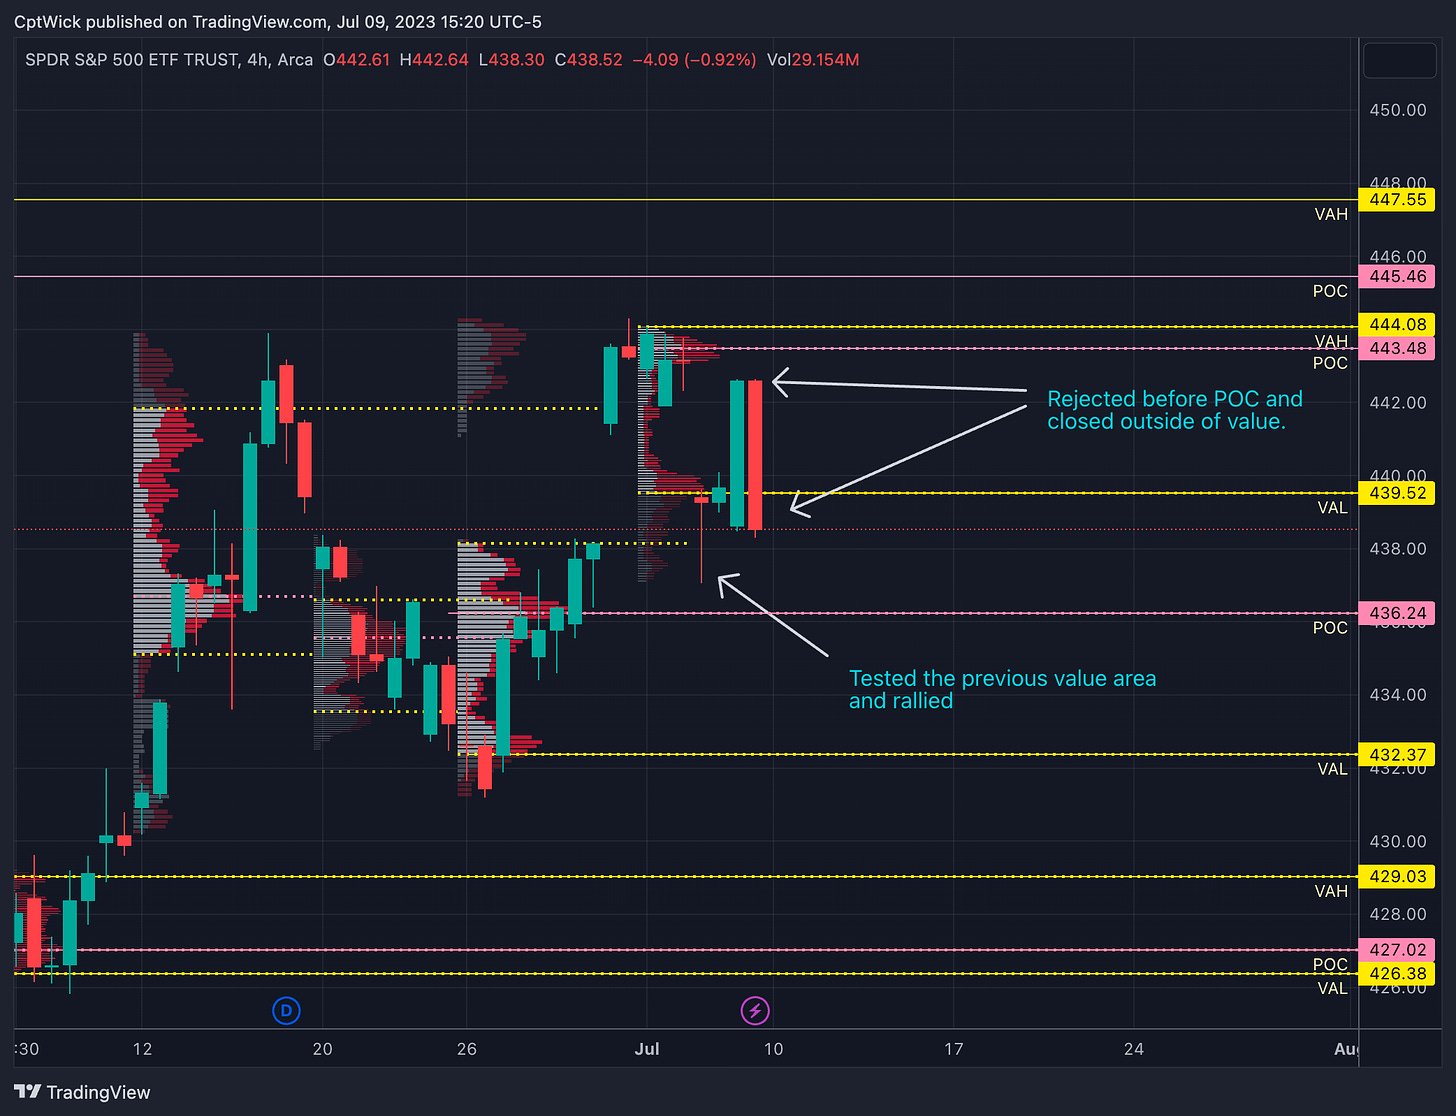
If we look at the weekly profile you can see that dip to test last weeks VAH, but then the bulls failed to close price inside of value. From this chart it looks like they might want to take this lower. The key area is going to be last weeks value area! The bears want to keep the bulls under 439.52 and out of that value area. If the bulls can successfully push through that area we can trade 445-447+.
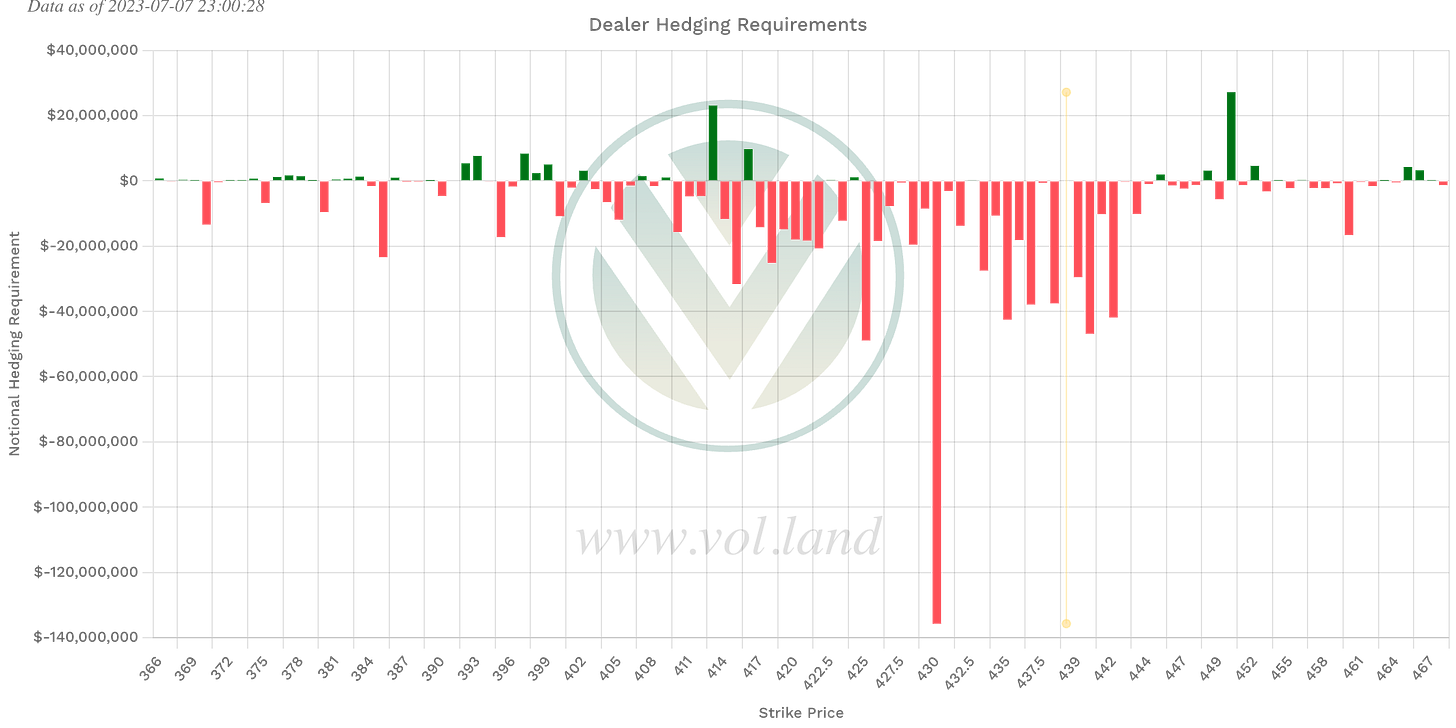
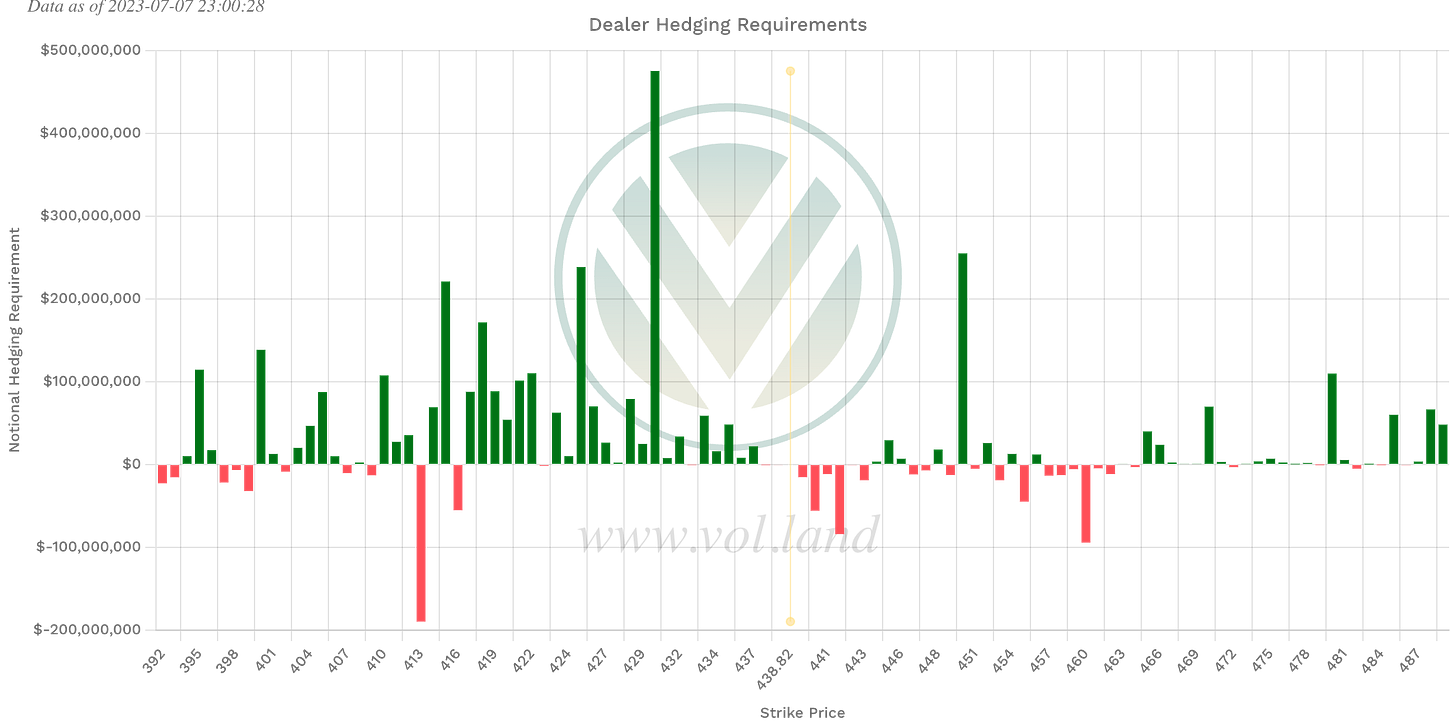
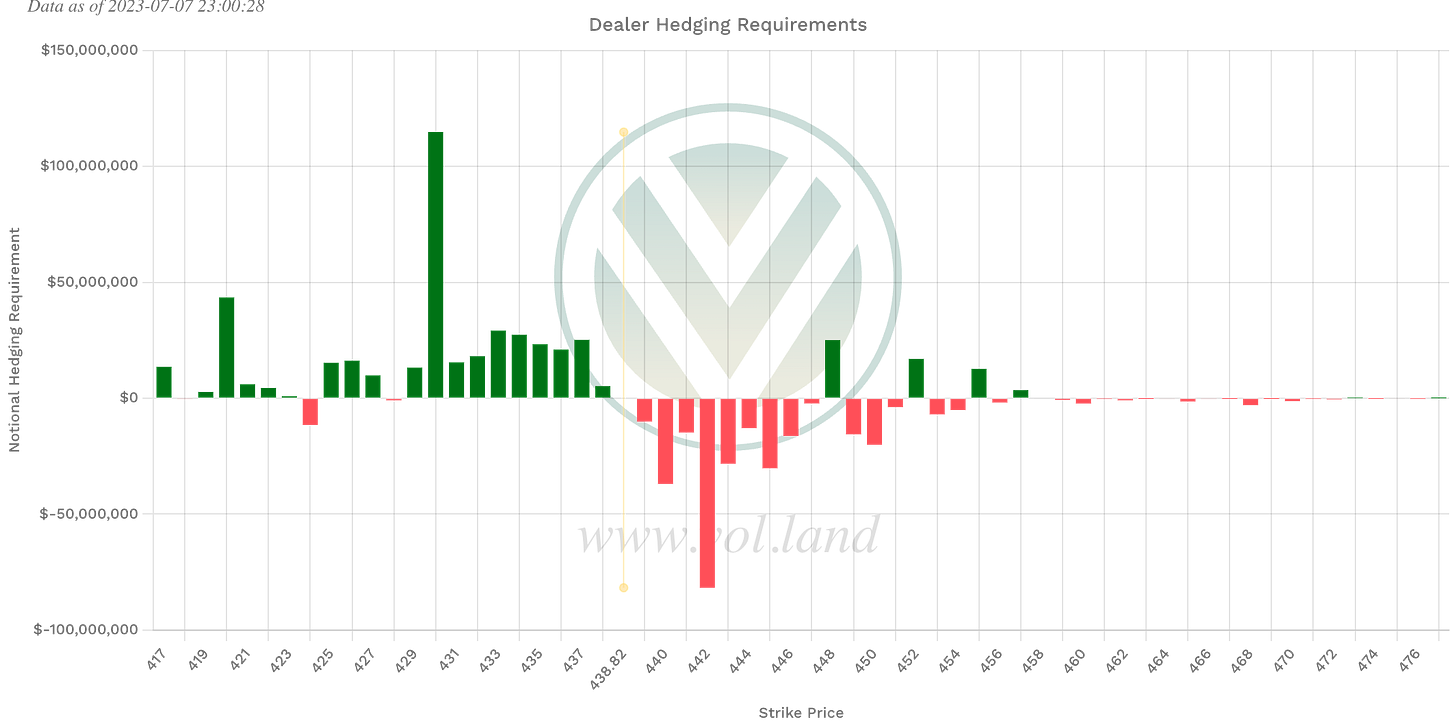
Positive Gamma Levels
Aggregate
413, 416, 424, 445, 448, 450
Weekly
424, 428, 448, 452
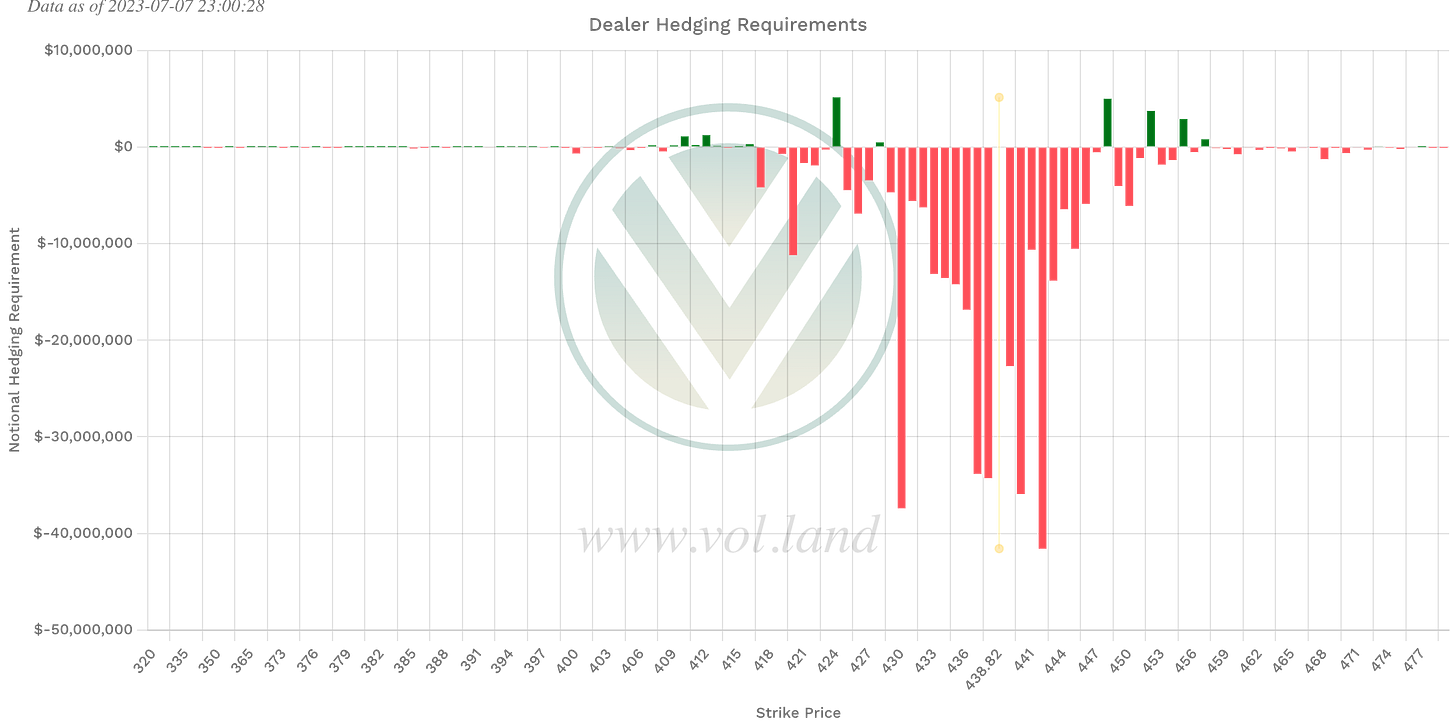
Negative Vanna
Aggregate
413, 416, 439-443, 447
Weekly
424, 428, 439-447
*430 has larger positive Vanna exposure, if things get going to the downside this could pull us right to the 430 level. Something to keep in mind. Vix needs to decrease if we are going to push through last weeks value area being that the Vanna is negative to 447.
Key Levels Above - (previous close)
439.52-444.08, the bulls need to take control of this zone. Be careful if you are a bull in this zone, the volume is thin. So there might be some balancing here. I think this zone dictates future price action, pay close attention if we do trade within again. The Volland data might be suggesting the same thing.
Key levels below - (previous close)
If the zone from up above trades and it gets rejected, I want to be a bear and I want to target 436-432. If this zone trades before 439.52 we need to be cautious of a rally back to last weeks value area. If this is a double top at 444 watch to see if we can get continuation under 432-430.
Happy Trading,
—WICK—
To cover our basis…
Welcome to my Substack where I provide a daily SPY trading plan to help guide my intraday trading. The purpose of this letter is not to advice you on your trading or investment decisions. I am simply documenting my daily trading plan for myself to help with planning and execution. These are simply my opinions and the data sourced from the likes of vol.land, TradingView, Quantdata.us and others. The stock market is risky, gains are not guaranteed. This is not about getting rich quick, but learn to educate yourself and make the necessary financial decisions on your own. This is not financial advice.

