Readers,
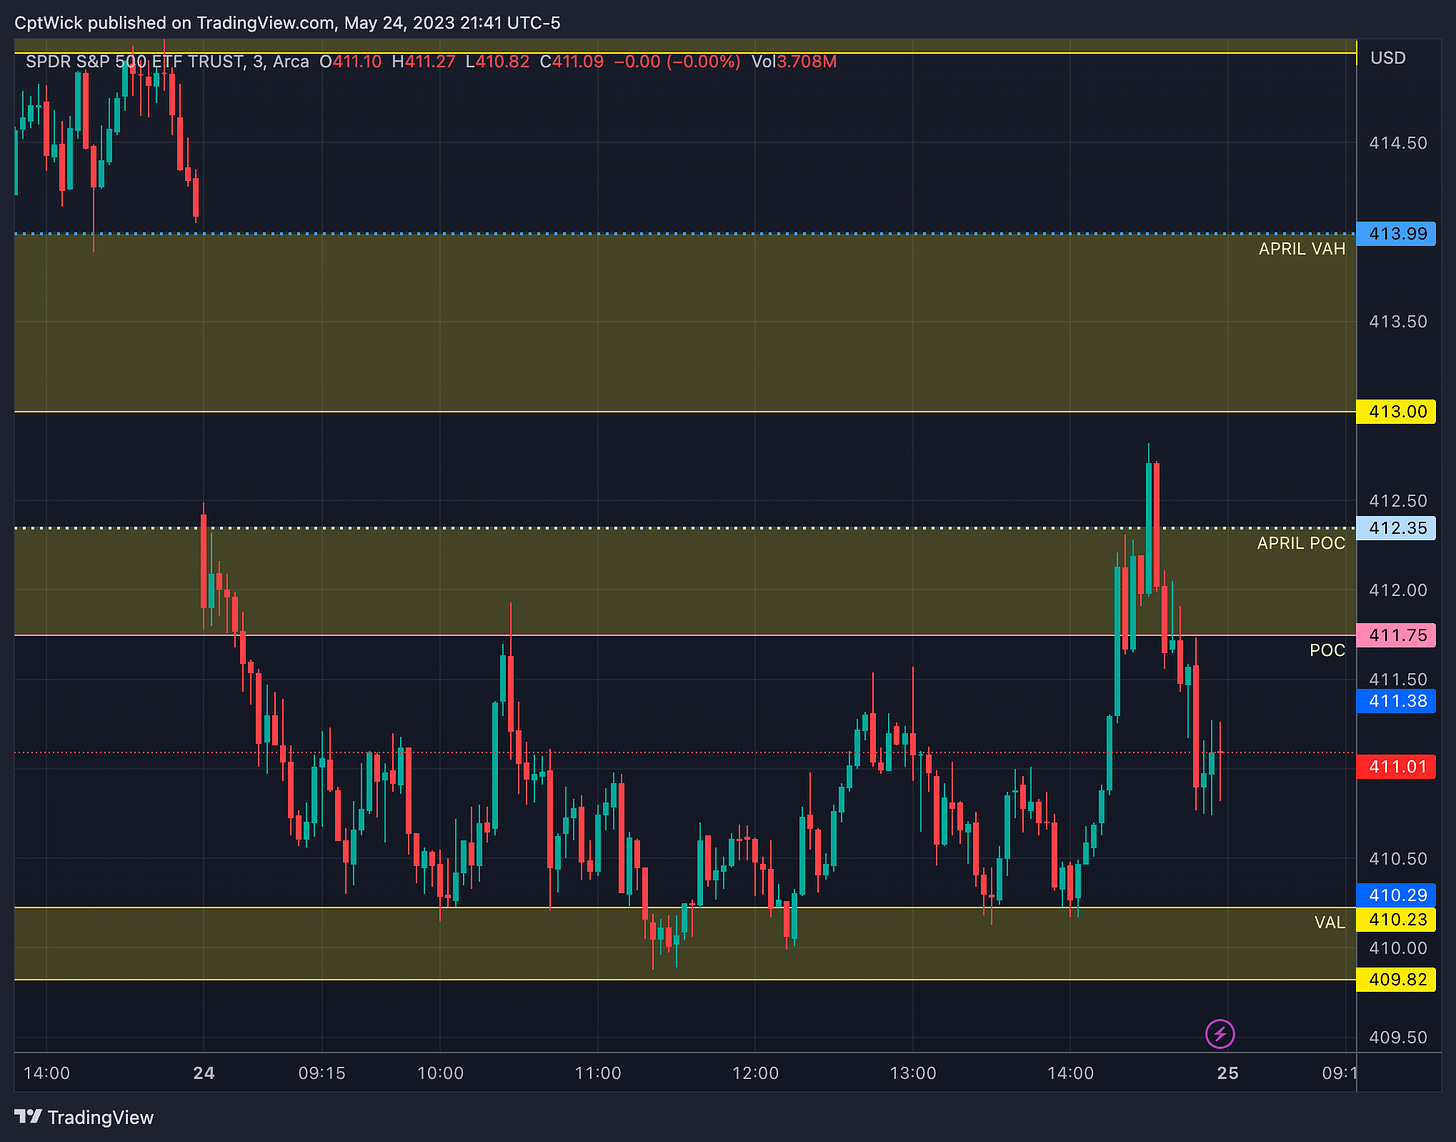
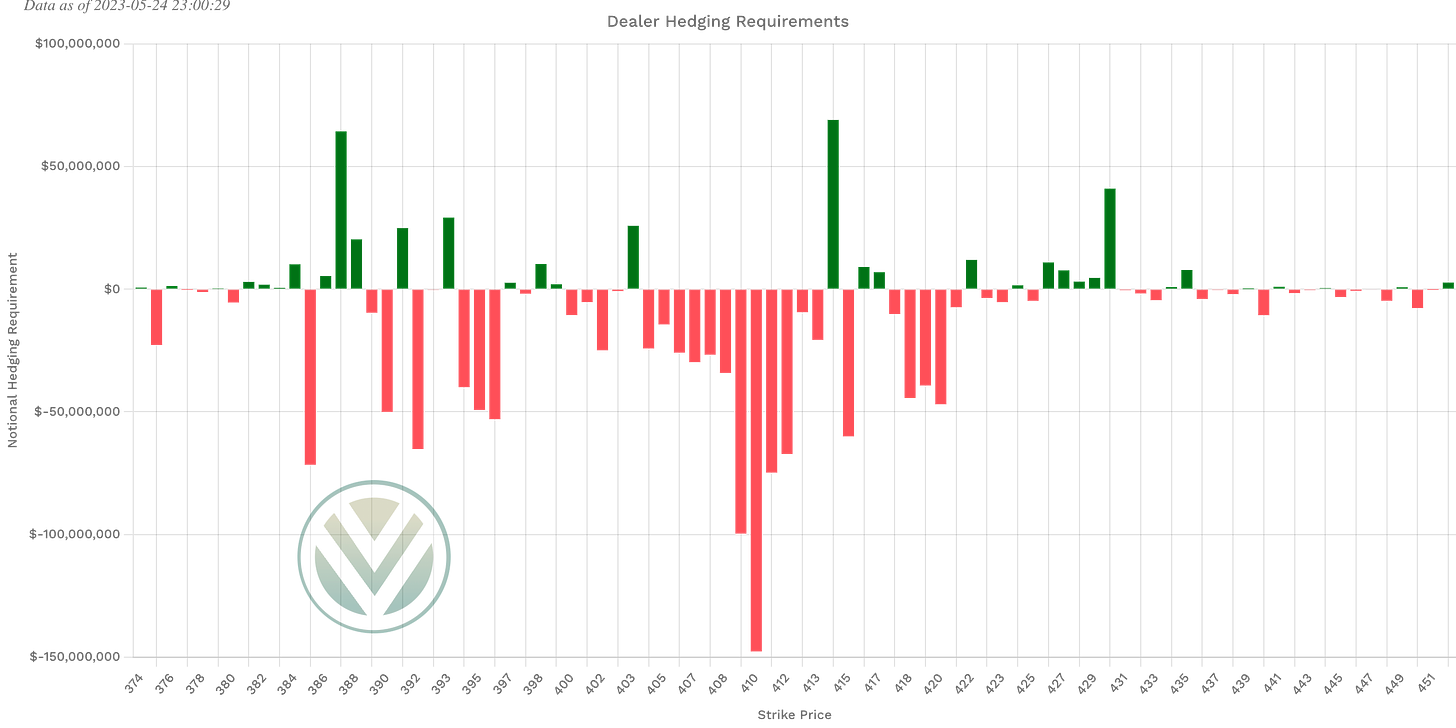
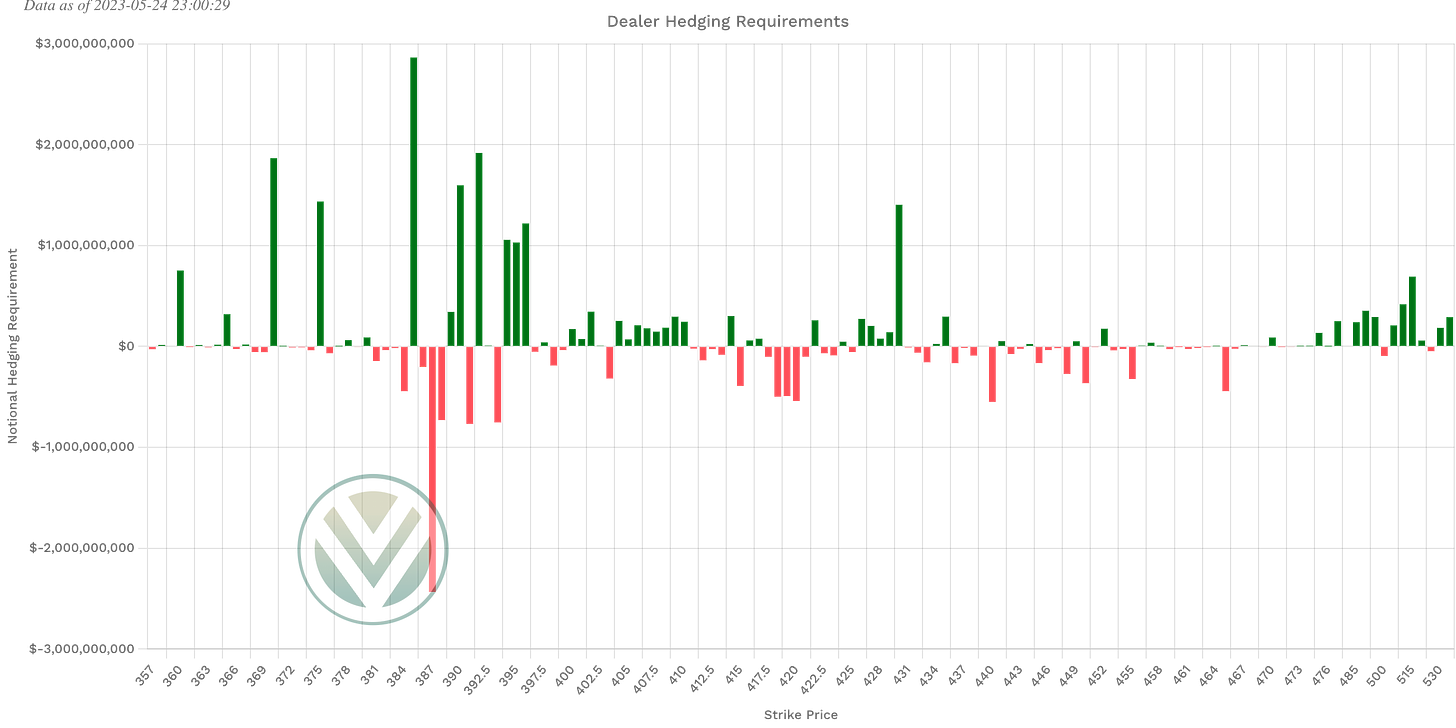
Our downside levels from yesterdays plan worked nicely today and presented some good opportunities. I want to point out something here that I think is pretty important. If you have been following the Gamma/Vanna levels with me you will know that 413 was a NEW positive Gamma level that recently showed up as of market close on Monday. We basically had 3 major positive Gamma levels at 403, 413, and 426. We gapped UNDER 413 at open and sold off into last weeks VAL, that VAL also acted as support of the rest of the session. At the end of the day price made another attempt at 413 but was rejected.
The reason I want to point this out is because we also had the Vanna turn red from 413-425 and negative (red) Vanna acts as a repellent pushing price in the opposite directions. I think that if 413-414 can be reclaimed by the bulls, (cough NVDA cough), I think we can maybe try 417 again.
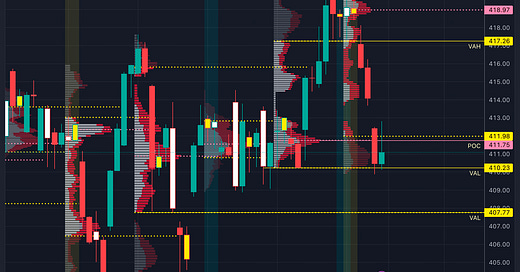
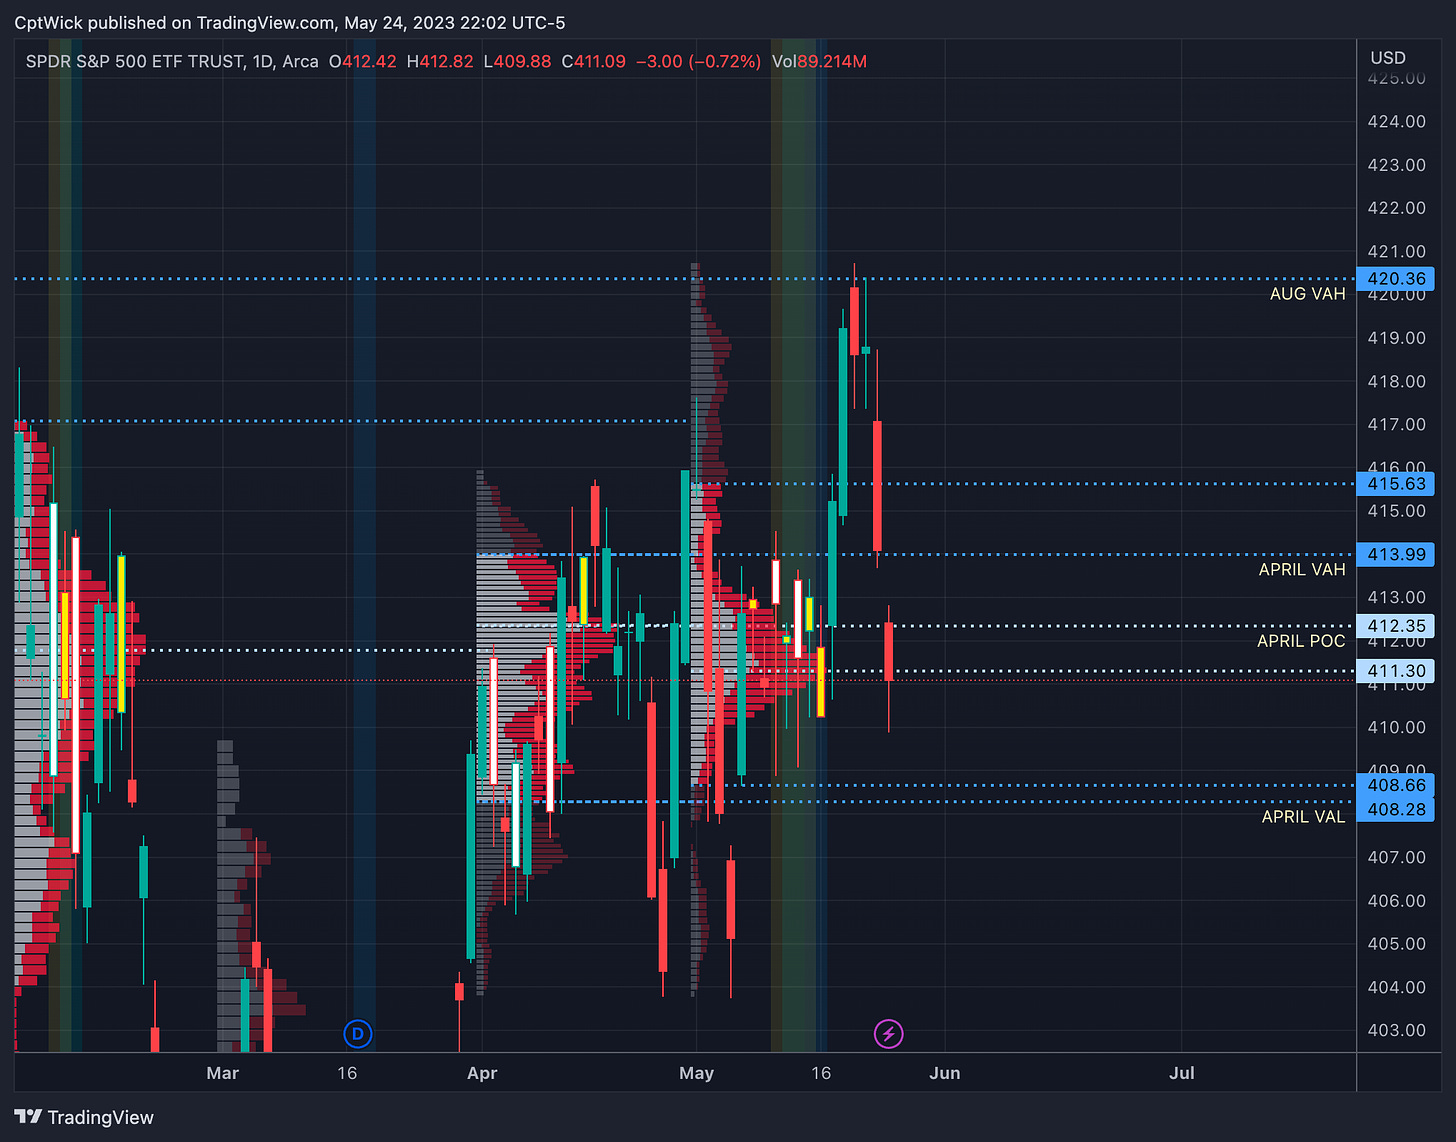
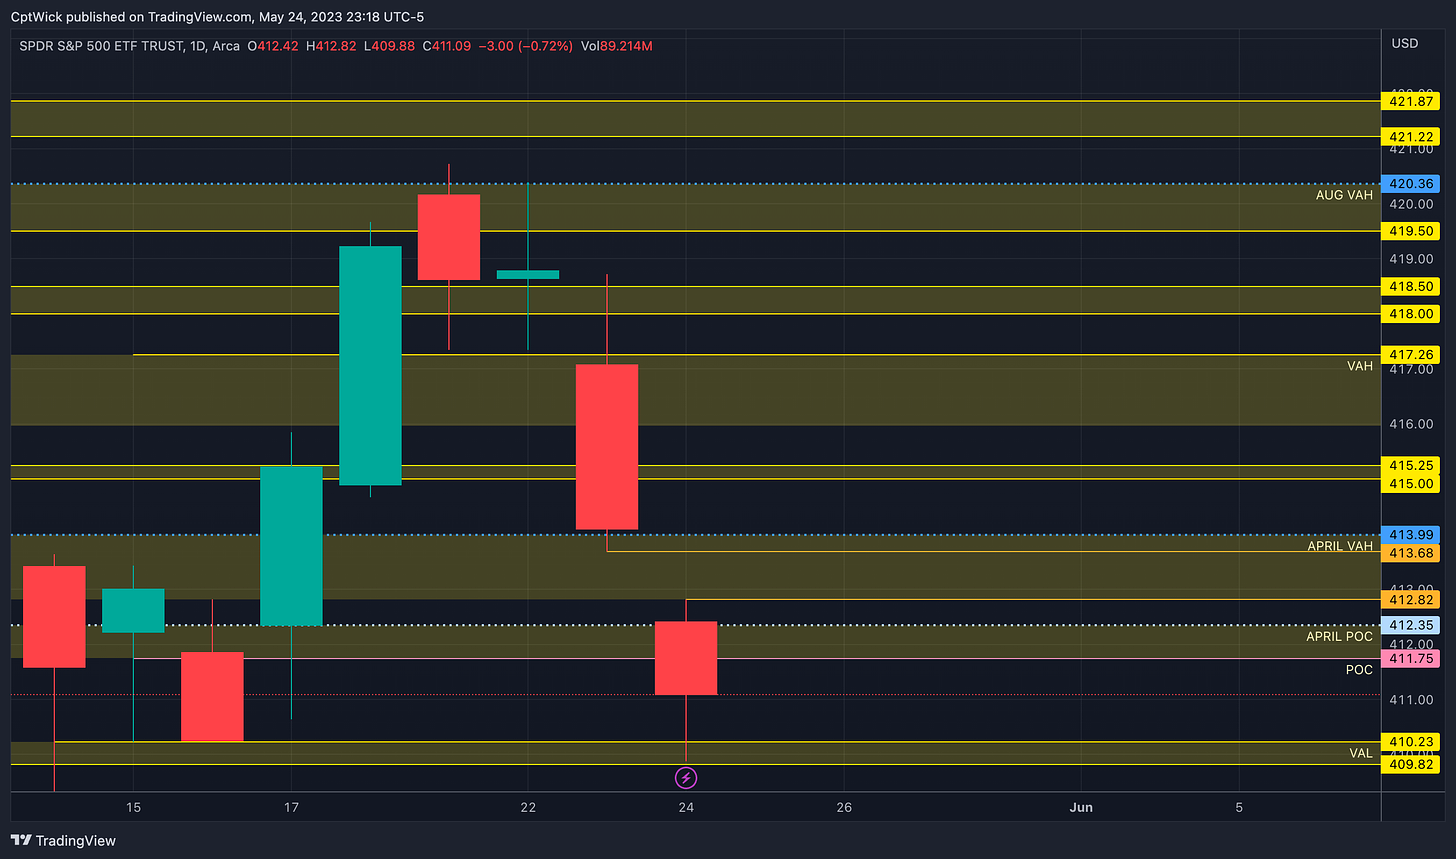
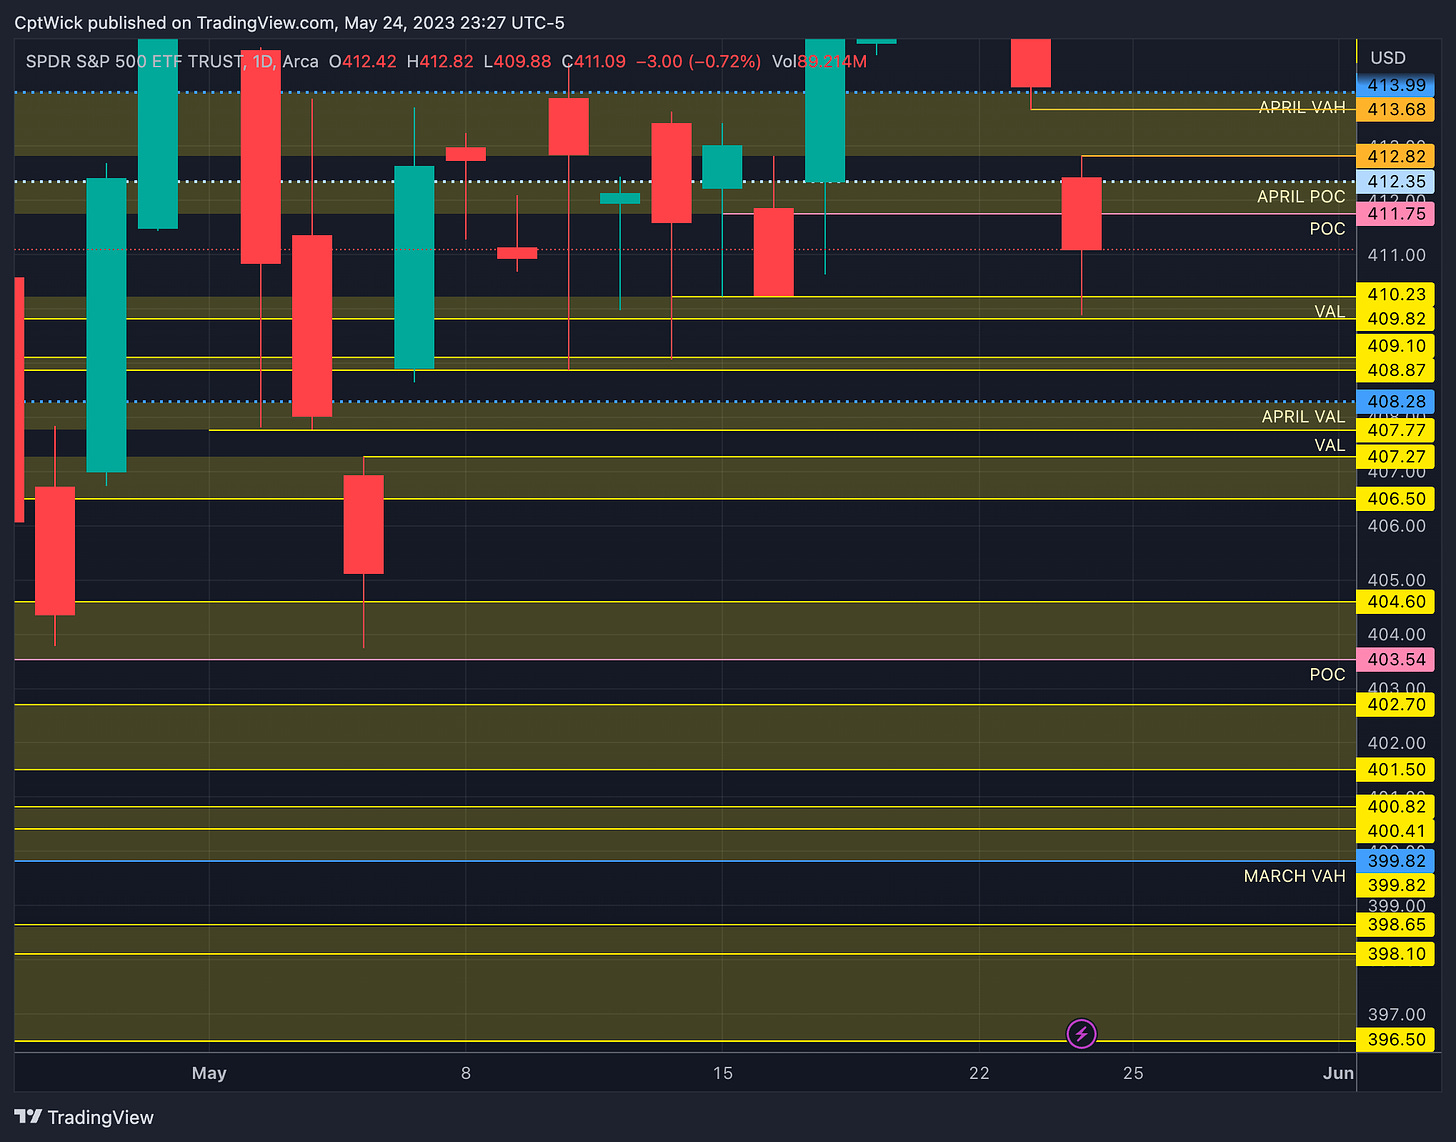
On the monthly profile we opened up todays session right near April’s POC but we couldn’t quite make it down to the April VAL. It’s because we found support at last weeks VAL at 410.23.
This really was a picture perfect trade if you caught it, based on what we covered in the last few posts. The weekly profile was screaming for a test of the POC and VAL at 411.75 and 410.23. Yesterday we breached last weeks VAH and we had tons of room down to the POC and VAL was good R/R, the 412P for 5/24 end of day Tuesday were roughly .55 and they saw 2.30+ before lunch.
We fully rotated down to test the other side of value. This happens frequently with the volume profile.
Positive Gamma
398, 403, 414, 416, 417, 422
The positive Gamma has shifted to 414 and it is strong. Notice how 414 (a key volume profile level) has now become a key Volland level… this builds that conviction at the 414 level.
Negative Vanna
398, 403, 411-413, 415, 417.50-421
That negative cluster from 415-421 is going to be tough to get through unless vol (VIX) drops.
Key levels above (previous close - 411.09)
411.75-412.35
412.35 is April’s POC
412.20 is the MMs weekly expected low *see 5/22’s trade plan*
411.75 is last weeks POC (the current monthly POC sits right here as well (411.64)
412.82, 413.68, 414
We have a gap in the VP from 412.82 t0 413.68.
413 negative Vanna
414 is April’s VAH
414 positive Gamma
415-415.25
Supply
415 negative Vanna (resistance)
415.97-417.26
415.97 is the current monthly VAH
417.26 is last weeks VAH
416/417 negative Vanna (resistance)
418-418.50
Supply and negative Vanna
Key levels below (previous close - 411.09)
410.23-409.82
410.23 is last weeks VAL
Demand
409.10-408.87
Demand
408.28-407.77
April’s VAL and 407.77 is a naked weekly VAL
407.27-406.50
Demand
404.60-403.54
403.54 is a naked weekly POC, I think that if we take out 408.28-407.77 we should test this level.
399.82
March VAH, this is the start of the next naked monthly value area for March.
Happy Trading,
—WICK—
To cover our basis…
Welcome to my Substack where I provide a daily SPY trading plan to help guide my intraday trading. The purpose of this letter is not to advice you on your trading or investment decisions. I am simply documenting my daily trading plan for myself to help with planning and execution. These are simply my opinions and the data sourced from the likes of vol.land, TradingView, Quantdata.us and others. The stock market is risky, gains are not guaranteed. This is not about getting rich quick, but learn to educate yourself and make the necessary financial decisions on your own. This is not financial advice.

