Readers,
The MMs are expecting a move of $6.42 on SPY this week. That gives us a upper range of 425.04 and a lower range of 412.20. Last week the upper range was 418.08 and we closed at 418.62.
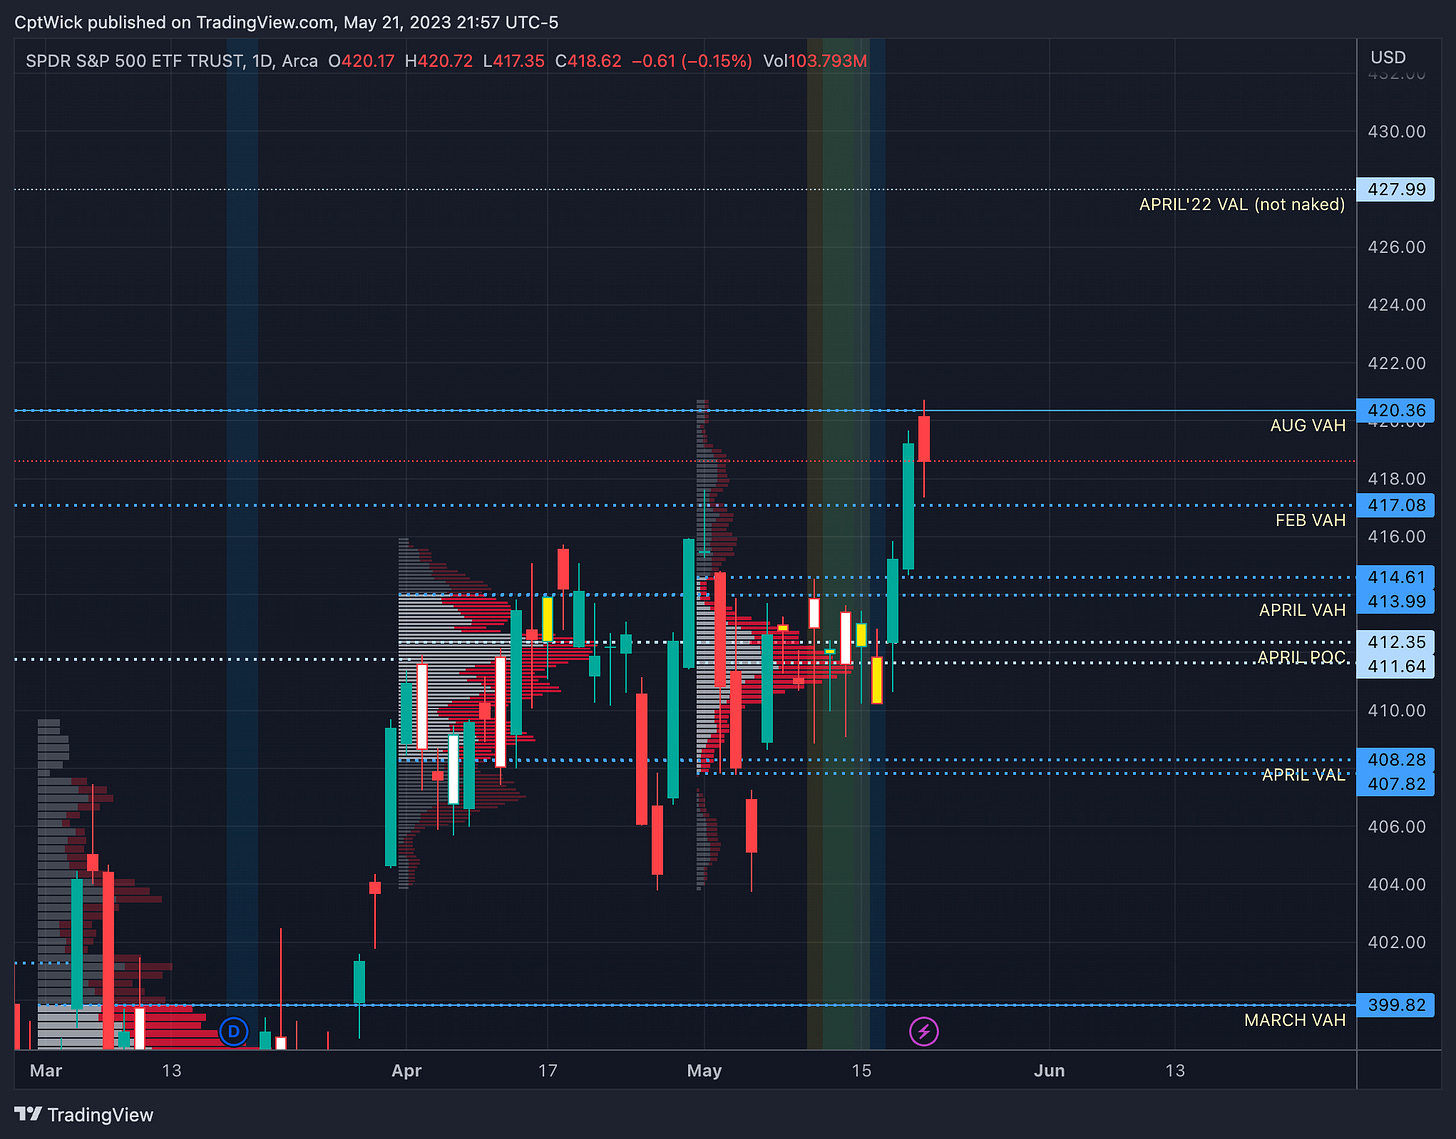
This monthly profile is pretty important. We are currently basing between Aug 22’ VAH and February's VAH. These two levels, 420.36 and 417.08 are important for me going into this week. Our current VAH is 414.61, POC is 411.64, and VAL at 407.82.
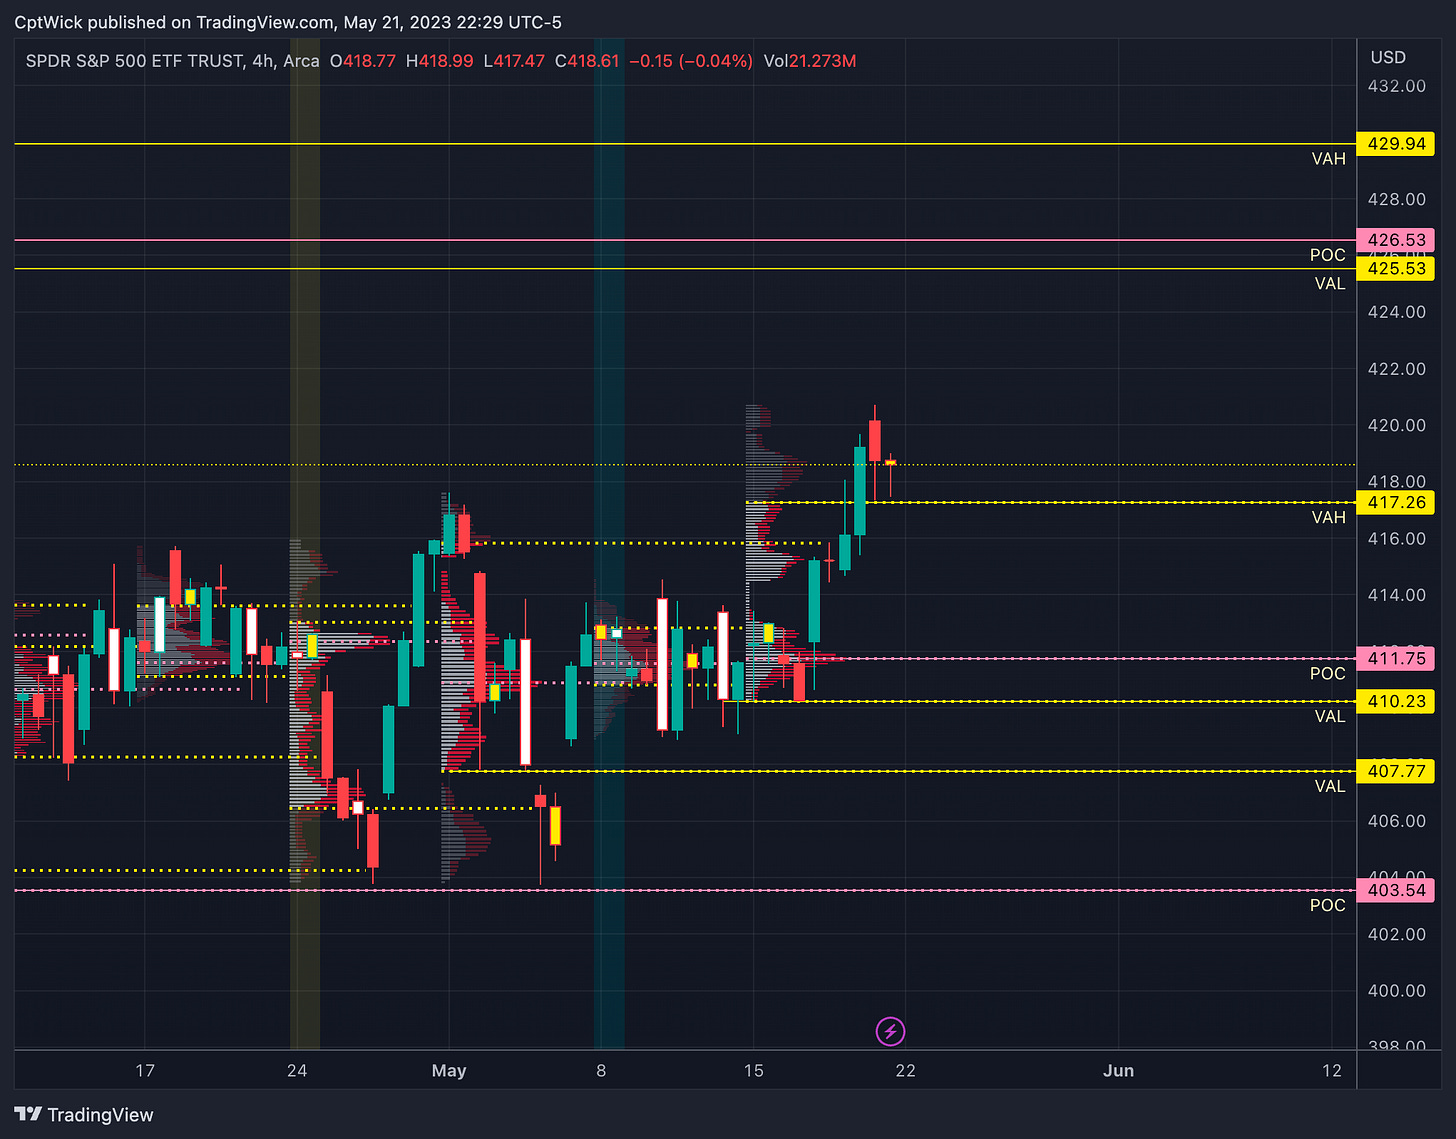
On the weekly profile we are basing above last weeks value area. The VAH comes in at 417.26, POC is 411.76, and VAL at 410.23. This brings more conviction to the 417 level.
417 is important for both the bears and the bulls. We have been highlighting this area for some time now and in last Friday’s plan I said that if we lost 417 I want to see what happens at the 414 level. If the bulls lose 417 and 414, price could revisit 403.54 (weekly naked POC).
If price stays above 417 I think SPY targets 425.53, which is a naked weekly value area low, and the POC is at 426.53.
Now, when we review the Volland data you will notice that these levels I highlight on the volume profile’s are lining up with the data.
Positive Gamma
403, 419, 421, 426-430
Notice how we have the two larger positive Gamma levels at 419 and 421. As it sits right now we closed under both of these levels. So we should treat these as resistance. IF price can push above that 421 positive Gamma, we could run to the next positive value at 426 (see how this aligns with our weekly volume profile!
We also don’t have Gamma support under 419, until 403 (another volume profile level!)
Negative Vanna
403, 422.50, 425, 433
Vanna is very positive here. But the negative values are lining up with the rest of the analysis.
Key levels above (previous close - 418.62)
419, 419.67, 420.36
419 is positive Gamma (resistance)
420.36 Aug 22’ VAH
421.22-421.87
Supply
We still have a small gap to fill at 421.22
422 is positive Gamma (resistance)
423.73 424.70
Supply
425.04, 425.53, 426.53
425.04 is the MMs weekly high
425.53 is a naked weekly VAL and the POC is located at 426.53.
The Volland data (Gamma) is also saying that if we can get through 419-421, we should see 426. But we need to be wary of the supply zones if we are scalping.
Key levels below (previous close - 418.62)
417.72, 417.26, 417.08
417.26 is last weeks VAH
417.08 Feb’s VAH
415.82-415.33
Demand
414.45, 413.99, 413.59
413.99 April’s VAH
412.35, 412.20, 411.75
412.35 April’s POC, 412.20 is the MMs weekly lower range
Happy Trading,
—WICK—
To cover our basis…
Welcome to my Substack where I provide a daily SPY trading plan to help guide my intraday trading. The purpose of this letter is not to advice you on your trading or investment decisions. I am simply documenting my daily trading plan for myself to help with planning and execution. These are simply my opinions and the data sourced from the likes of vol.land, TradingView, Quantdata.us and others. The stock market is risky, gains are not guaranteed. This is not about getting rich quick, but learn to educate yourself and make the necessary financial decisions on your own. This is not financial advice.


