Readers,
The bulls are making a strong attempt to find value higher. In yesterdays plan I said that if price made a second attempt at 417.08 (Feb’s VAH), we would make a run at 420.36.
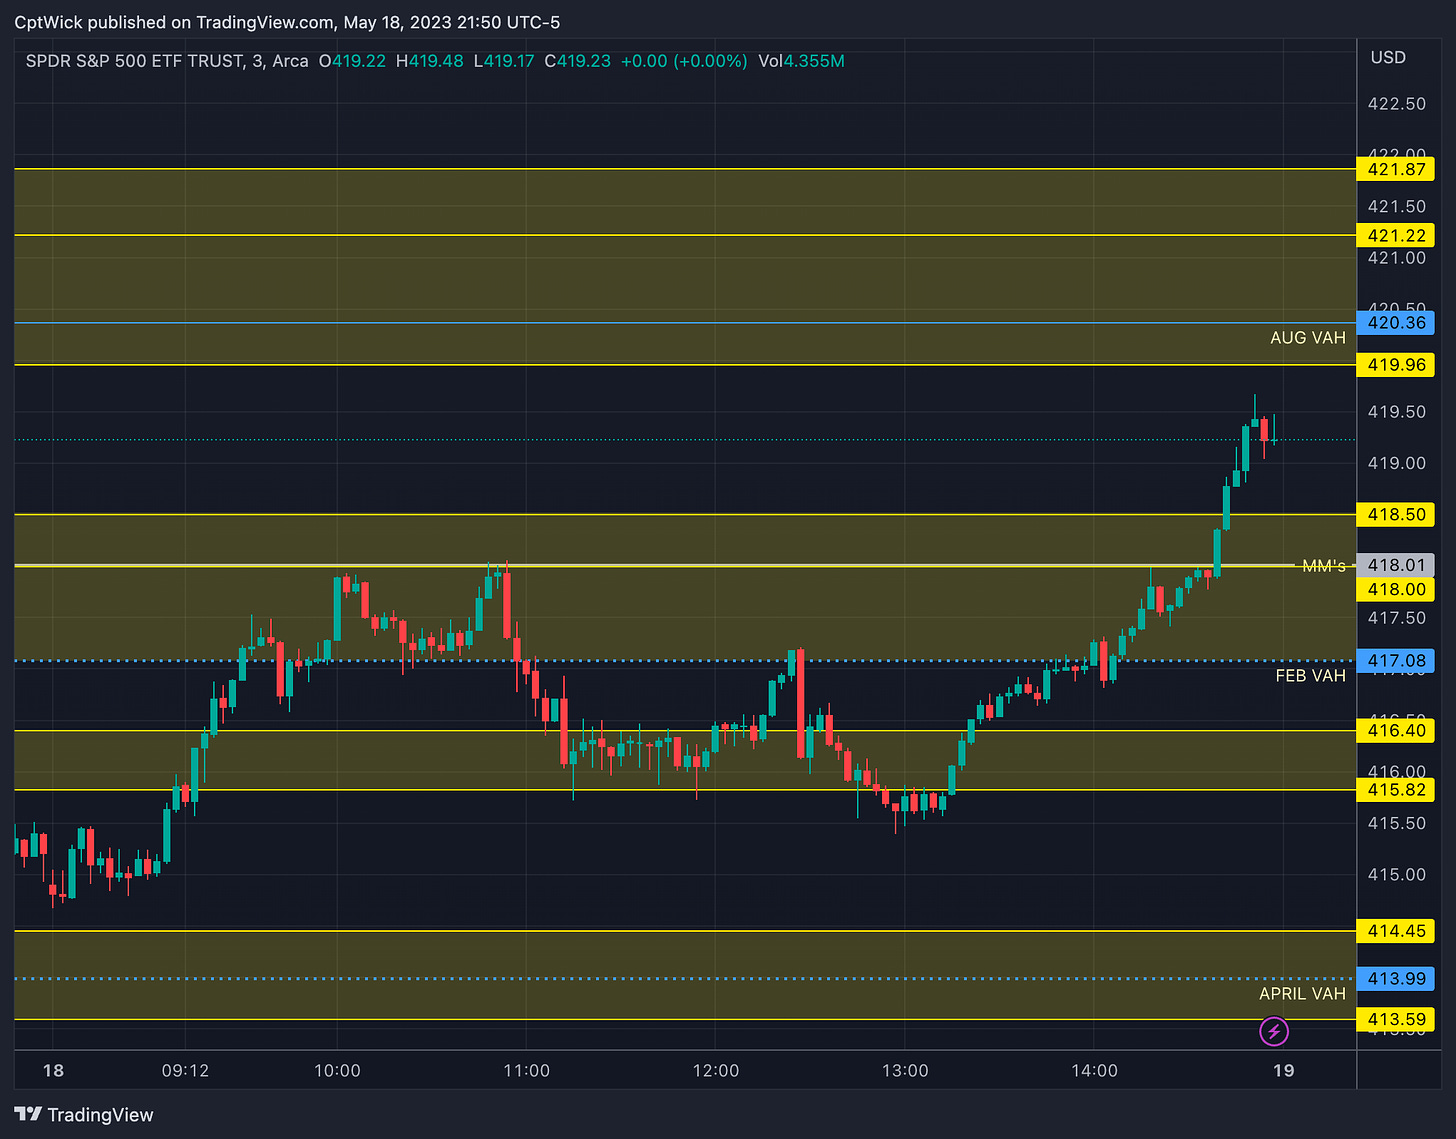
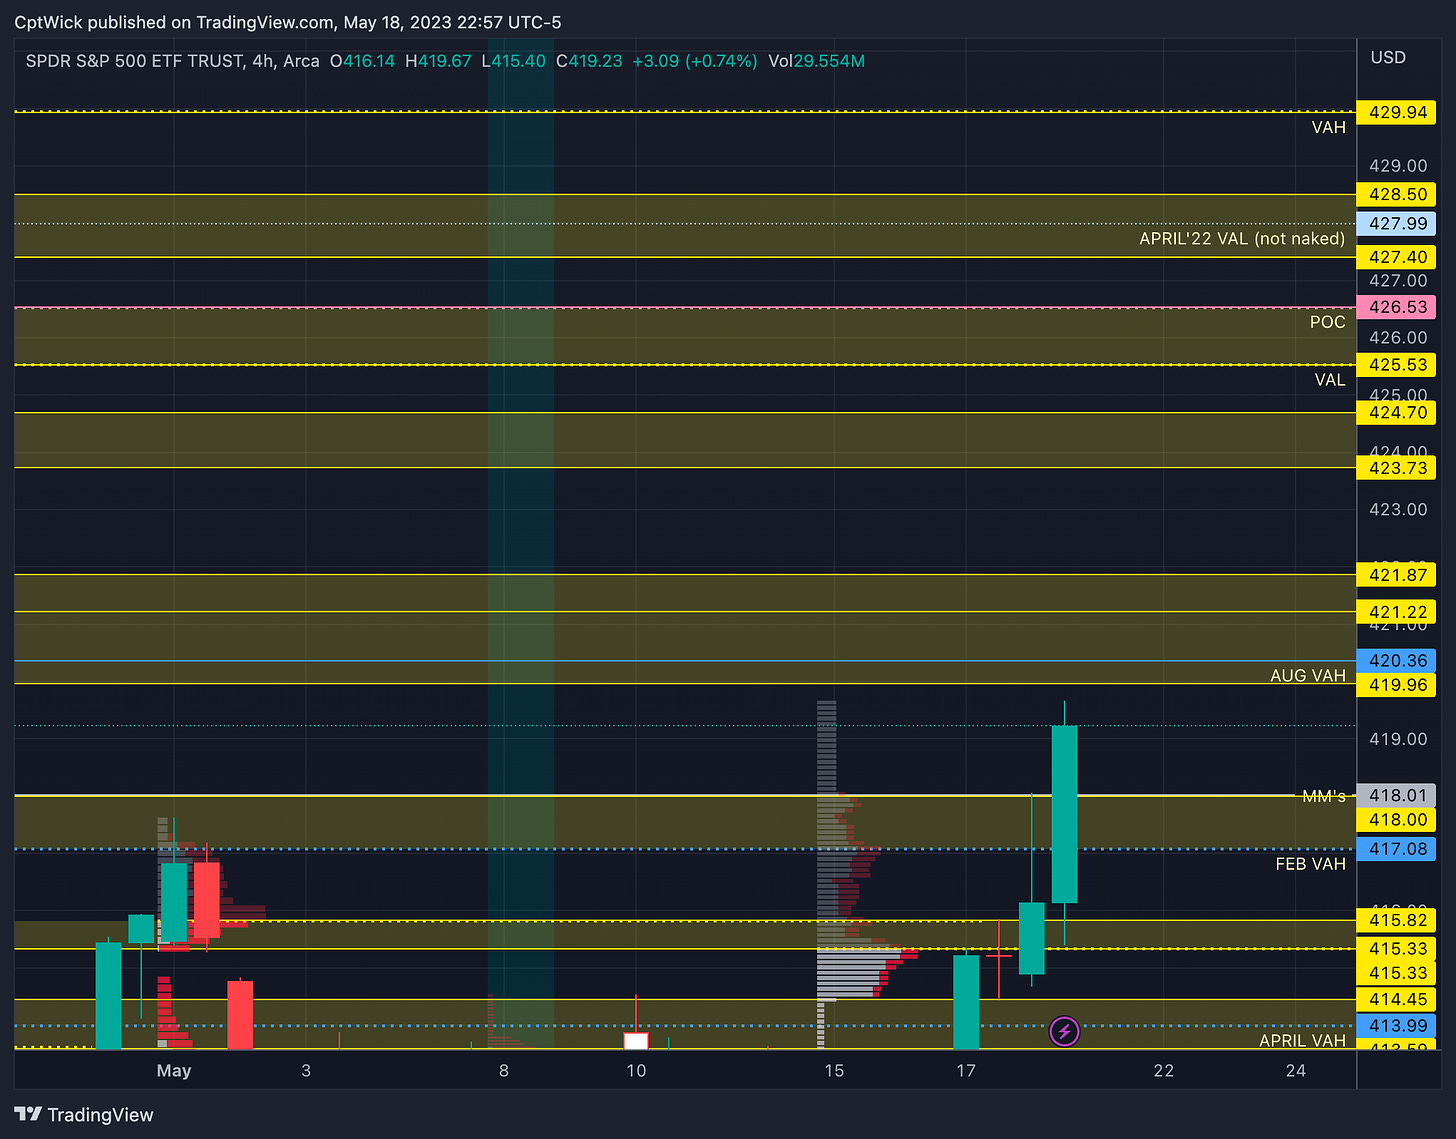
418.01 the MMs expected high was resistance until the last 20 minute push. The bulls successfully pushed us out of this area. Can they defend and keep it going? We didn’t test that 414.45-413.59 area I was hoping for, instead we opened and based above it before going to test 418.
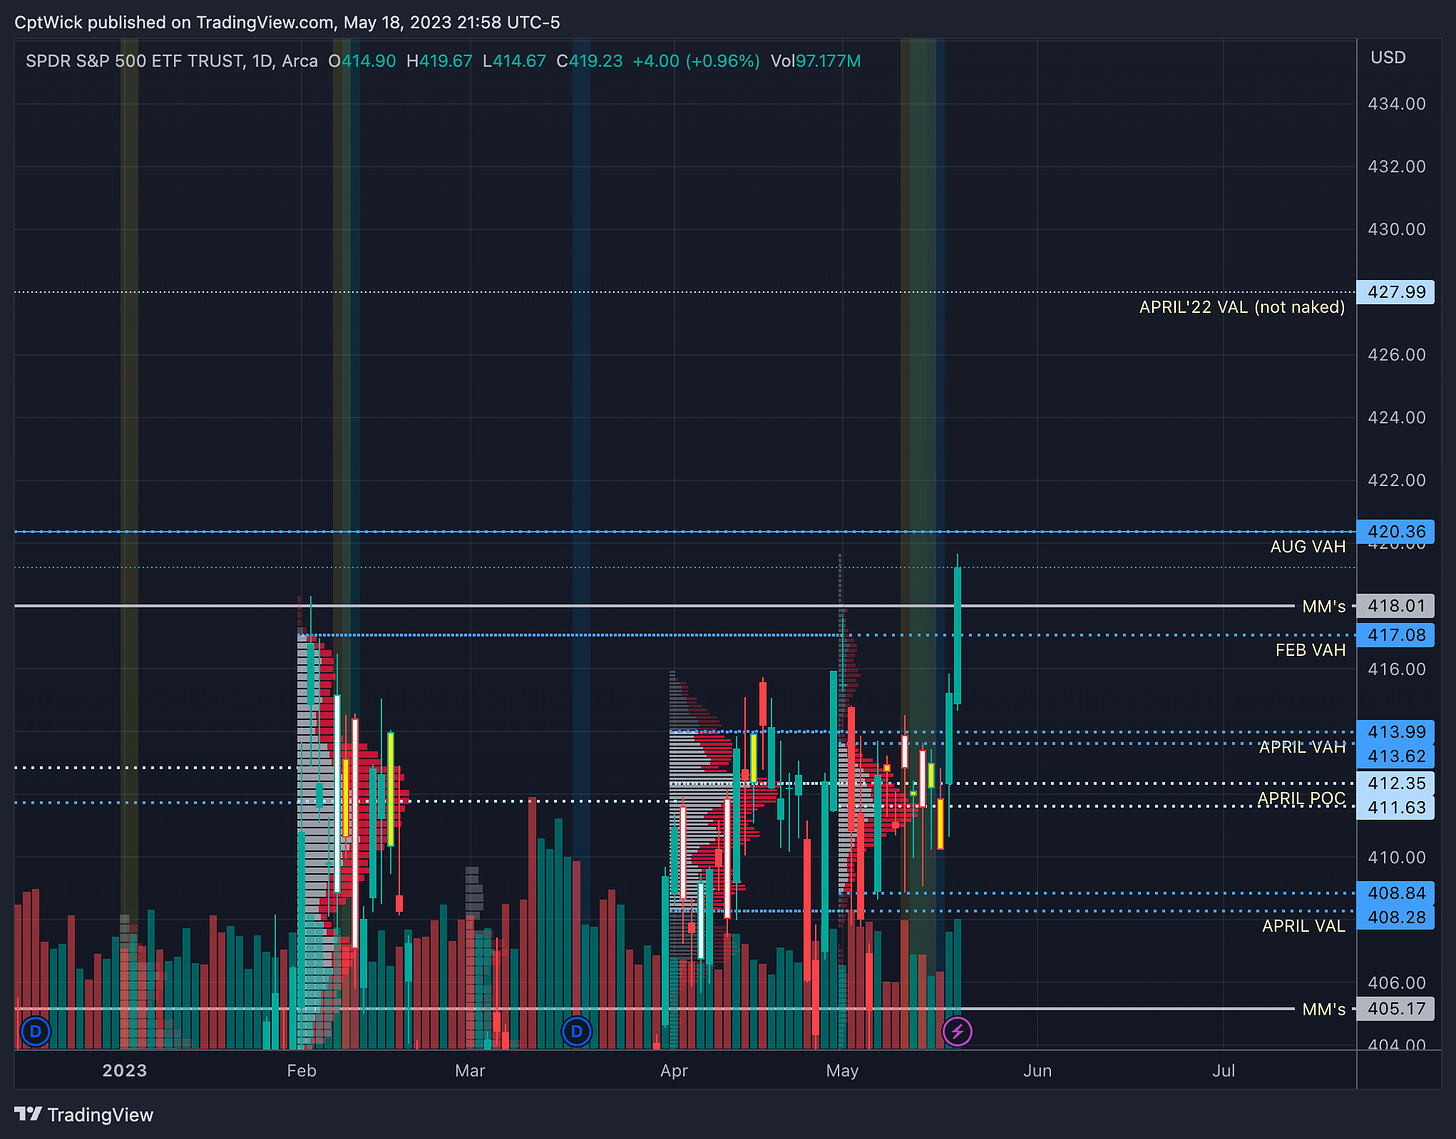
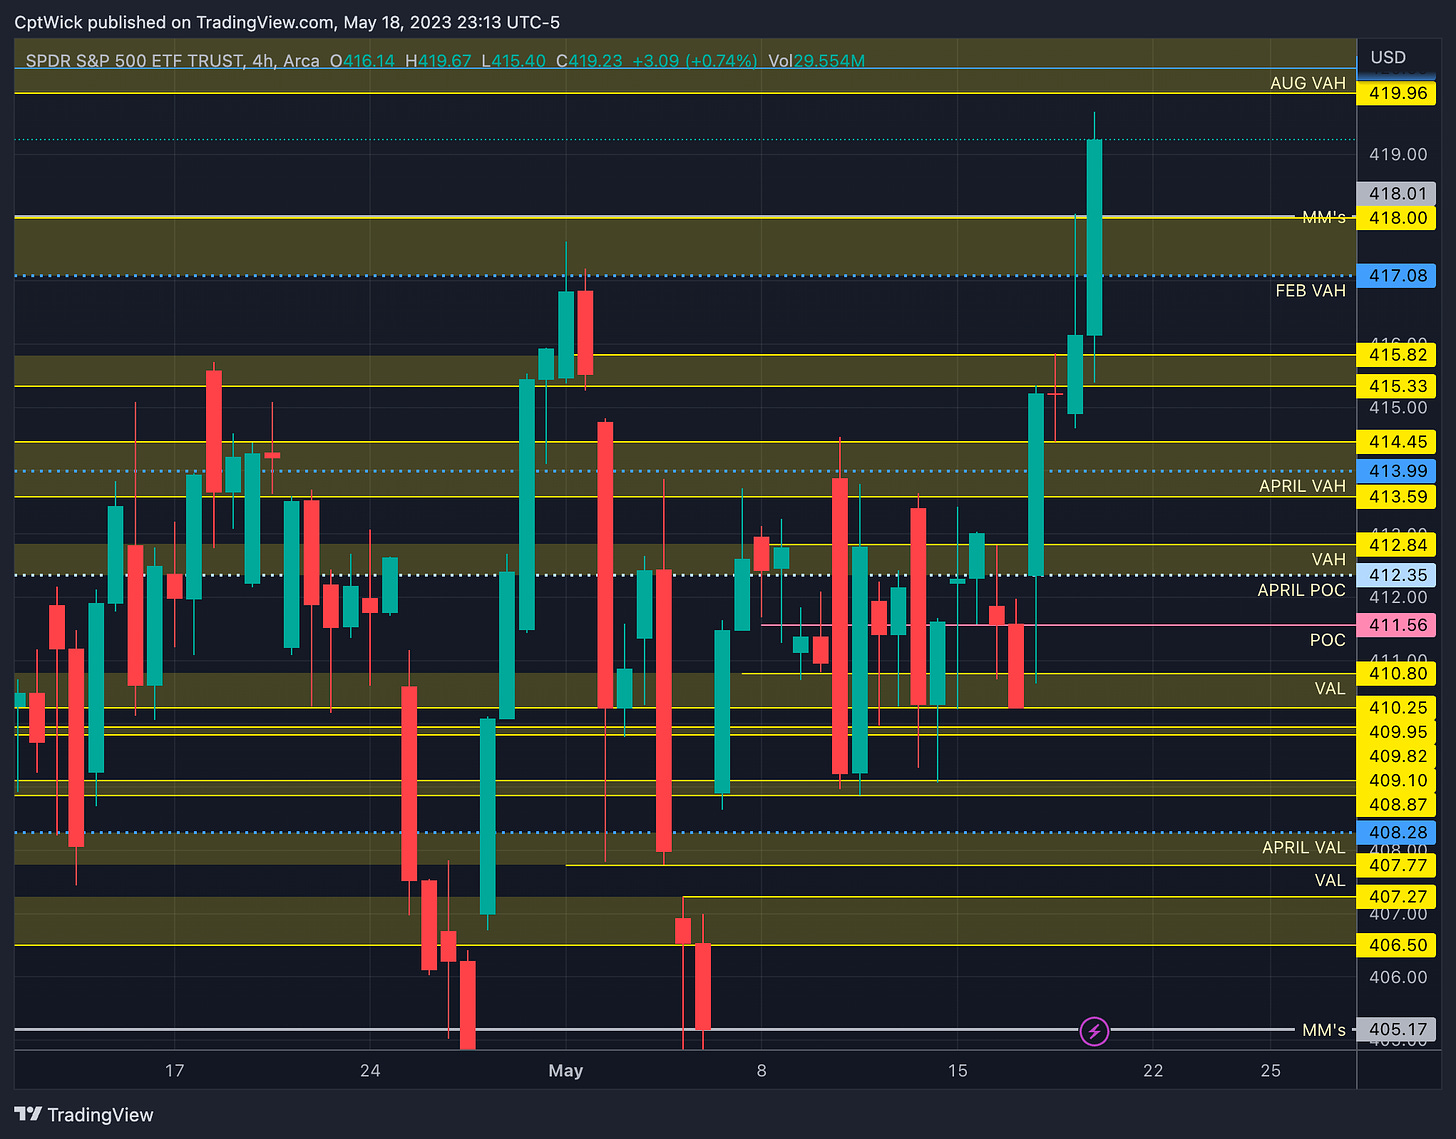
Look at the monthly profile now. We have created a big imbalance to the upside above May, April, and February’s value areas and we are coming to the top of the current August 22’ value area that we have been in for some time now. It is very important for the bulls to defend any pullbacks into the 417-414 area. If price falls back under 417 I want to see if the bulls can defend 414, if that fails it could get ugly quick.
My bearish chart that I posted last night could be playing out if the bulls cannot sustain this rally. Being that we are at a imbalance to the upside we either have to get accepted above 420.36 (Aug 22’ VAH) or it will find value lower. Yesterday's Plan
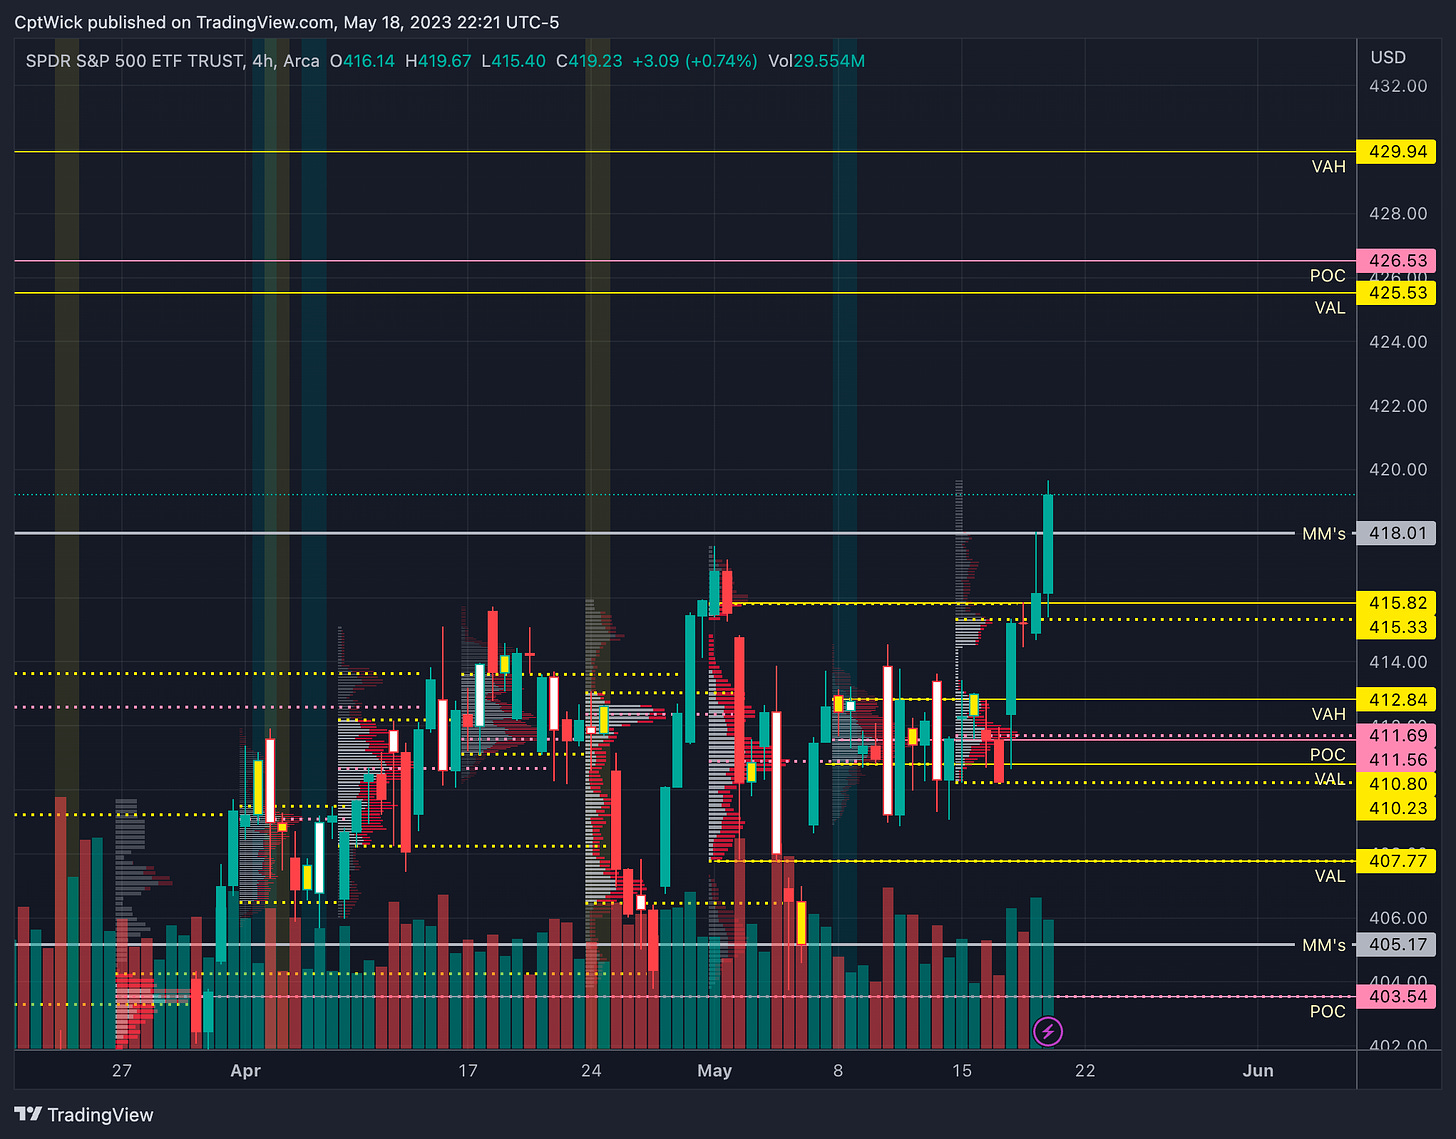
On the weekly profile we its the same story. We have a imbalance to the upside. Last weeks VAH of 415.82 and this weeks VAH at 415.33 is going to be a key area. Same with 414 and we will break that down later. So on the monthly profile, if we get accepted above August 22’ VAH, I would think the next area of interest would be the next naked value area at 425.53. If price fails up here and we start rotating down through previous value, 403.54 is the next naked POC below us.
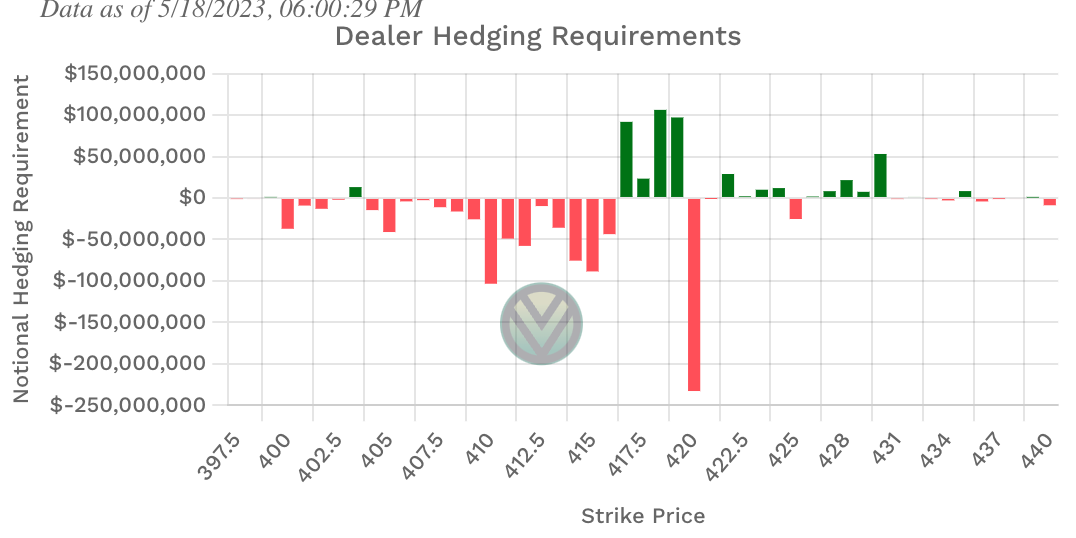
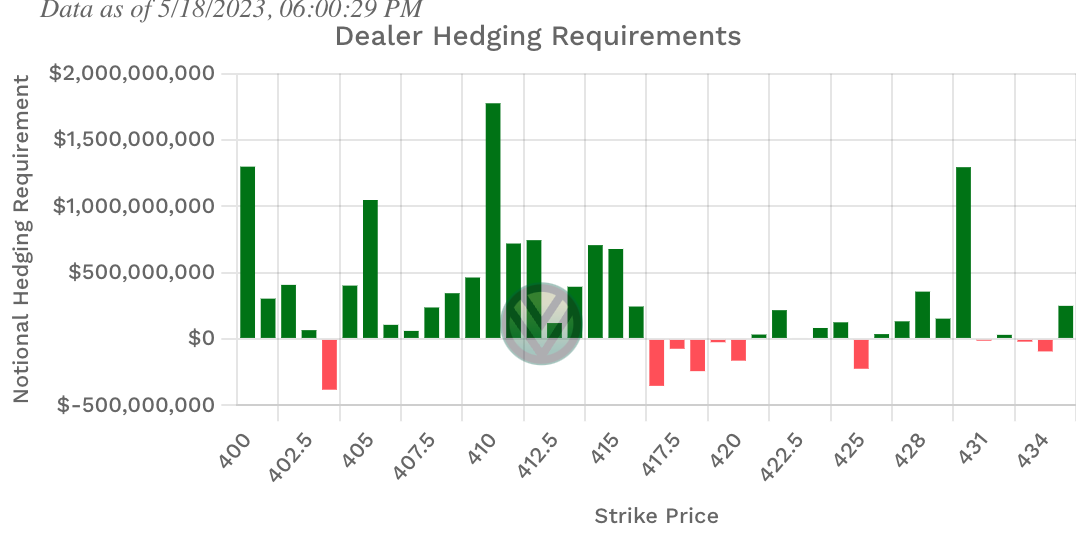
Positive Gamma
403, 417-419, 422-424, 427-430
This is almost exactly how Gamma looked yesterday. In last nights plan in the Gamma section I said, we don’t have gamma support under 415 until 403. When I say this price tends to magnet to positive gamma cluster if it doesn’t move fast towards the next positive gamma (in this case 403) fast. So tomorrow if we lose 417 but we reclaim it, that could be a bullish sign. Something to keep an eye on.
Negative Vanna
403, 417-420, 425
If we open above of bid above 420 (420.36 Aug 22’ VAH), that negative Vanna should become support, and there is a shot at 425.
If we open under 420-417 that negative Vanna should act as resistance.
Key levels above (previous close - 419.23)
419.96, 420.36, 421.22, 421.87
We have a gap in volume from 419.96-421.22
420.36 is Aug 22’ VAH
419/420 is negative Vanna, 419 is positive Gamma
423.73 - 424.70
422-424 is positive Gamma
425 is negative Vanna
425.53 - 426.53
Next weekly naked VAL and POC
427 is positive Gamma
Key levels below (previous close - 419.23)
418.01 - 417.08
418.01 is the weekly MMs expected high.
417.08 was Feb’s VAH
417/418 negative Vanna and positive Gamma
415.82 - 415.33
415.82 was a naked weekly VAH and 415.33 is this weeks VAH
414.45, 413.99, 413.59
Demand, 413.99 was April’s VAH
412.84 - 412.35
Last weeks VAH and April’s POC
411.56
Last weeks POC
410.80 - 410.25
Last weeks and this weeks VAL
409.95 - 409.82
small demand level (worth watching)
409.10 - 408.87
small demand level (worth watching)
408.28 - 407.77
408.28 is April’s VAL
407.77 is a weekly naked VAL
Very important levels.
407.27 - 406.50
We have a gap in volume from 407.77 to 407.27 (stronger demand)
405.17
MMs weekly expected low
I think that if we fail to go higher here and we are sucked back under 414 the sell off could get nasty.
Happy Trading,
—WICK—
To cover our basis…
Welcome to my Substack where I provide a daily SPY trading plan to help guide my intraday trading. The purpose of this letter is not to advice you on your trading or investment decisions. I am simply documenting my daily trading plan for myself to help with planning and execution. These are simply my opinions and the data sourced from the likes of vol.land, TradingView, Quantdata.us and others. The stock market is risky, gains are not guaranteed. This is not about getting rich quick, but learn to educate yourself and make the necessary financial decisions on your own. This is not financial advice.


