Readers,
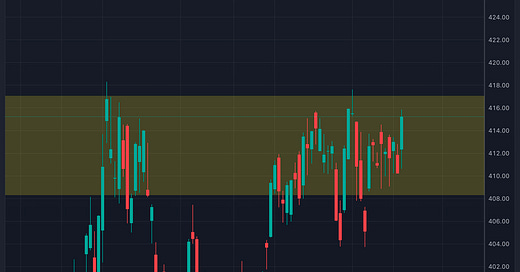
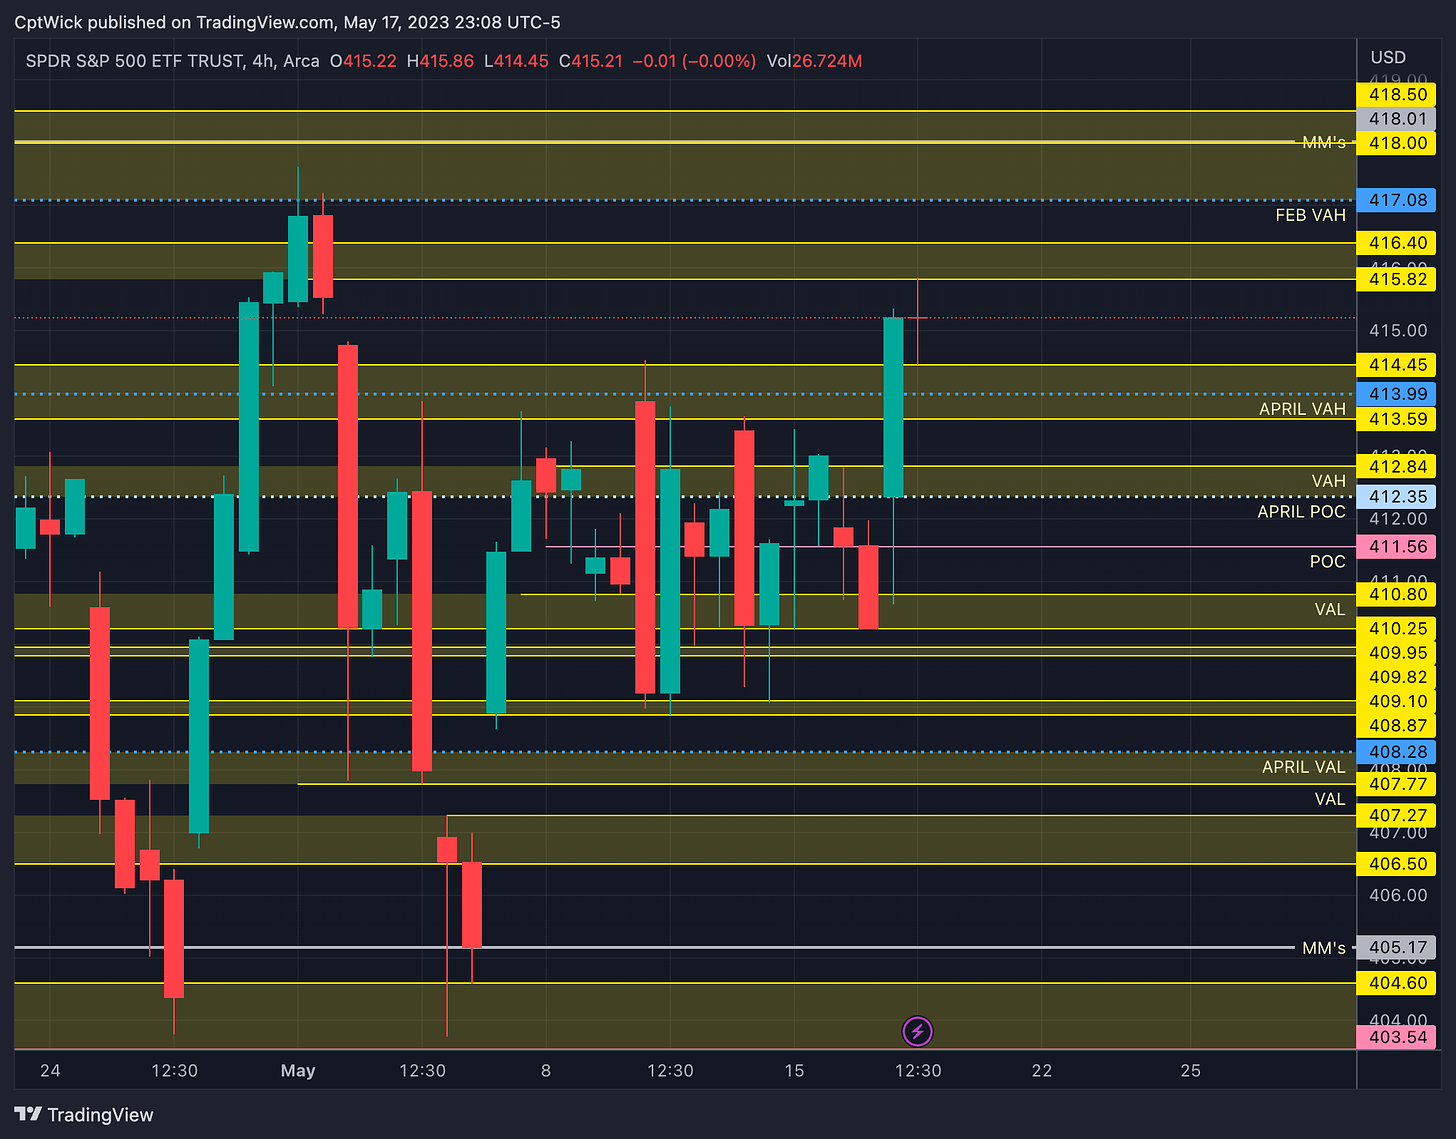
We finally had some movement today, it was news driven of course but we were coming off a double inside day so both sides were trapped, once we broke the last two sessions range we exploded up. Last post I highlighted the “chop zone” (picture below). We are coming into the upper range of this zone. This zone makes trading tough. All this zone is, is just a big ole value area, price is balanced.
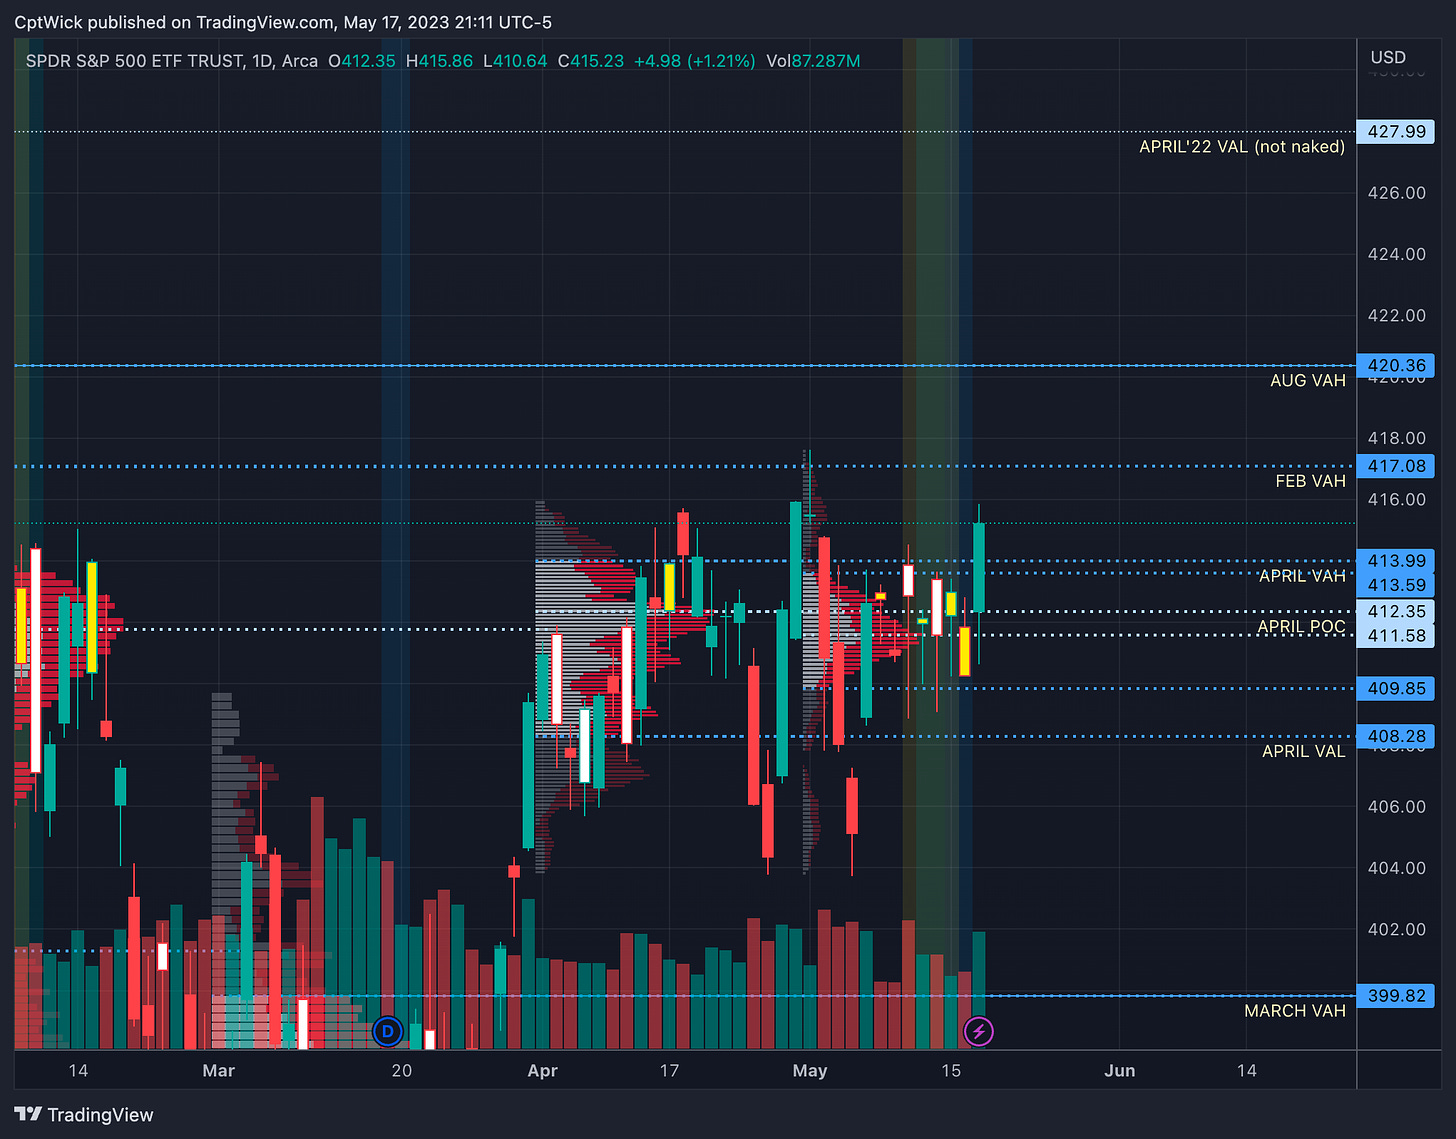
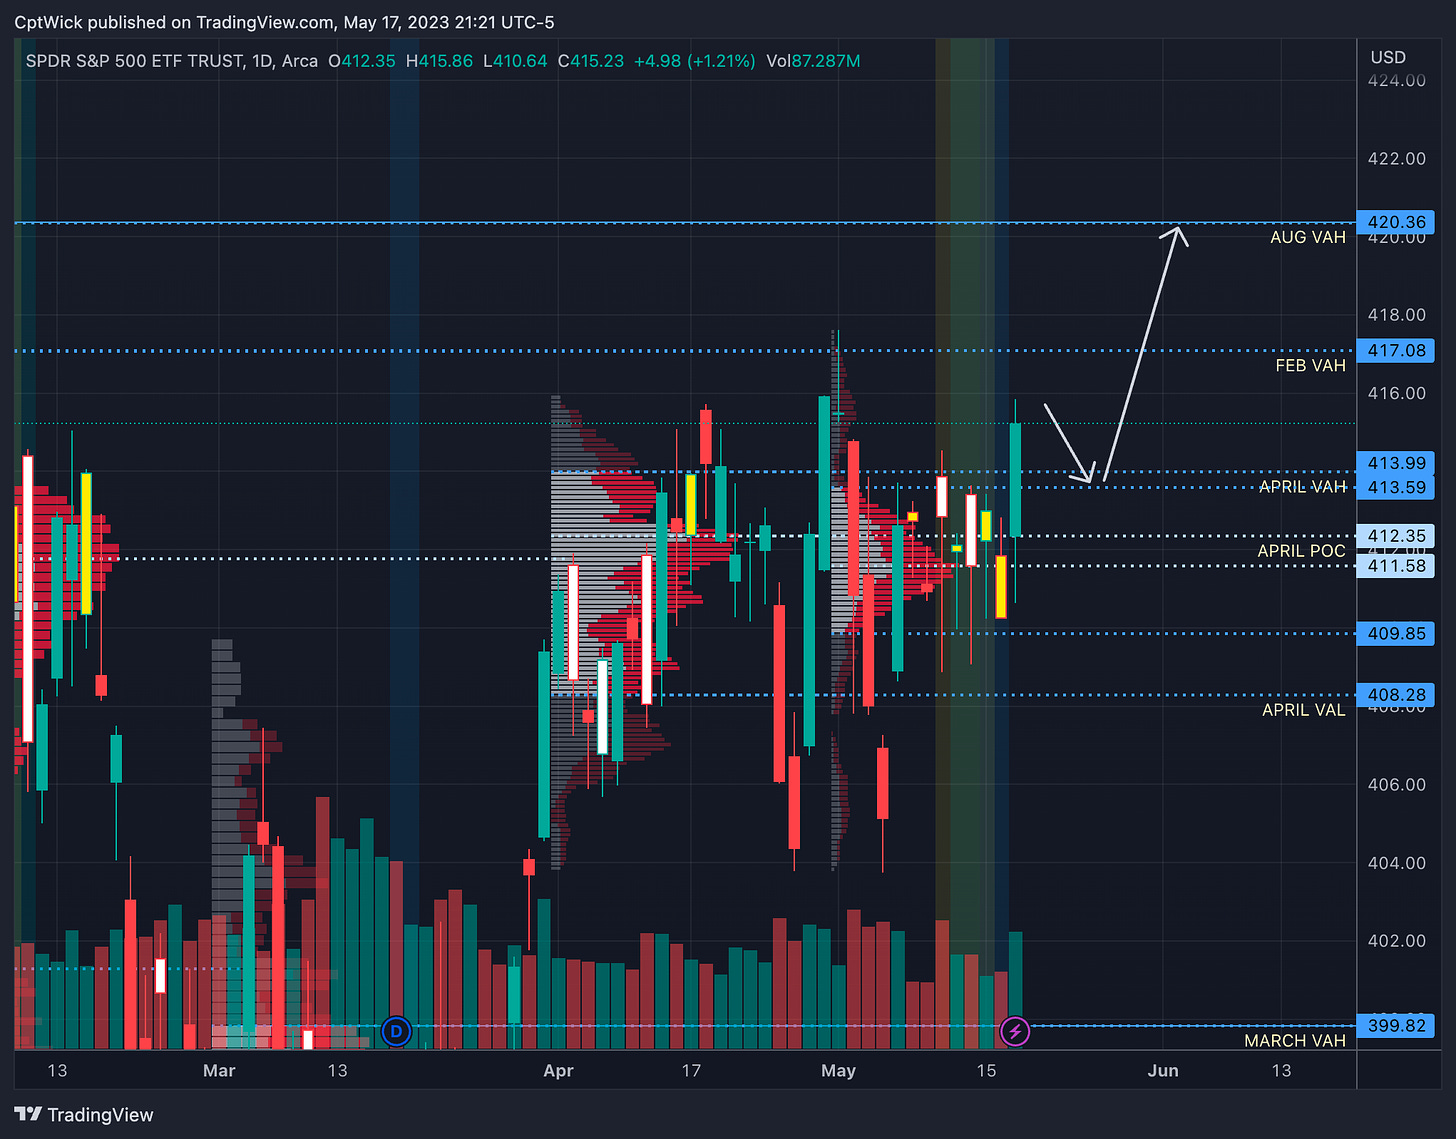
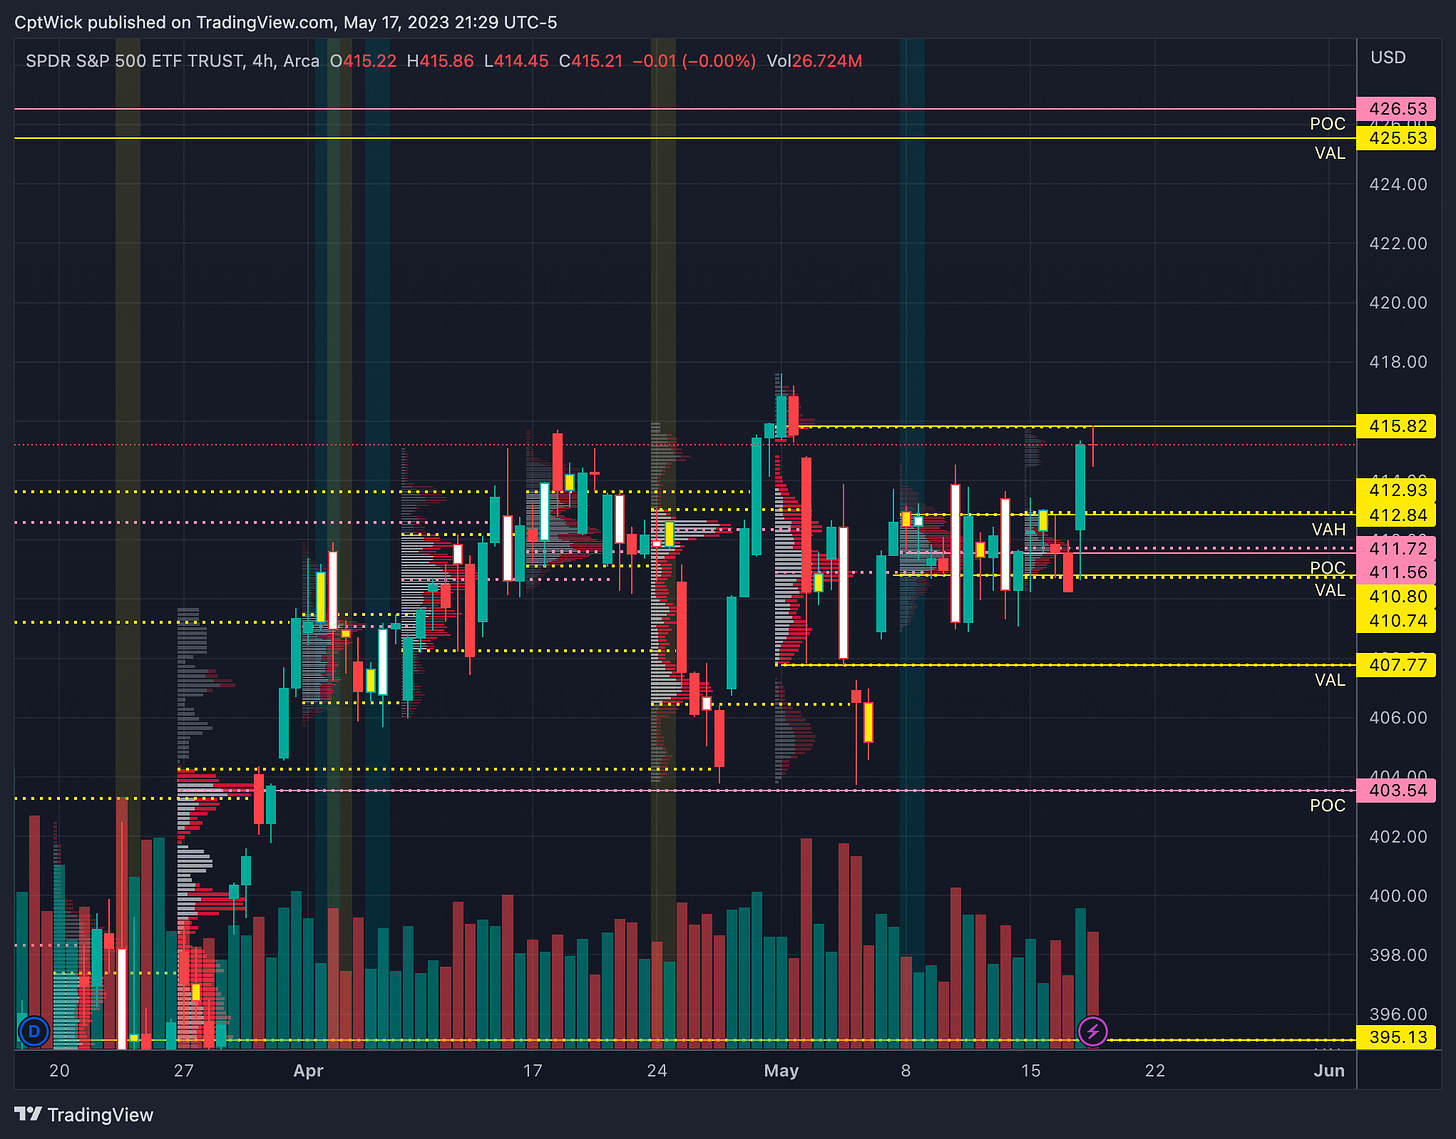
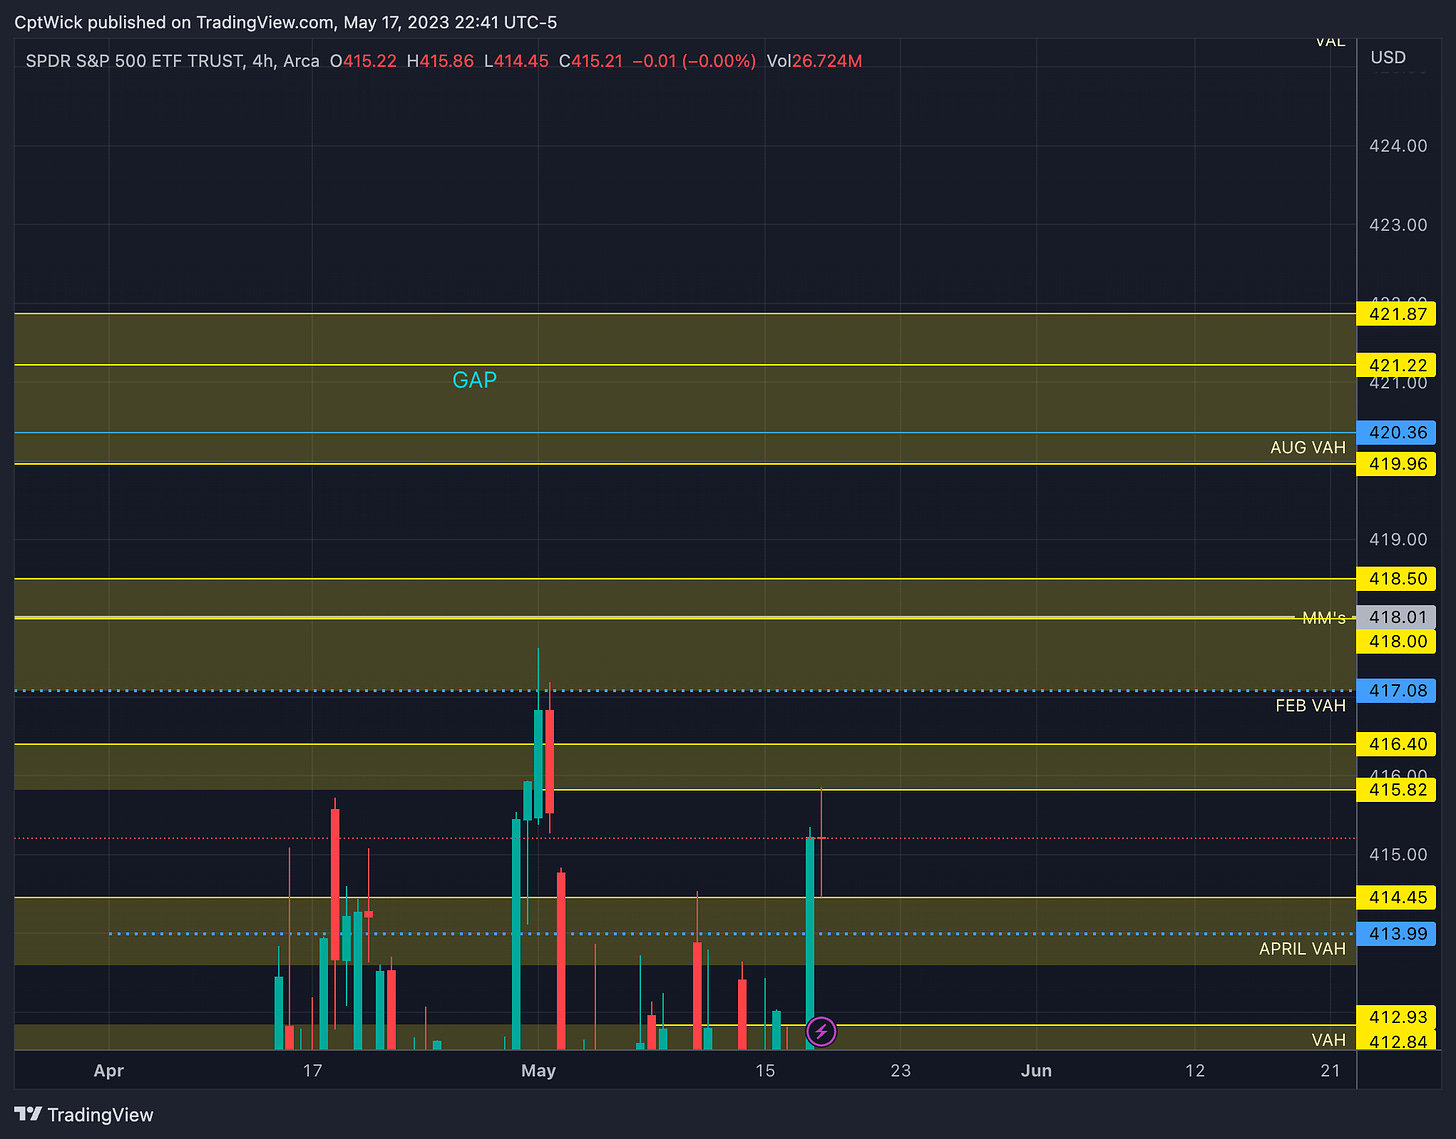
The current monthly profile is showing a May imbalance to the upside. Our current VAH is sitting at 413.59, POC is 411.58, and VAL at 409.85. Remember these values are dynamic so they will change as price and volume change. April’s profile however, it’s set it stone and we broke out above its value area. We could take a crack at Feb’s VAH again as long as 414-413.50 holds. Feb’s VAH at 417.08 has been tested before and failed, that level is no longer naked, but it still holds importance. If we do end up breaking above that area after a second attempt, I would want to target 420.36, Aug 22’ VAH.
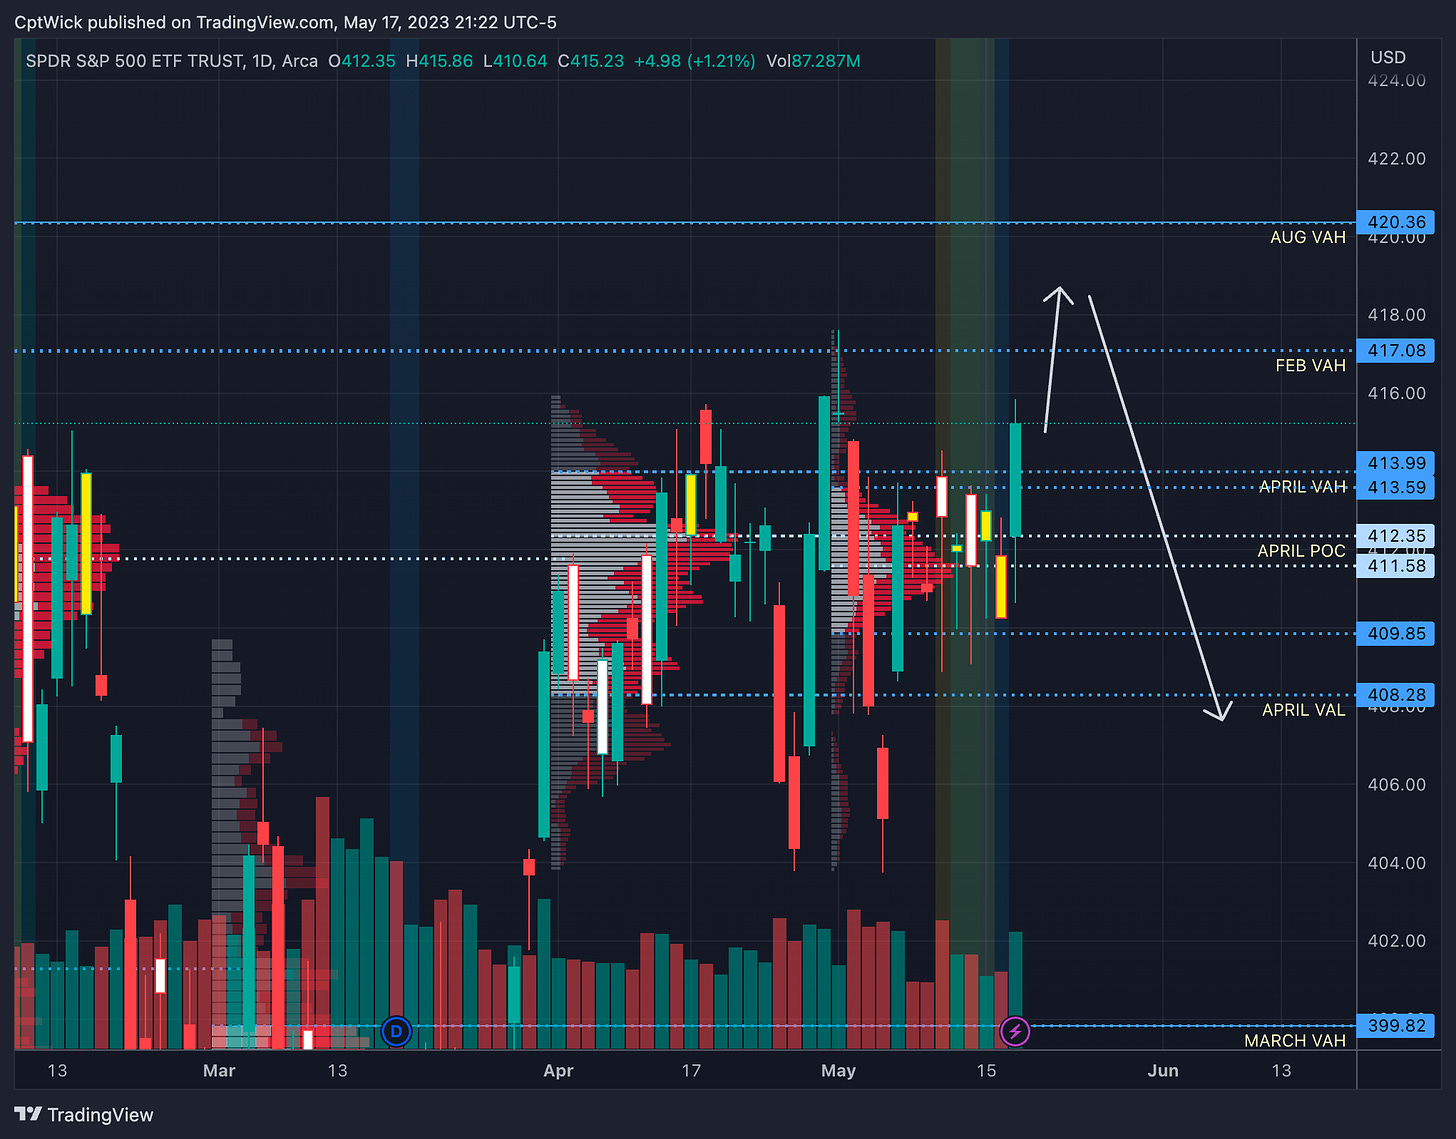
In my “bullish” chart above I think that a small pullback to retest this value area again might be healthy for a stronger move up. Does this happen? Maybe, but this is something that I will be keeping an eye on. In my “bearish” chart above, I think that if the market continues to push up here with no pullback and we fail to get out of the August 2022 value area (above 420.36) we could have a swift selloff and could potentially see price sub 400. If the bears can push price back under 414-413.50 we could see this happen.
On the weekly profile, we pushed above last weeks VAH at 412.84 after we pushed off of last weeks VAL at 410.80, then price ran all the way to the next naked VAH sitting at 415.82 (todays HOD was 415.86), these levels do work. The next naked value area above 415.82 which by the way is no longer naked, is 425.53.
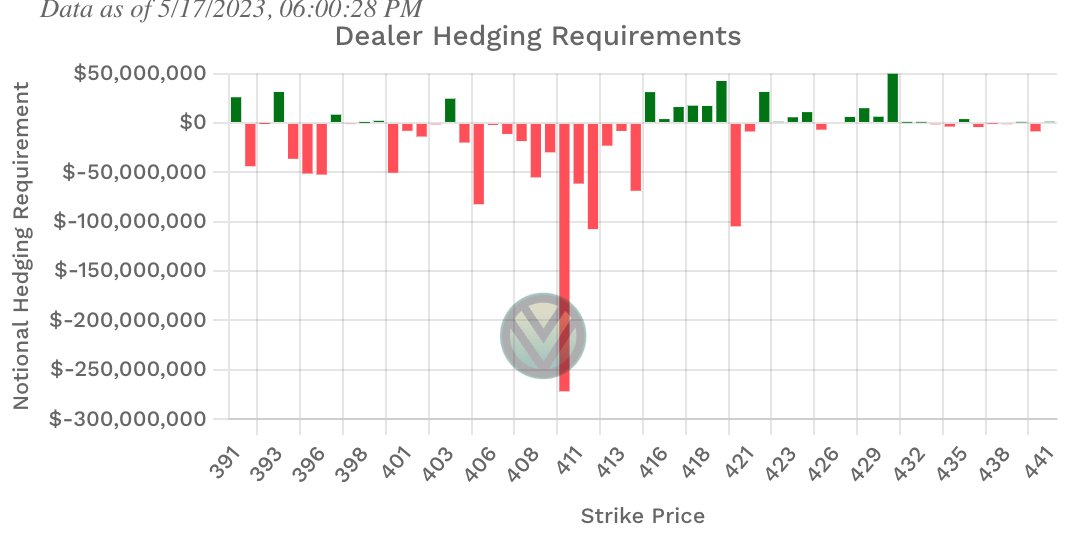
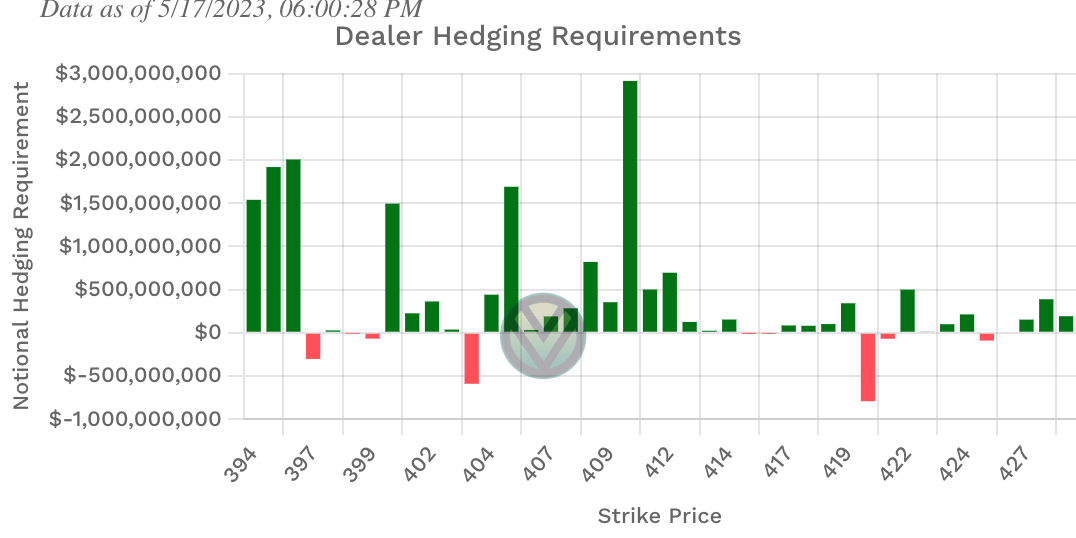
Positive Gamma
422, 419-415, 403
Negative Vanna
421, 420, 403
Key levels above (previous close - 415.23)
415.82-416.40
415.82 is a previous weekly VAH that got tested last session.
415/416 is positive Gamma
417.08, 418.01, 418.50
417.08 was Feb’s VAH
418.01 is the MMs weekly expected high.
417/418 is positive Gamma
419.96, 420.36, 421.22, 421.87
We have a gap in volume from 419.96-421.22
420.36 is Aug 22’ VAH
Key levels below (previous close - 415.23)
414.45, 413.99, 413.59
This is a very key area going forward. As long as price is above this level I will look for a retest of 417-420.
Under 415 we don’t have Gamma support until 403.
413.99 is April’s VAH 413.59 is the current monthly VAH
412.84-412.35
Last weeks VAH and April’s POC (current months POC is 411.58)
411.56
Last weeks POC
410.80-410.25
410.80 is last weeks VAL
409.95, 409.82, 409.10, 408.87
Demand
408.28, 407.77, 407.27
April’s VAL and a naked weekly VAL
Under 407.77 the weekly MMs expected low is 405.17.
Gap in volume from 407.77 to 407.27
Happy Trading,
—WICK—
To cover our basis…
Welcome to my Substack where I provide a daily SPY trading plan to help guide my intraday trading. The purpose of this letter is not to advice you on your trading or investment decisions. I am simply documenting my daily trading plan for myself to help with planning and execution. These are simply my opinions and the data sourced from the likes of vol.land, TradingView, Quantdata.us and others. The stock market is risky, gains are not guaranteed. This is not about getting rich quick, but learn to educate yourself and make the necessary financial decisions on your own. This is not financial advice.

