Readers,
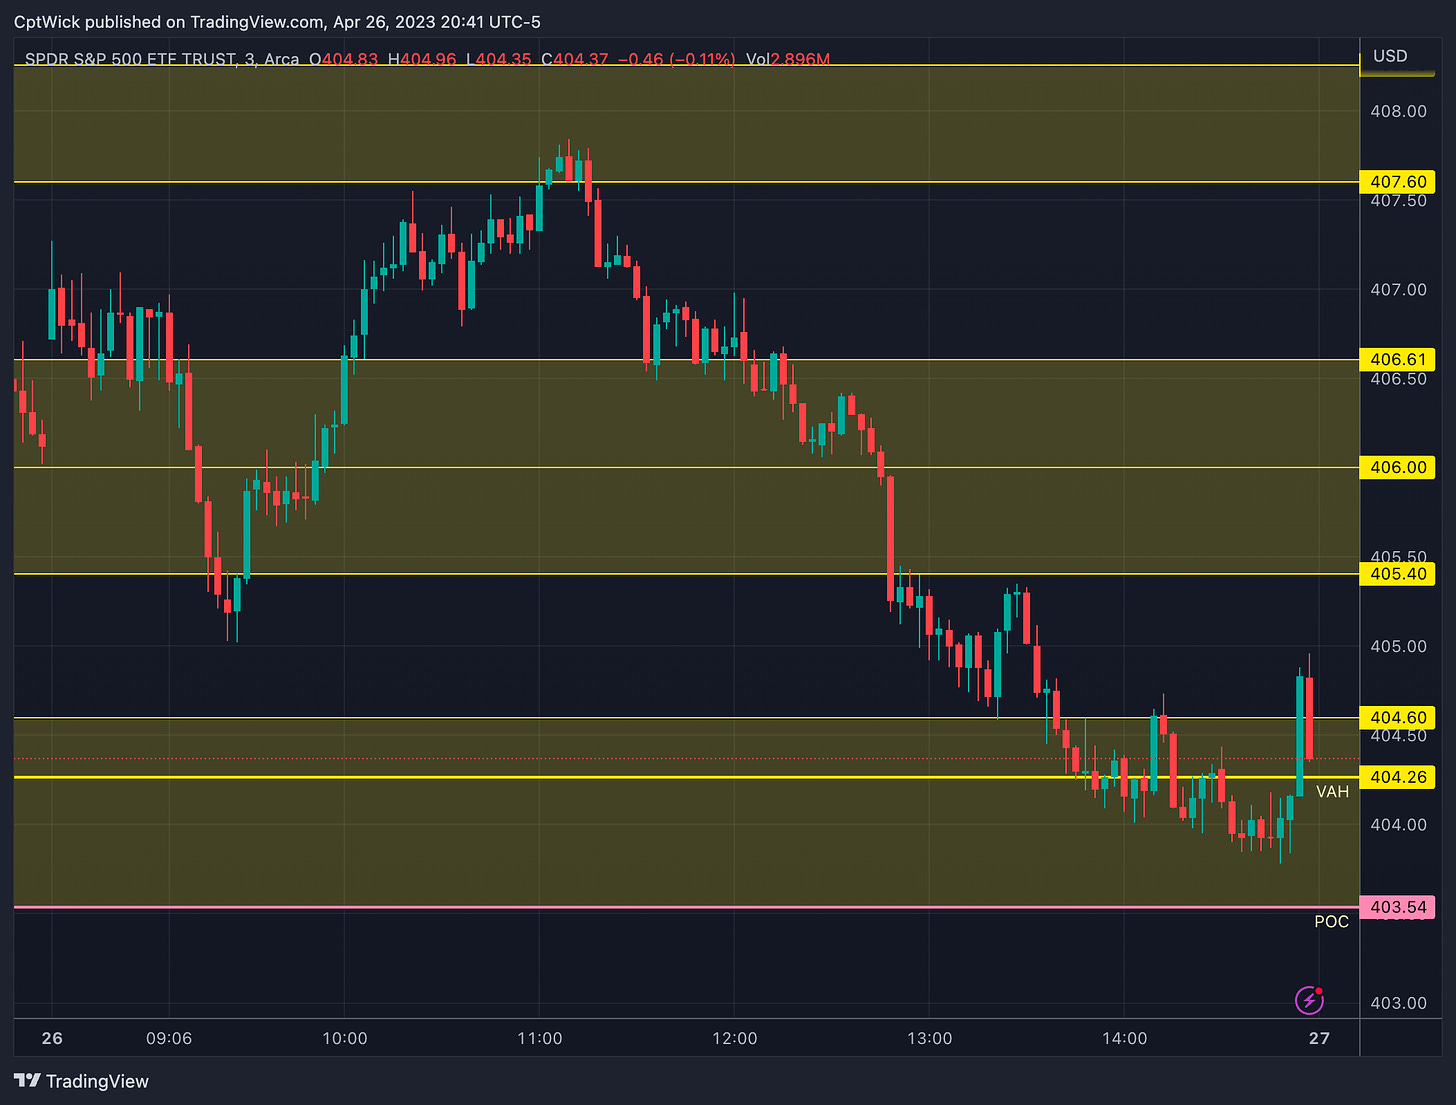
Our levels were pretty dang good today from last nights plan. The morning selloff seemed like they just lured us to sleep just wondering if that 406.61 level was going to act as support or turn into resistance. We made an attempt to blow past 405.40 but the buyers came in and drove us back up to new highs on the day when the sellers appeared at 407.60. New made it all the way down to the next weekly value area at 404.26. We did end up rallying back above that VAH and we closed above it.
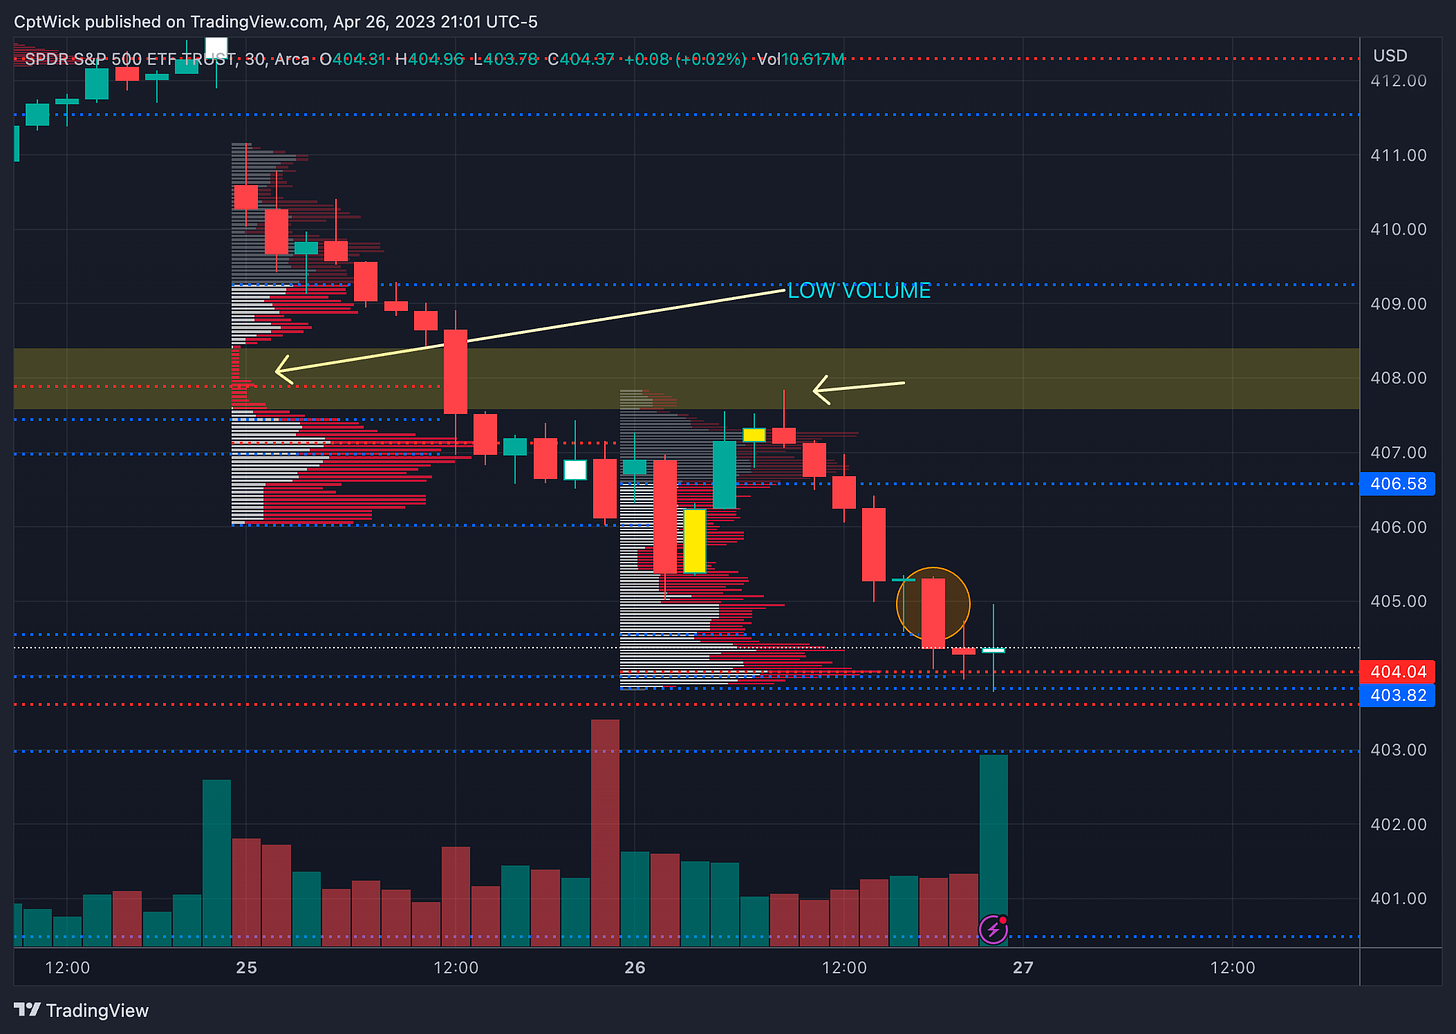
I want to share a intraday chart of the session profile on a 30min timeframe just to show you how powerful it is knowing where the volume is or knowing where the LACK of volume is.
The red dotted lines are naked POC’s, this means that when that level formed on a session, it has not been revisited. The blue dotted lines are naked value area highs and lows. Notice how the previous session 4/25 made a nice low volume area around 407.60ish area that we had highlighted as a key level in 4/26’s trade plan. Today when price came into this level the sellers continued. I have that one candle circled towards the end of the session because the POC was up around 407-406.60 until that candle, and you can see the bulk of the volume was originally up there but shifted down fast. On the bigger timeframe we were also bouncing off that previous weekly VAH at 404.26.
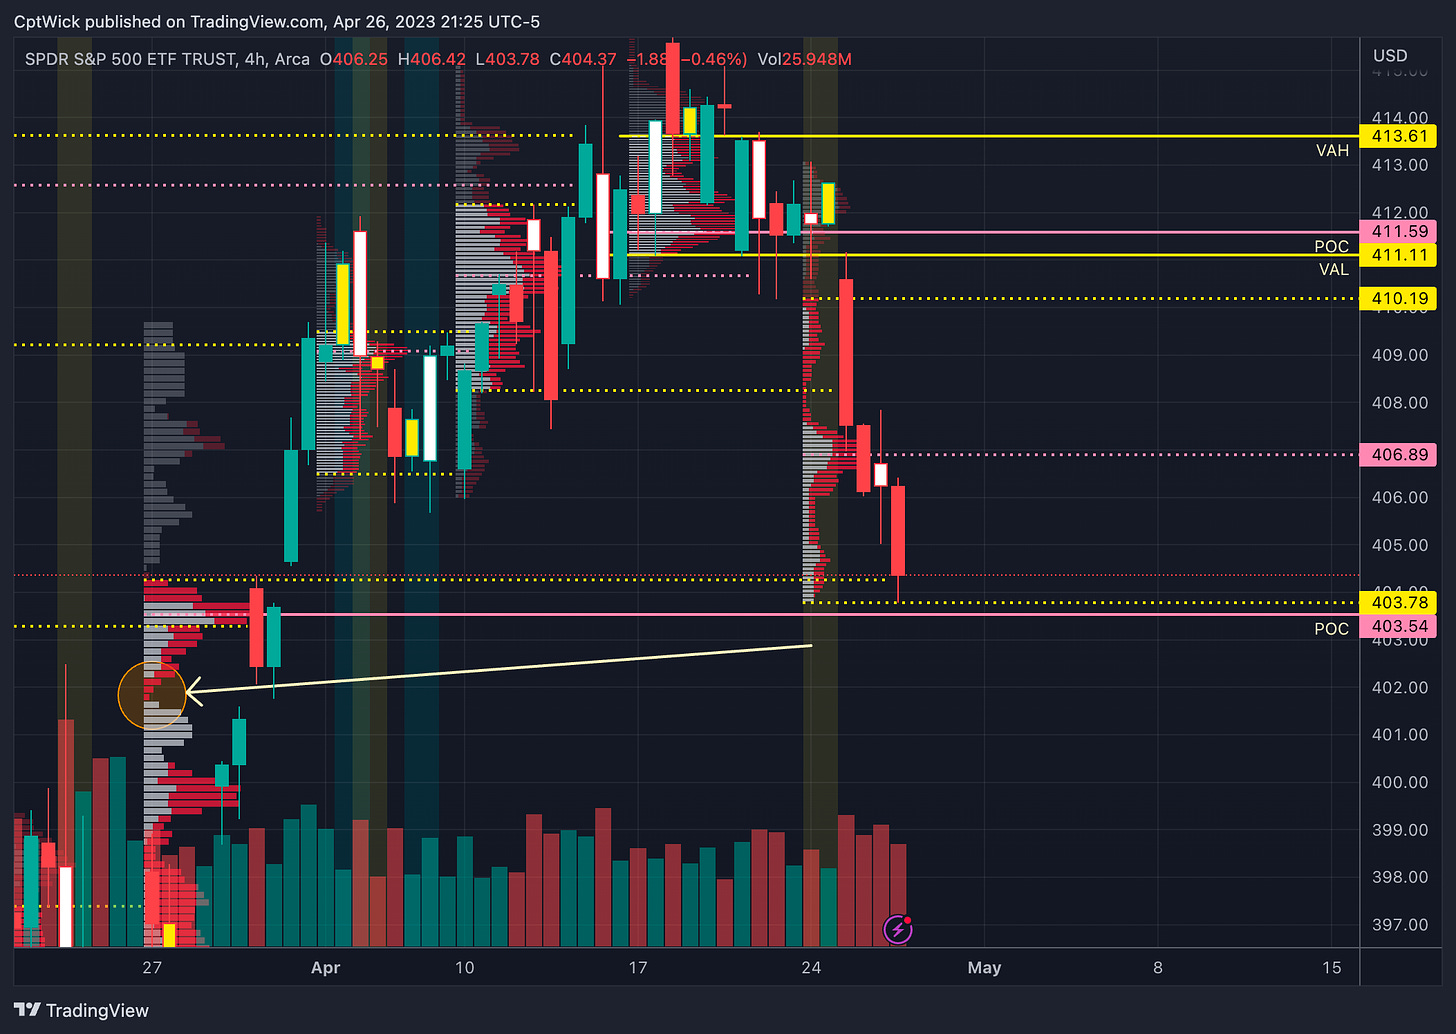
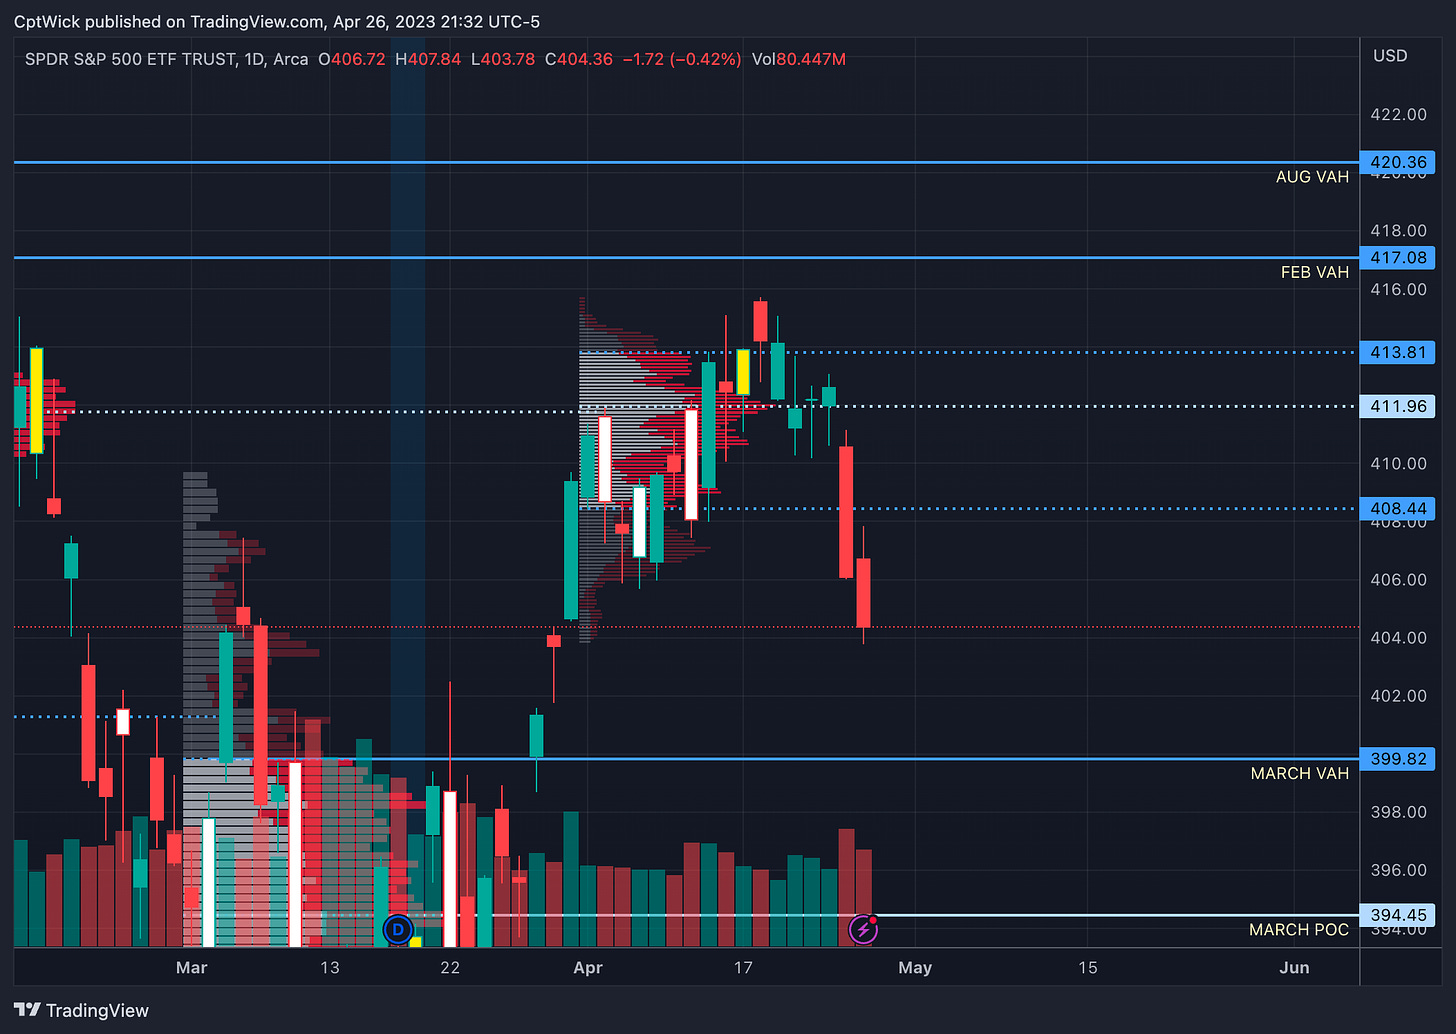
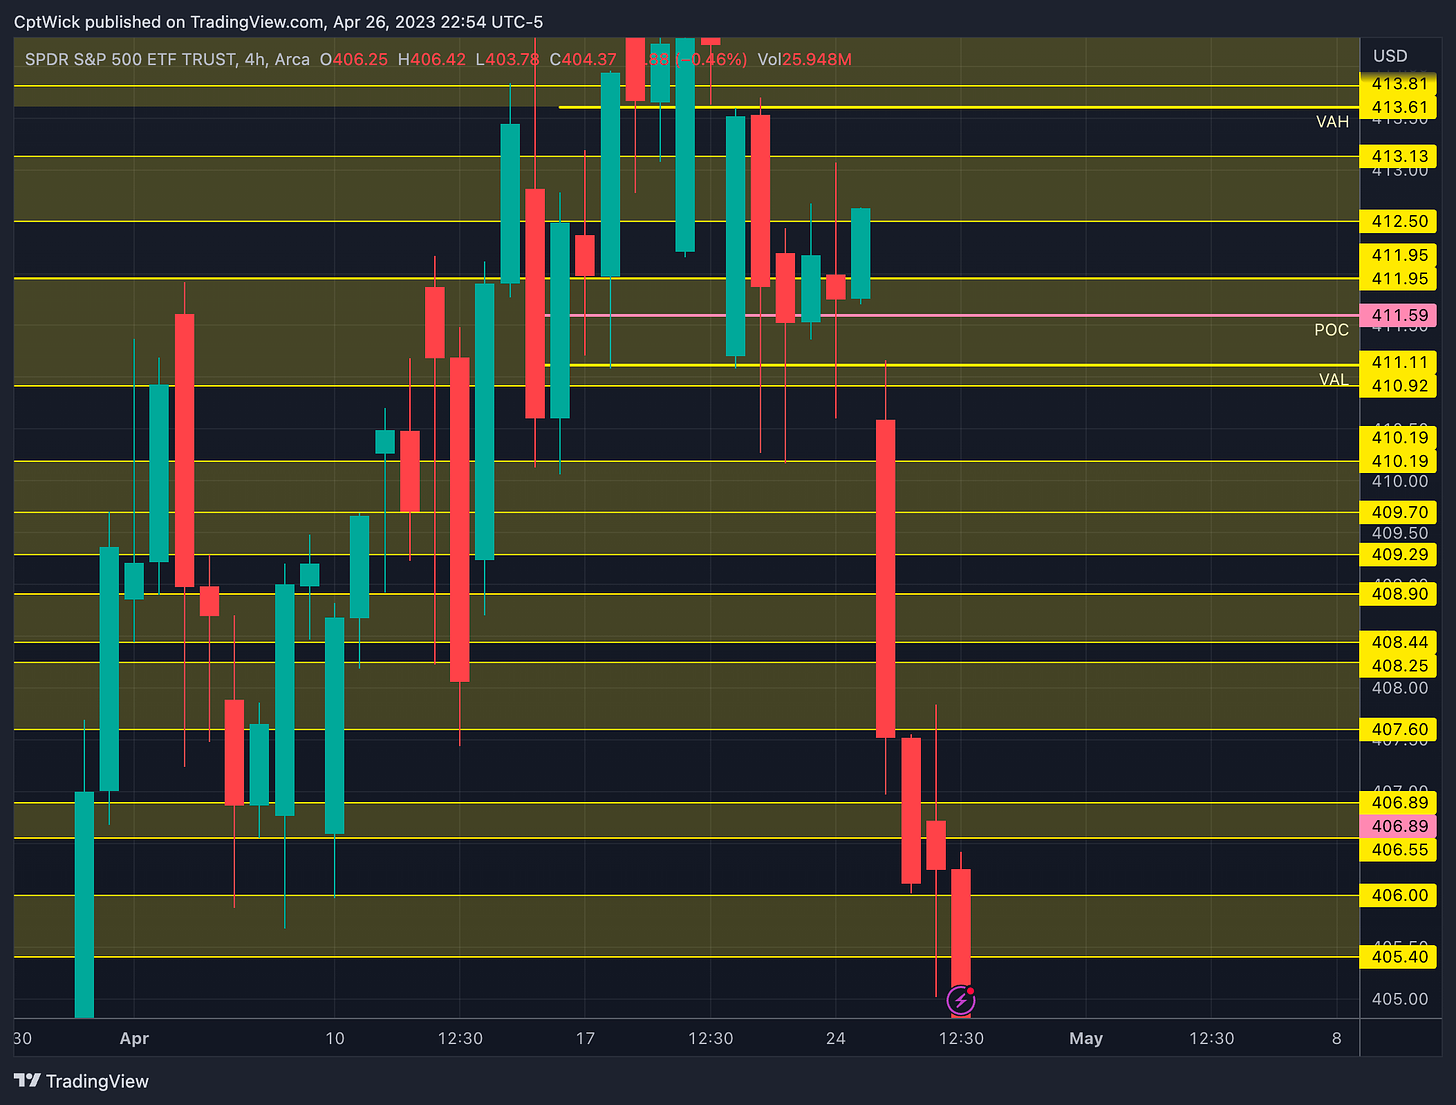
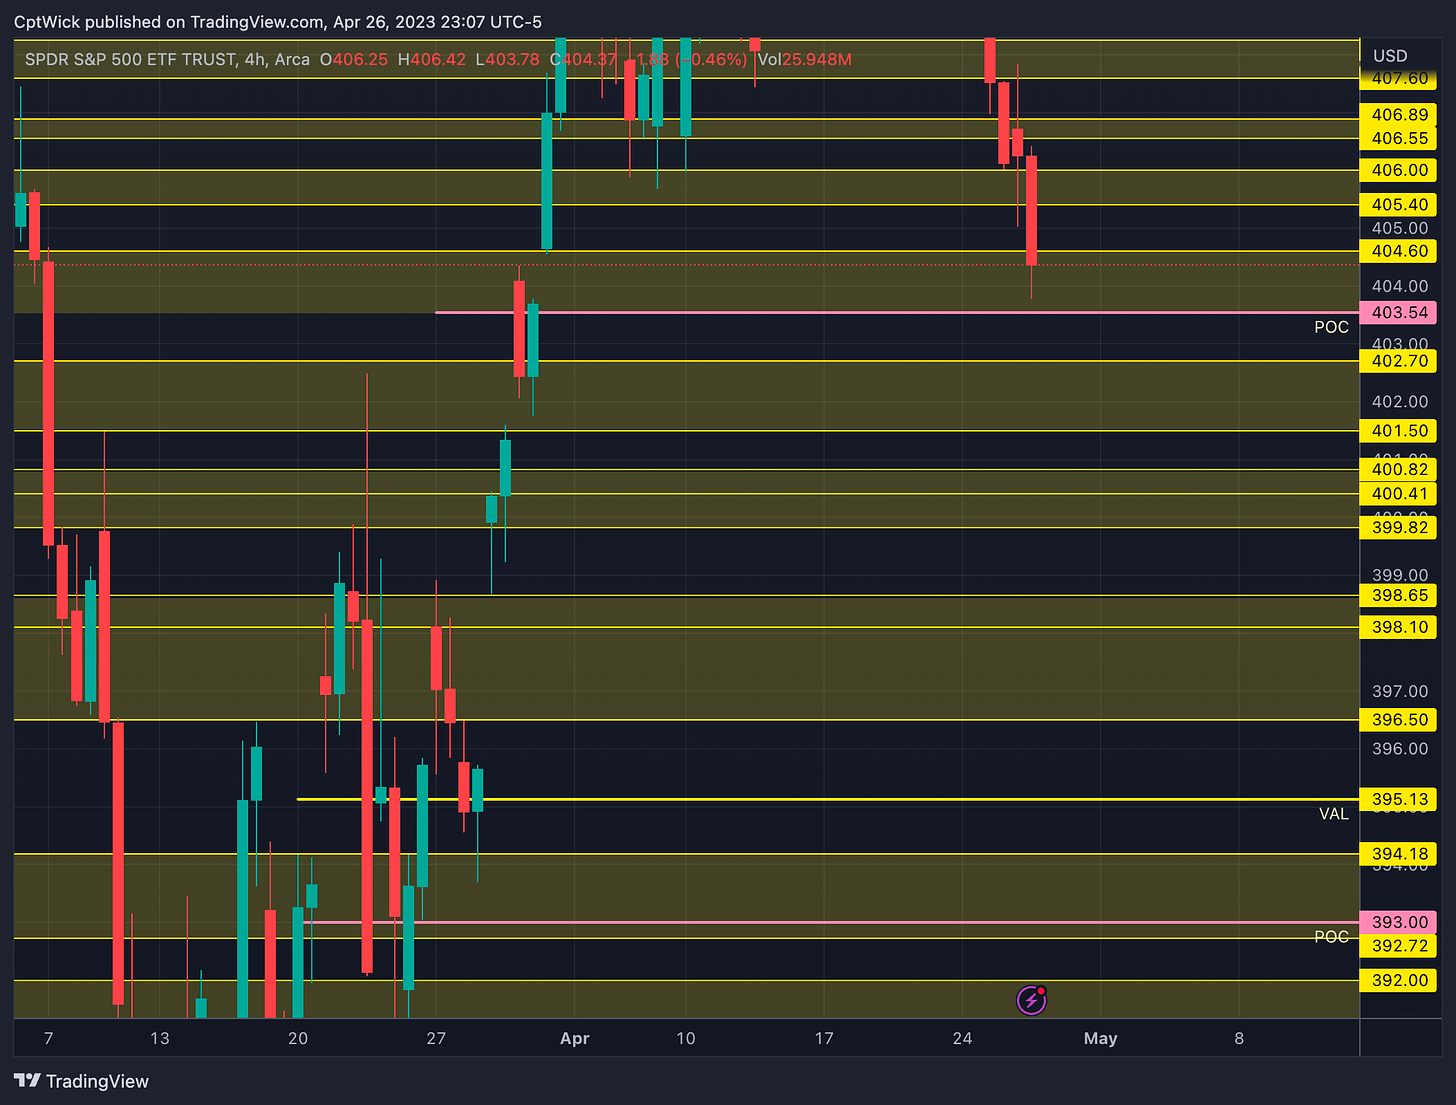
On the weekly profile, we dipped into the value area at 404.26 but we closed above it leaving the POC naked at 403.54, our current VAL is sitting at 403.78 and the close was 404.36. If we lose 403.54 tomorrow we could potentially find support or intermediate support at the LVN circled on the left, it also left a gap in the 4hr timeframe.
The monthly volume profile is looking similar to how it did last session. The VAH is the same at 413.81, the POC is the same, and the VAL moved down .45 to 408.44. We are still at a monthly imbalance down.
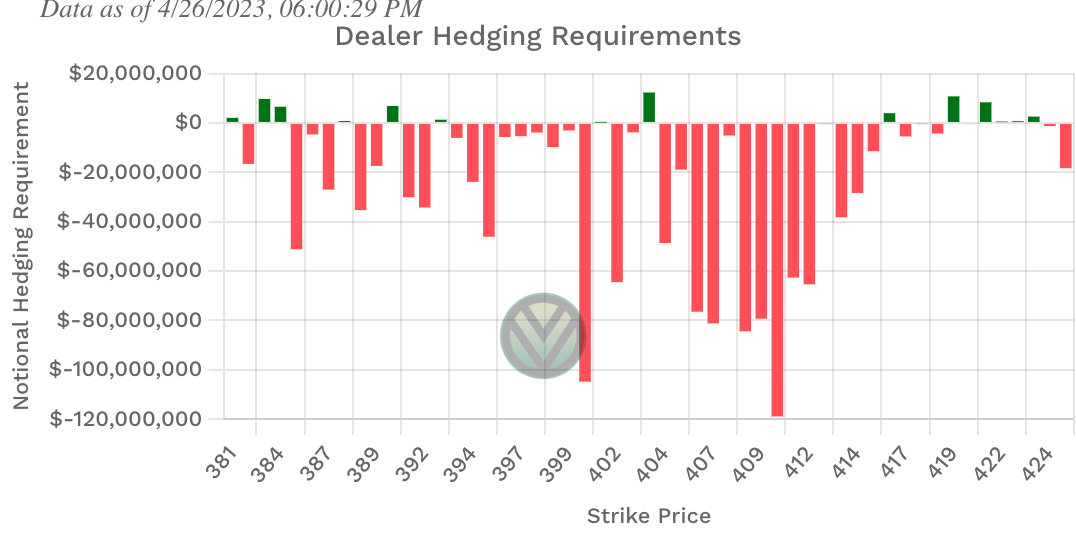
Positive Gamma
416, 403, 390
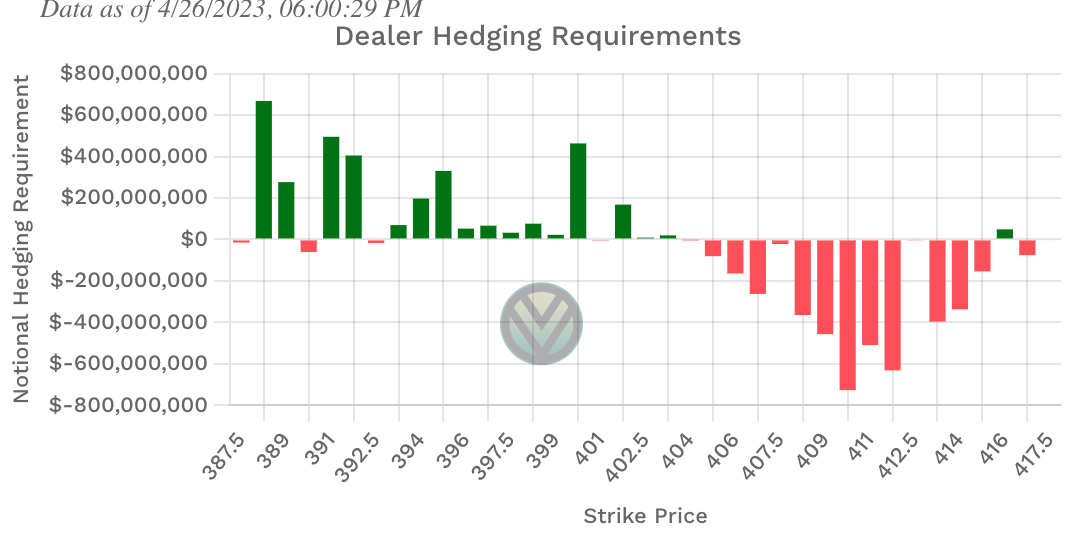
Negative Vanna
417, 405-415, 392.50, 390
Key Levels Above (previous close - 404.36
404.60, 405.40, 406
405/406 negative Vanna
406.55 - 406.89
Supply
406.89 is the current weekly POC
407.60, 408.25, 408.44, 408.90
Negative Vanna
408.44 is the current monthly VAL
409.29, 409.70, 410.19
409/410 negative Vanna
Supply
410.19 is the current weekly VAH
411.11, 411. 59, 411.95, 412.12
411.11 last weeks VAL
411.59 last weeks POC
411.95 current monthly POC
Key Levels Below (previous close - 404.36
404.26, 403.78, 403.54
404.26 was a previous naked VAH (fresh value area, no longer naked)
403.78 current weekly VAL
403.54 naked weekly POC.
This area is do or die for the bulls IMO, losing those opens us up to 395 potentially. (VAL of this value area)
403 Positive Gamma
402.70 - 401.50
Demand
400.82, 400.41, 399.82
399.82 March VAH
Follow me on Twitter if something I see is important I usually post it there!
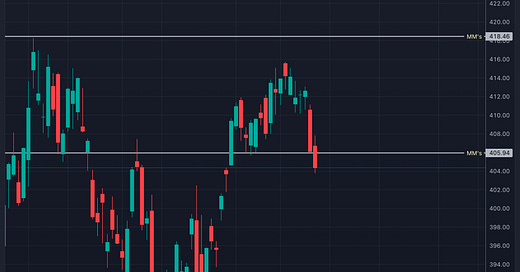
One more quick chart, the market makers move update! We are now under that lower expected target. It will be interesting to see if they pull us back, or continue to push us down.
Happy Trading,
—WICK—
To cover our basis…
Welcome to my Substack where I provide a daily SPY trading plan to help guide my intraday trading. The purpose of this letter is not to advice you on your trading or investment decisions. I am simply documenting my daily trading plan for myself to help with planning and execution. These are simply my opinions and the data sourced from the likes of vol.land, TradingView, Quantdata.us and others. The stock market is risky, gains are not guaranteed. This is not about getting rich quick, but learn to educate yourself and make the necessary financial decisions on your own. This is not financial advice.

