Readers,
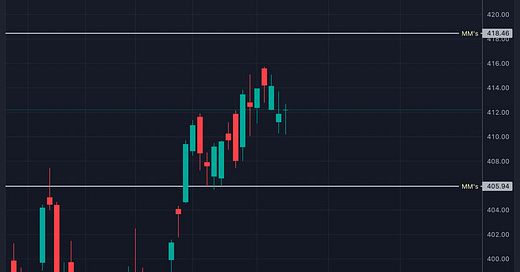
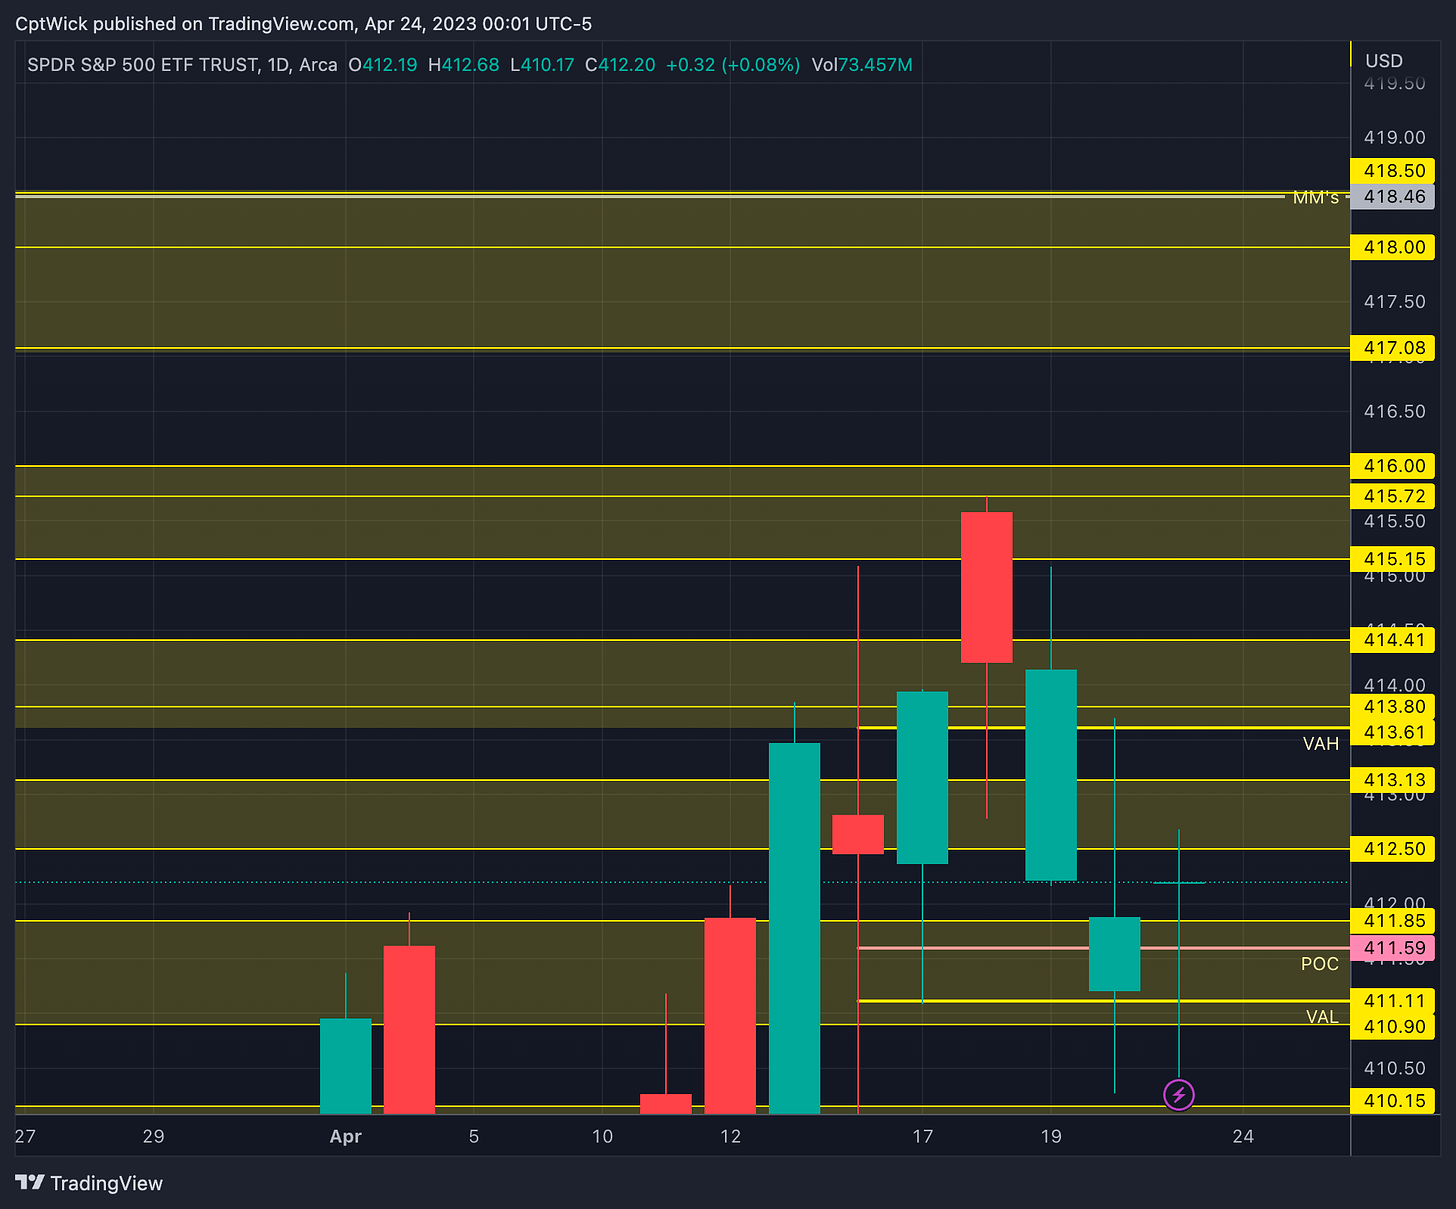
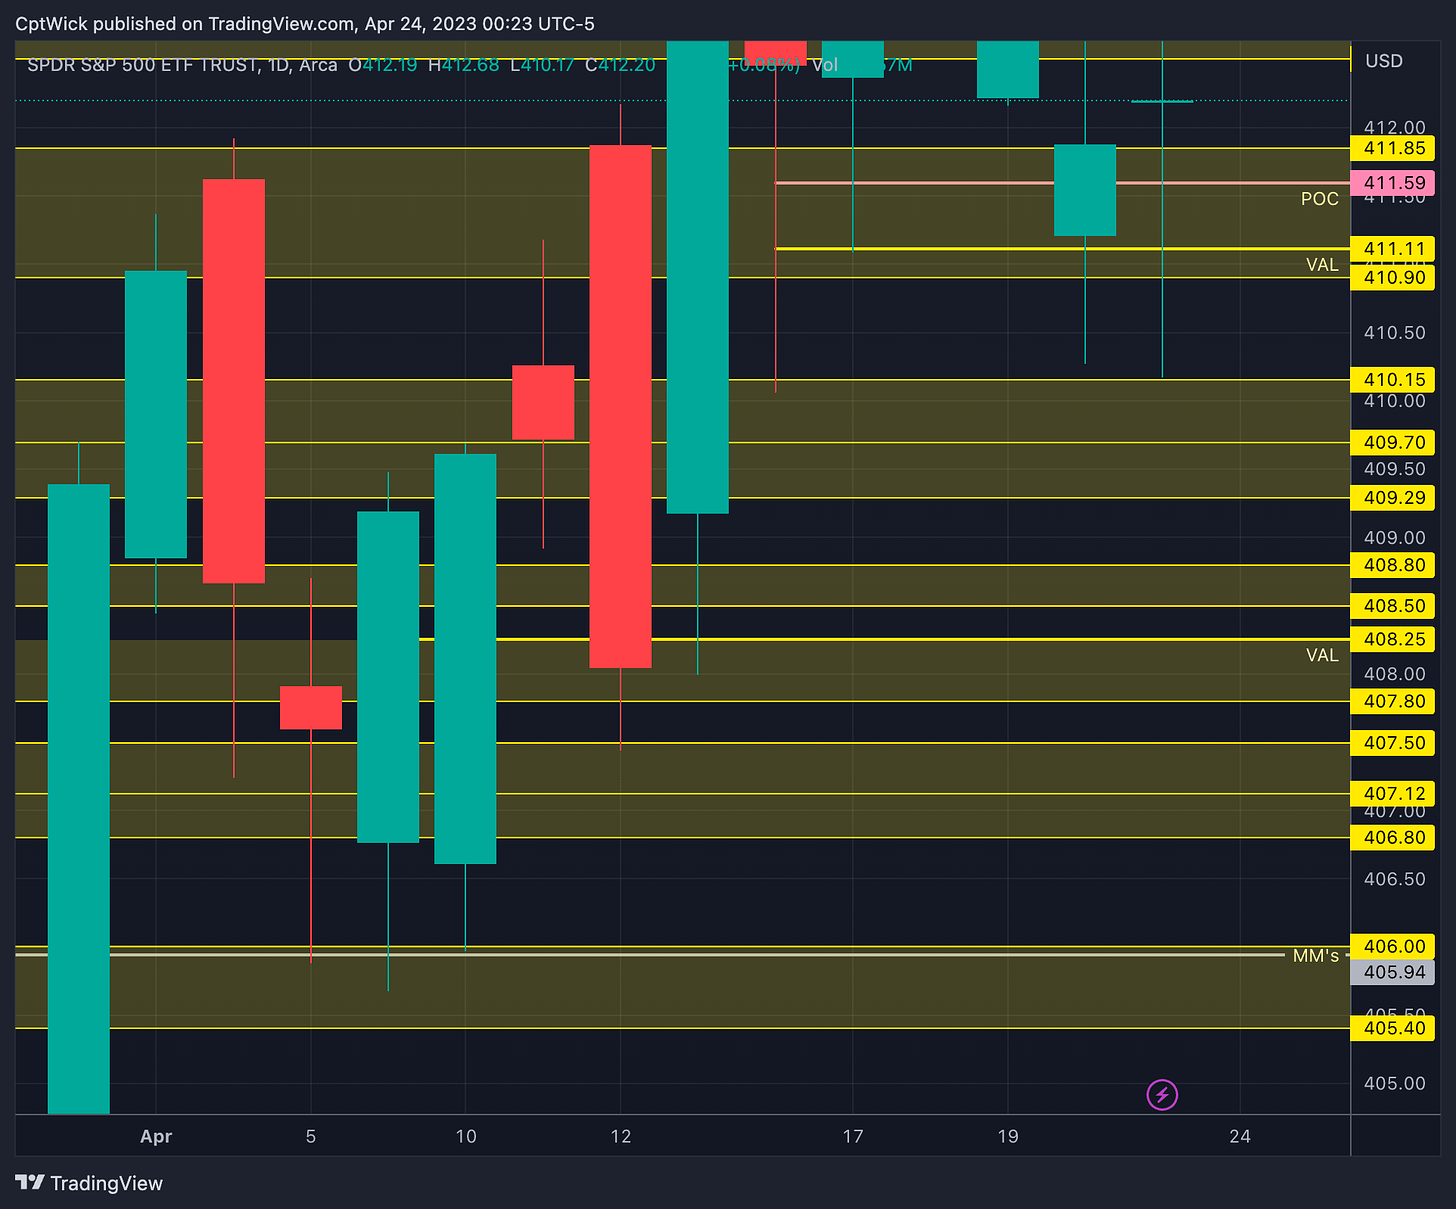
The market makers are expecting a weekly move of $6.26 in SPY. That gives us a upper range of 418.46 and a lower range of 405.94.
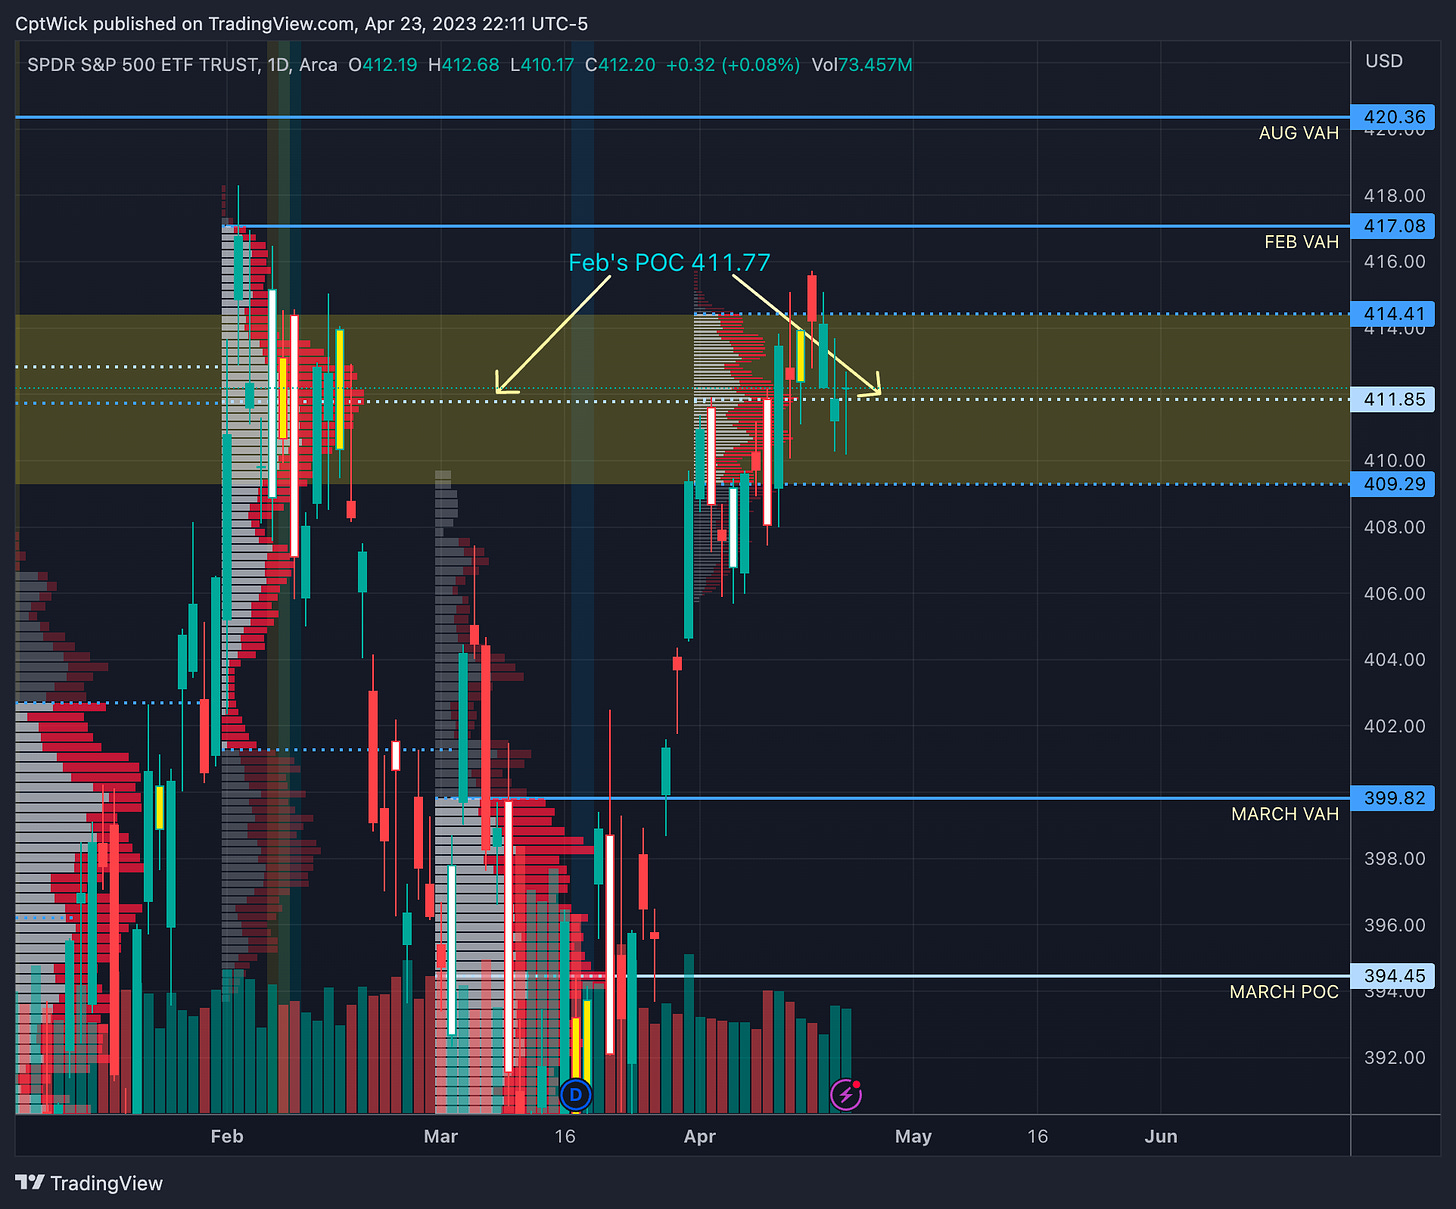
We are headed into the last week of April. Take a look at how April’s profile is shaping up. It looks very very similar to February's. we currently have a POC of 411.85 and Feb’s was 411.77. This range from 414.41 (current VAH), and 409.29 (current VAL), can be harder to trade, expect chop within this box. Ideally we need to leave this zone and create a imbalance above or below. We are so close to Feb’s VAH at 417.08, the bears are putting up a fight, will they defend?
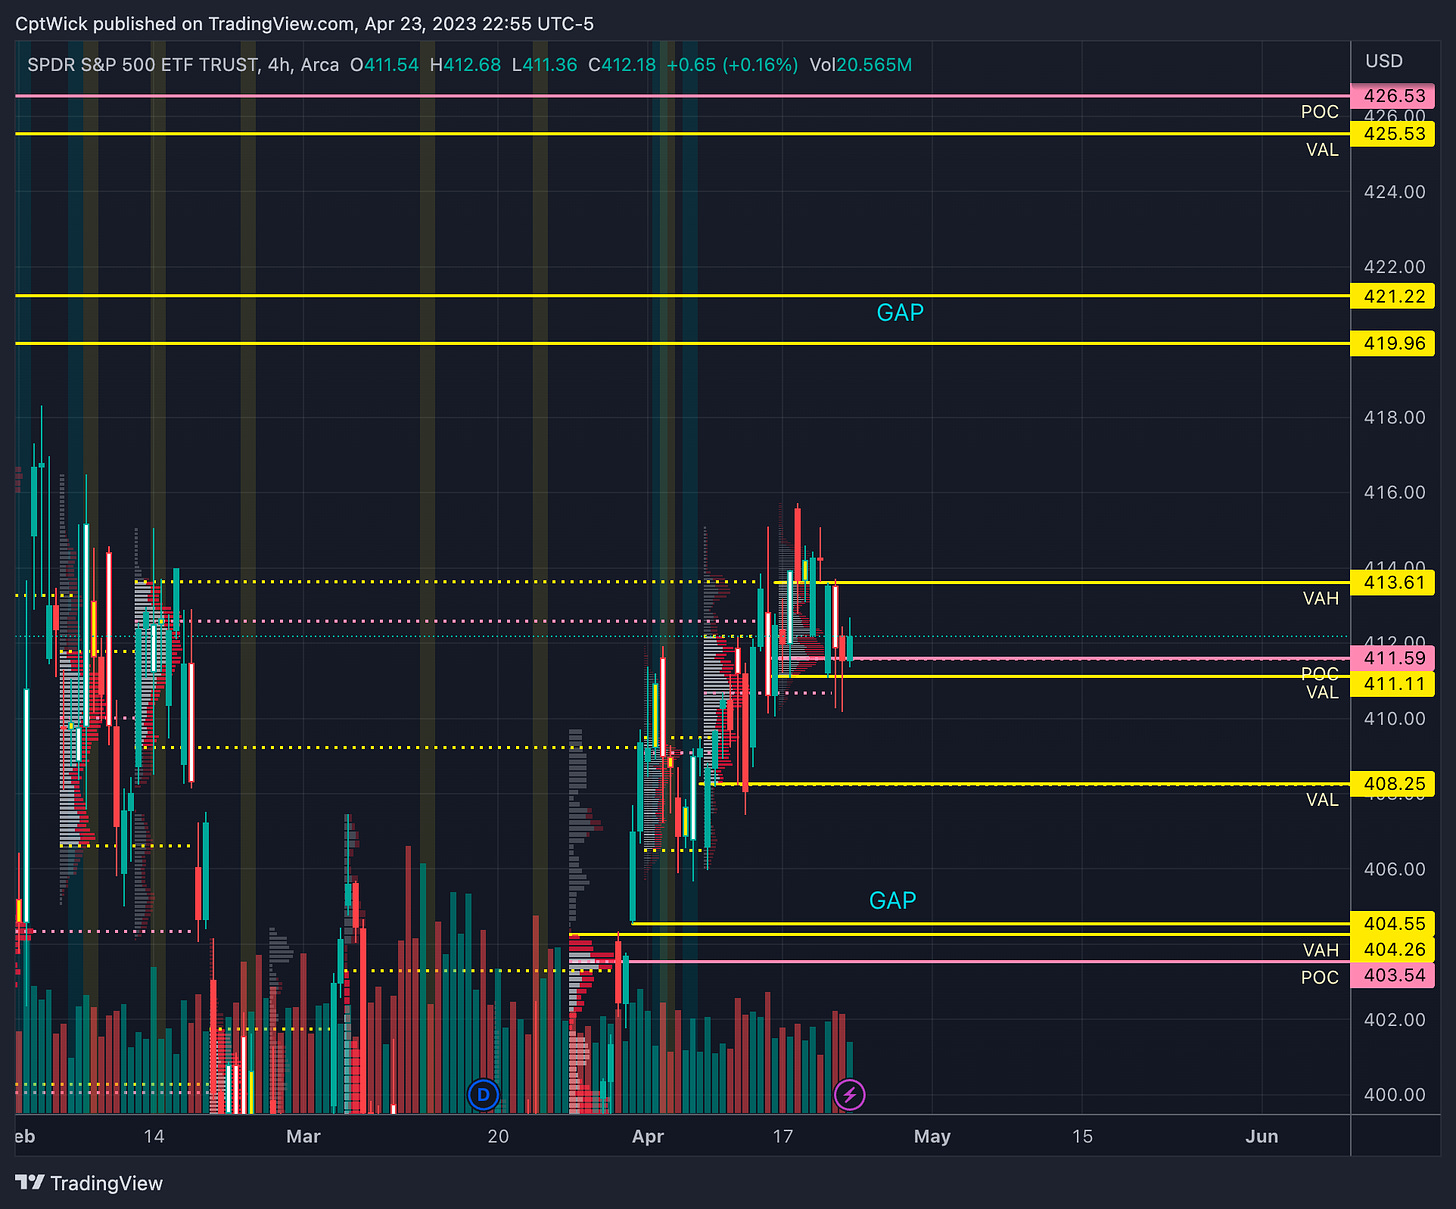
Last weeks VAH was 412.17, and it was a very key level last week same with last weeks POC at 410.67.
This week the VAH comes in at 413.61, the POC at 411.59, and a VAL of 411.11. We do have weekly gaps at 419.96 - 412.22 and at 404.55 - 404.35
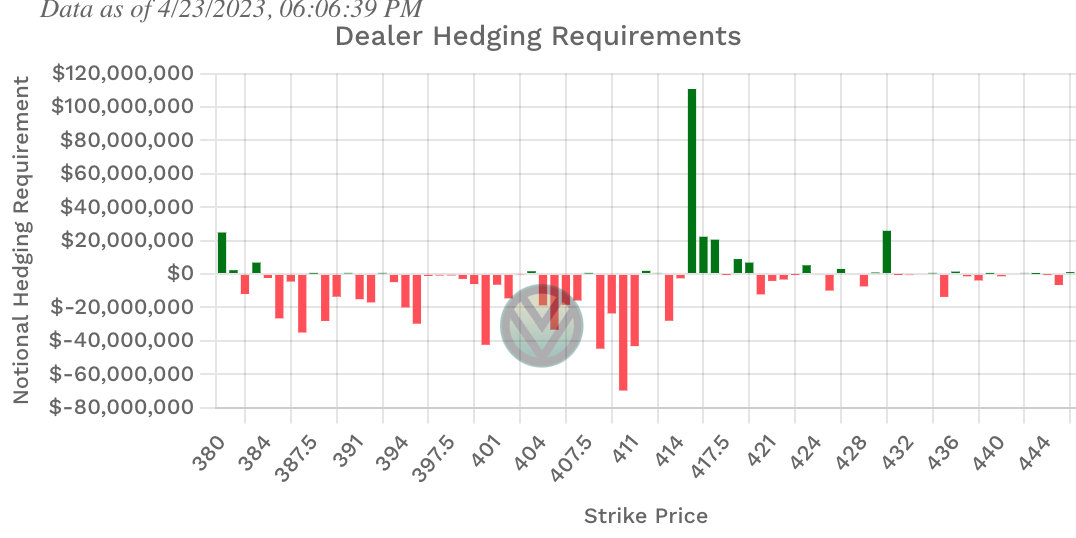
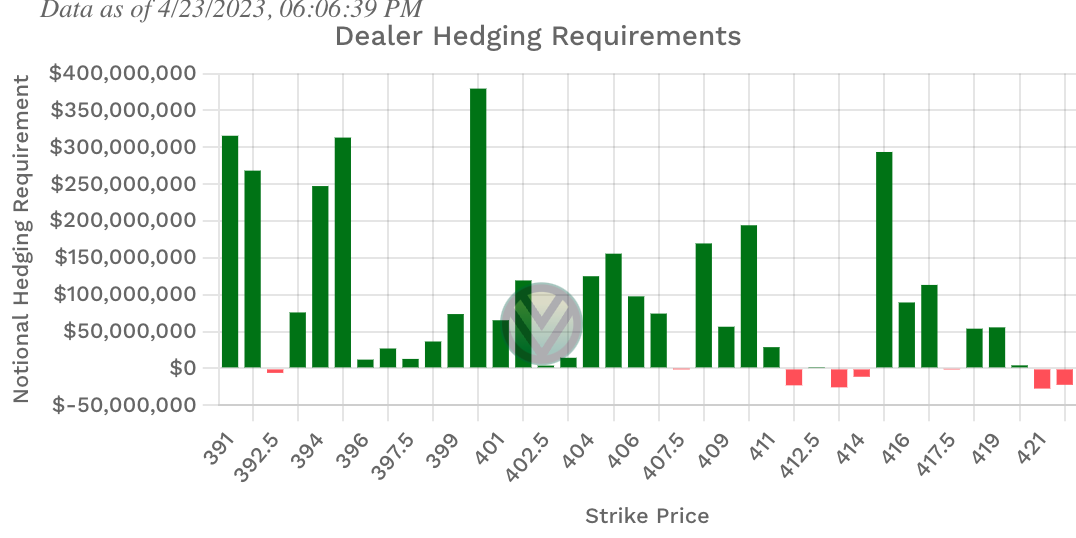
Positive Gamma
423, 419-415, 412, 407.50, 403, 383, 380
Negative Vanna
422, 421, 414, 413, 412, 392.50
Key Levels Above (previous close 412.20)
412.50-413.13
412 negative Vanna and positive Gamma
413 negative Vanna
413.61-414.41
413.61 last weeks VAH
414 negative Vanna
414.41 current monthly VAH
415.15, 415.72-416
415 positive Gamma
417.08-418.50
417/418 positive Gamma
417.08 is Feb’s VAH
418.46 is the weekly MMs expected high
Key Levels Below (previous close 412.20)
411.85, 411.59, 411.11, 410.90
411.85 is the current monthly POC
411.59 is last weeks POC
411.11 is last weeks VAL
412 negative Vanna/postive Gamma
410.15, 409.70, 409.29
409.29 current monthly VAL
408.80, 408.50, 408.25, 407.80
408.25 is a naked VAL
407.50, 407.12, 406.80
407.50 positive Gamma (close to 0 Gamma)
406-405.94, 405.40
405.94 is the weekly MMs expected low
Happy Trading,
—WICK—
To cover our basis…
Welcome to my Substack where I provide a daily SPY trading plan to help guide my intraday trading. The purpose of this letter is not to advice you on your trading or investment decisions. I am simply documenting my daily trading plan for myself to help with planning and execution. These are simply my opinions and the data sourced from the likes of vol.land, TradingView, Quantdata.us and others. The stock market is risky, gains are not guaranteed. This is not about getting rich quick, but learn to educate yourself and make the necessary financial decisions on your own. This is not financial advice.



How Can I copy your chart to Tradingview?