Readers,
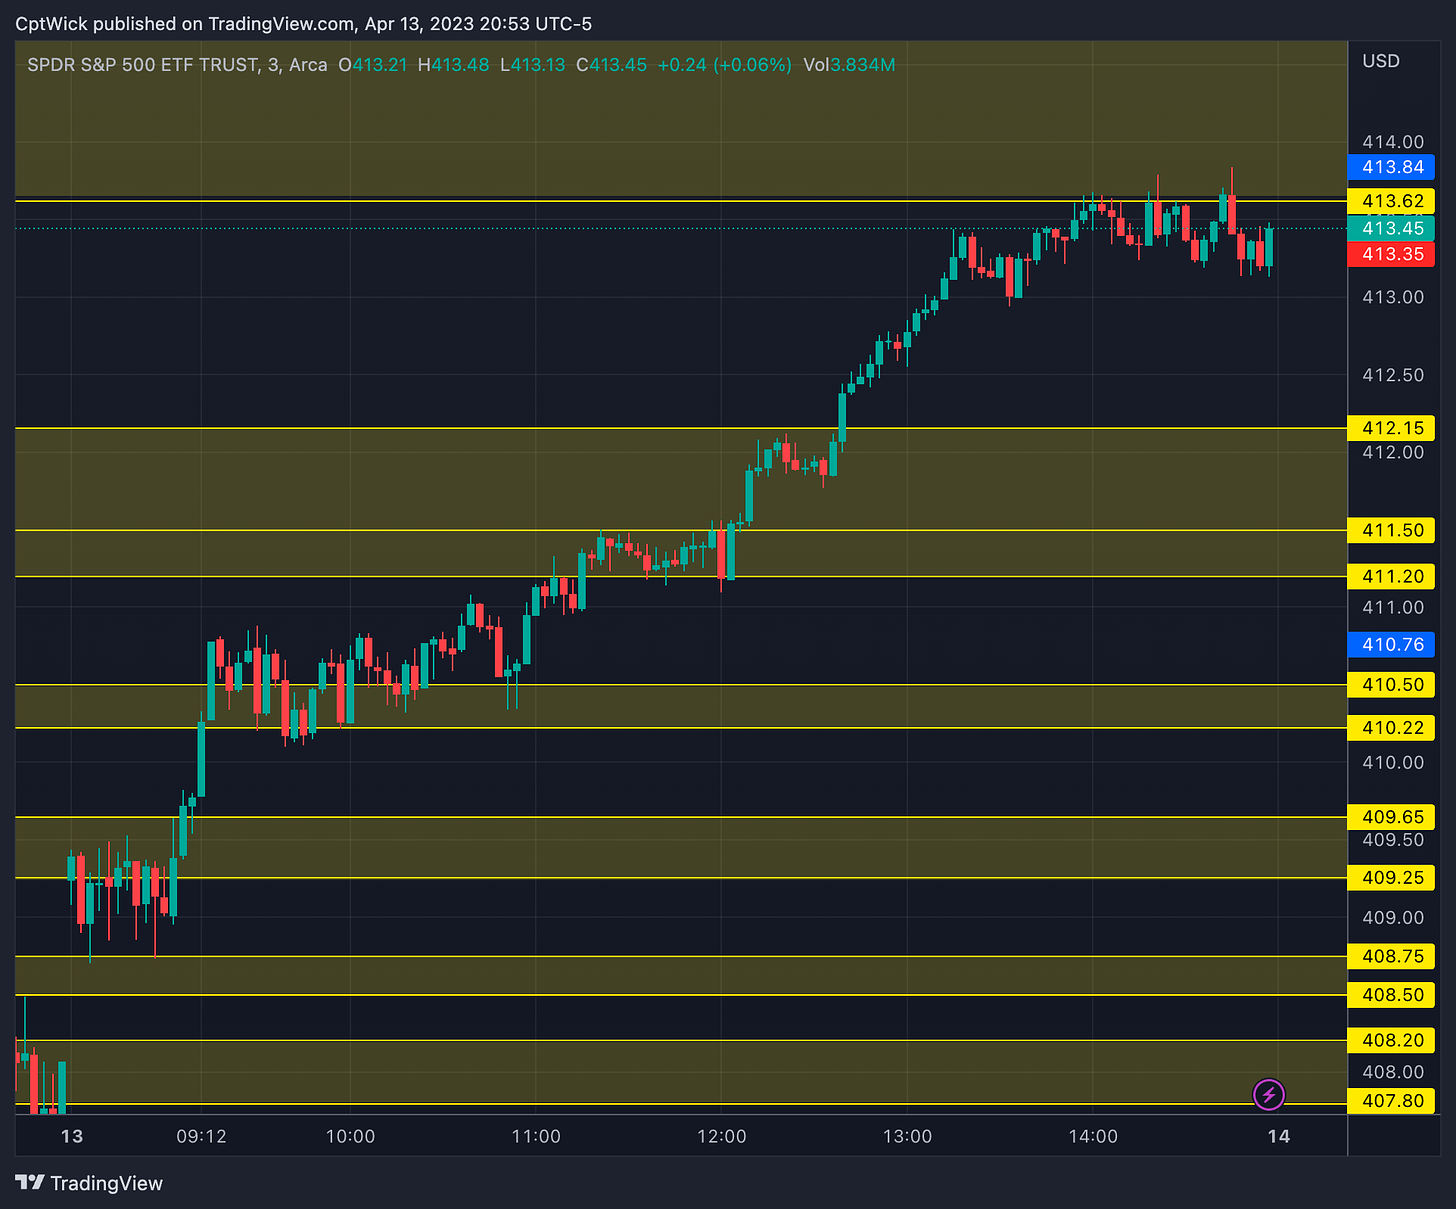
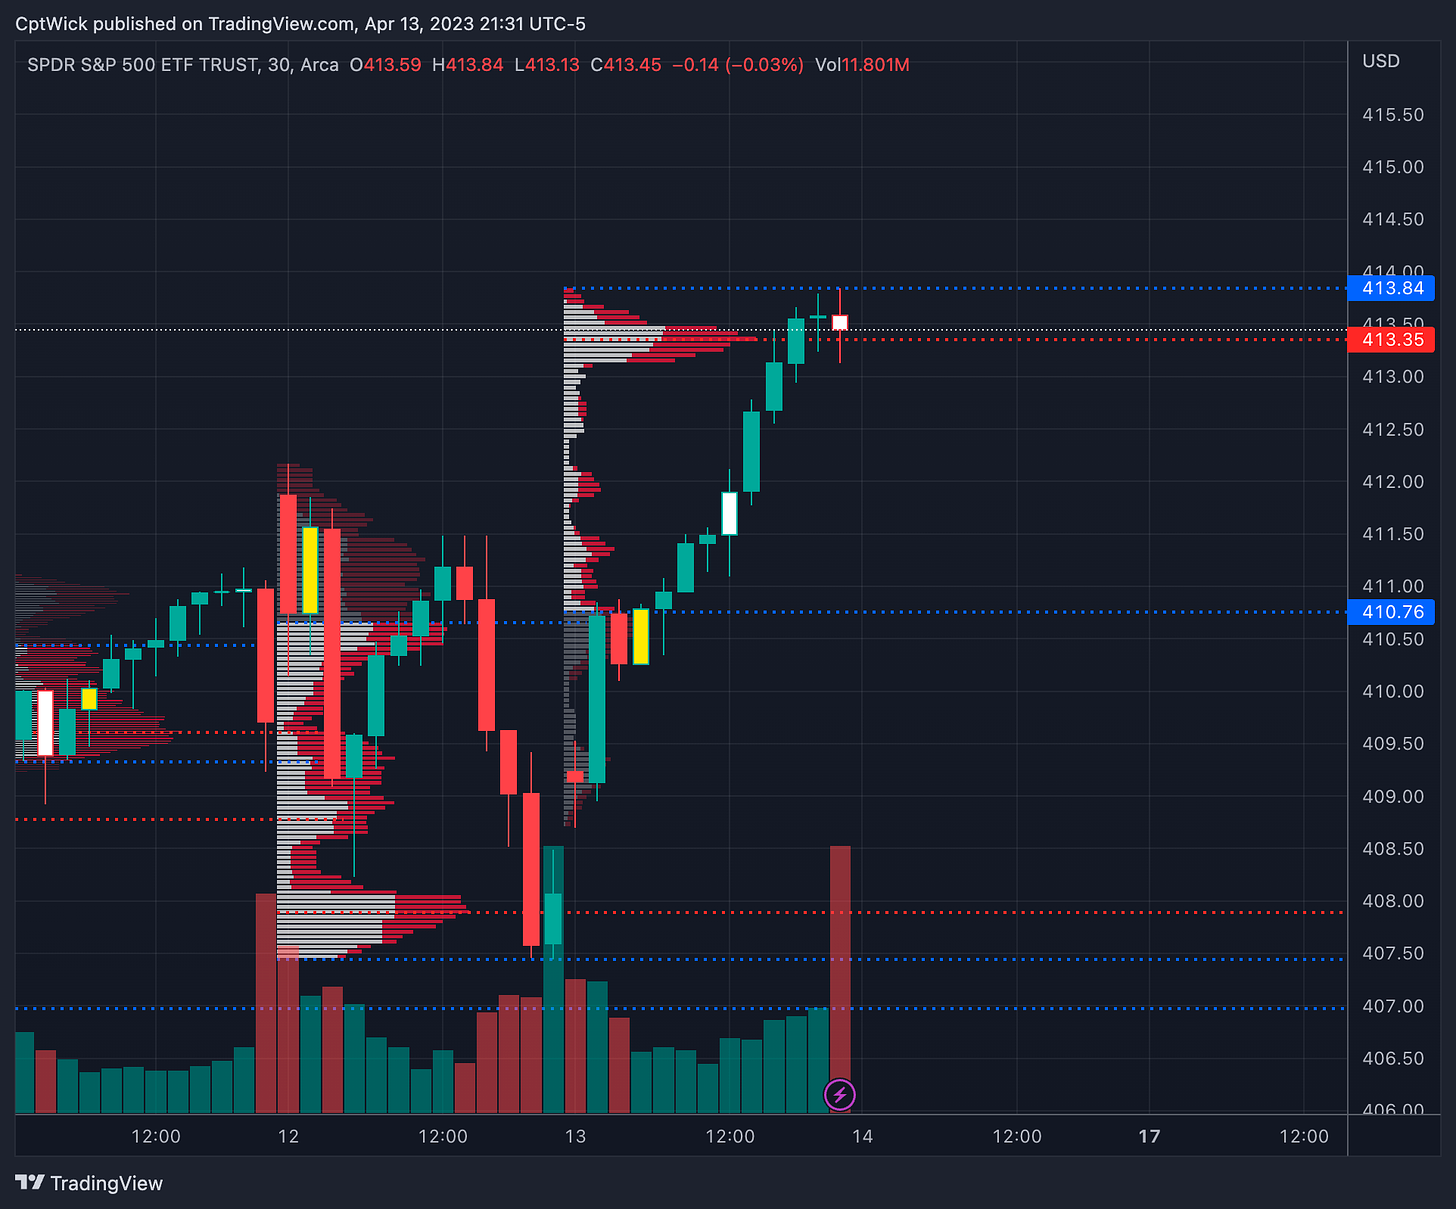
Today was yet another day that our levels from last nights plan worked. The zone we had at 408.75-408.50 held and we rallied to the 410.50 area where we balanced for a bit before breaching 411.20, and once we broke 412.15 it squeezed all the way up to our next level and came to a stop.
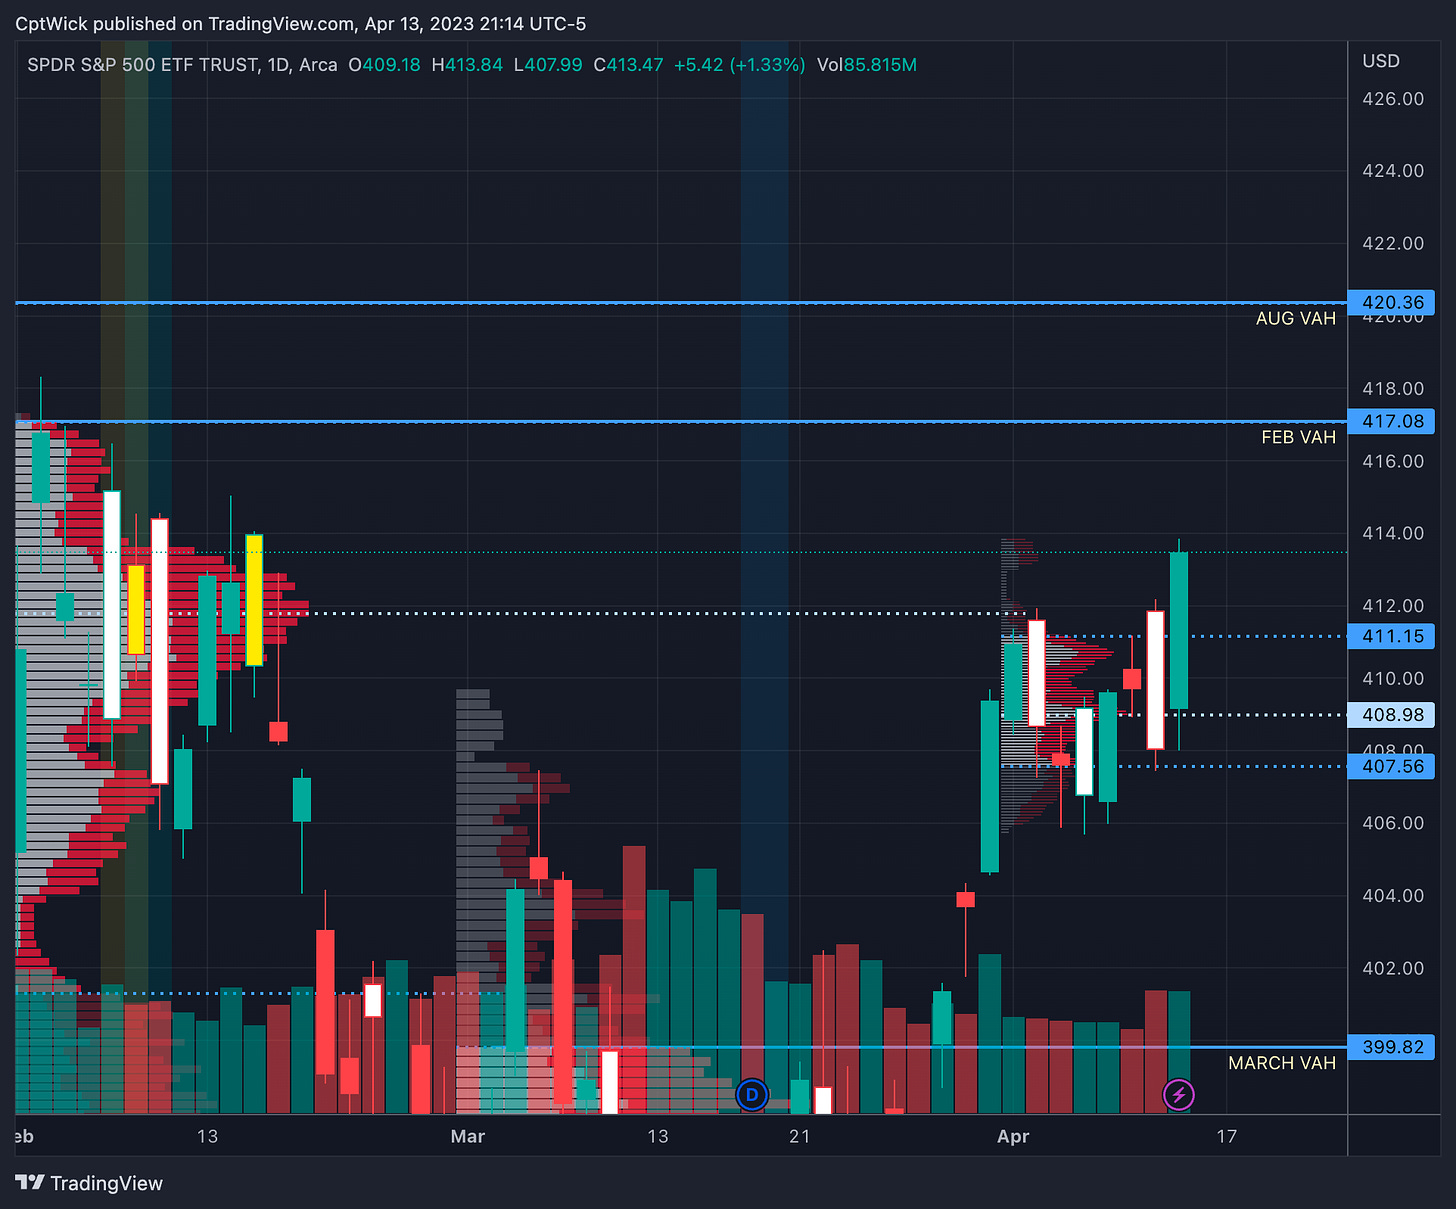
I really don’t know what to say, looking at this yesterday I would of been lying if I said I wasn’t bearish going into the session. We had that double top look at Feb’s POC and we got the big bearish engulfing candle, it sure felt bearish to me. but we stuck to the plan and new our levels and it kept us on the right side of the trade.
Looking at the monthly volume profile up above now the bulls have cleared Feb’s POC and we are at a imbalance to the upside, meaning the current value area is below us. We also are coming up on the VAH of Feb’s profile. The bulls want to see the current value area high hold as support, or to even move up. Today’s candle might be more impressive than Wednesday’s. It will be interesting to see how this play out, do we see that Feb VAH? Or was this a major trap again?
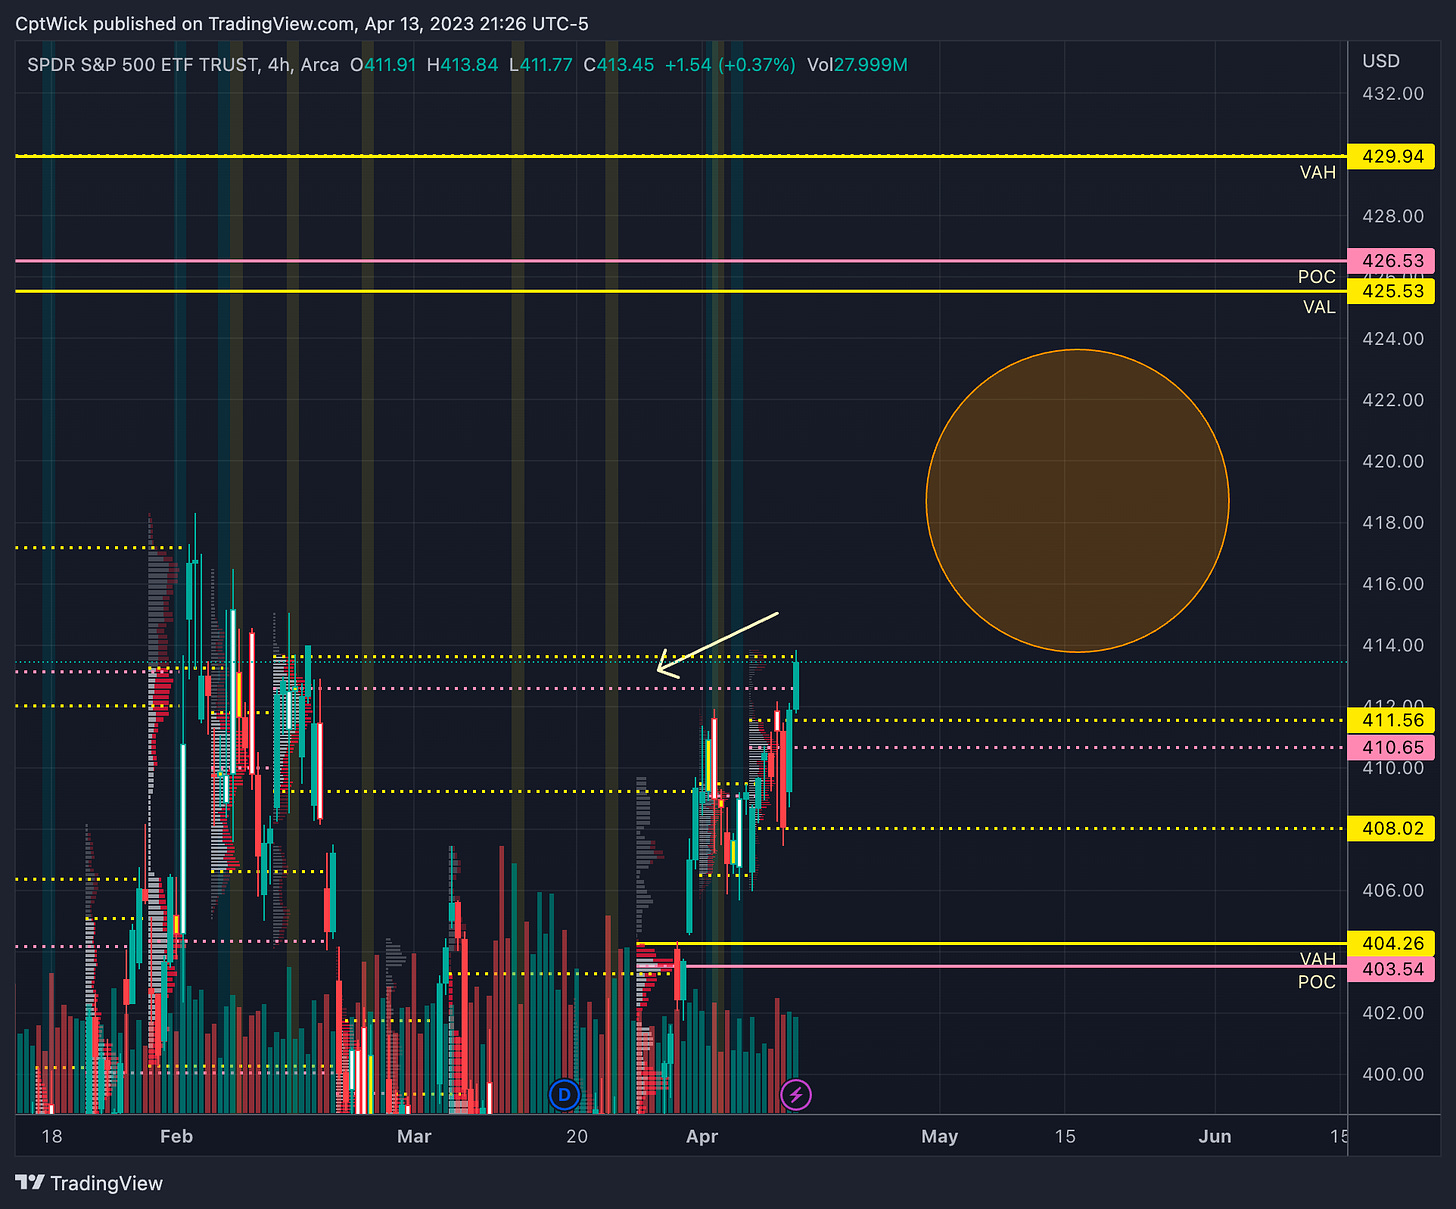
The arrow is pointing to the the previously naked POC and VAH that was violated today. The bulls want to see that level (413.62) to break to the upside and to to find value somewhere in the circle area so we can work on the next naked value are up at 425.50. The bears want to see price get pulled back under 411.50.
If we look at todays profile we can see that at the end of the day we had a larger amount of concentrated volume around today’s highs forming a P profile, but a fairly “thin” P in that. The P profile indicates “weak” buyers. So with that being said, the 413-414 area will be important going into tomorrow and specifically the open. If we open above it and it is showing signs of support, meaning price dipping into that area and bouncing up, it would be a good indicator that we might be moving up still. If we open under and we come back up into this area and reject, that might mean we are headed to test 410-407. Price is king!
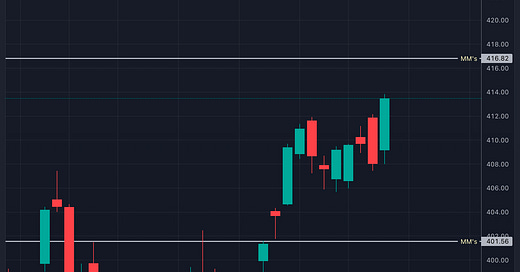
We are still within the market makers weekly expected move, If we hit 416.82 that would put us right around Feb’s VAH.
The 409-407 area is getting really congested, typically these are chop zones, it’ll be interesting to se what happens if we enter that area again, can the bulls keep defending?
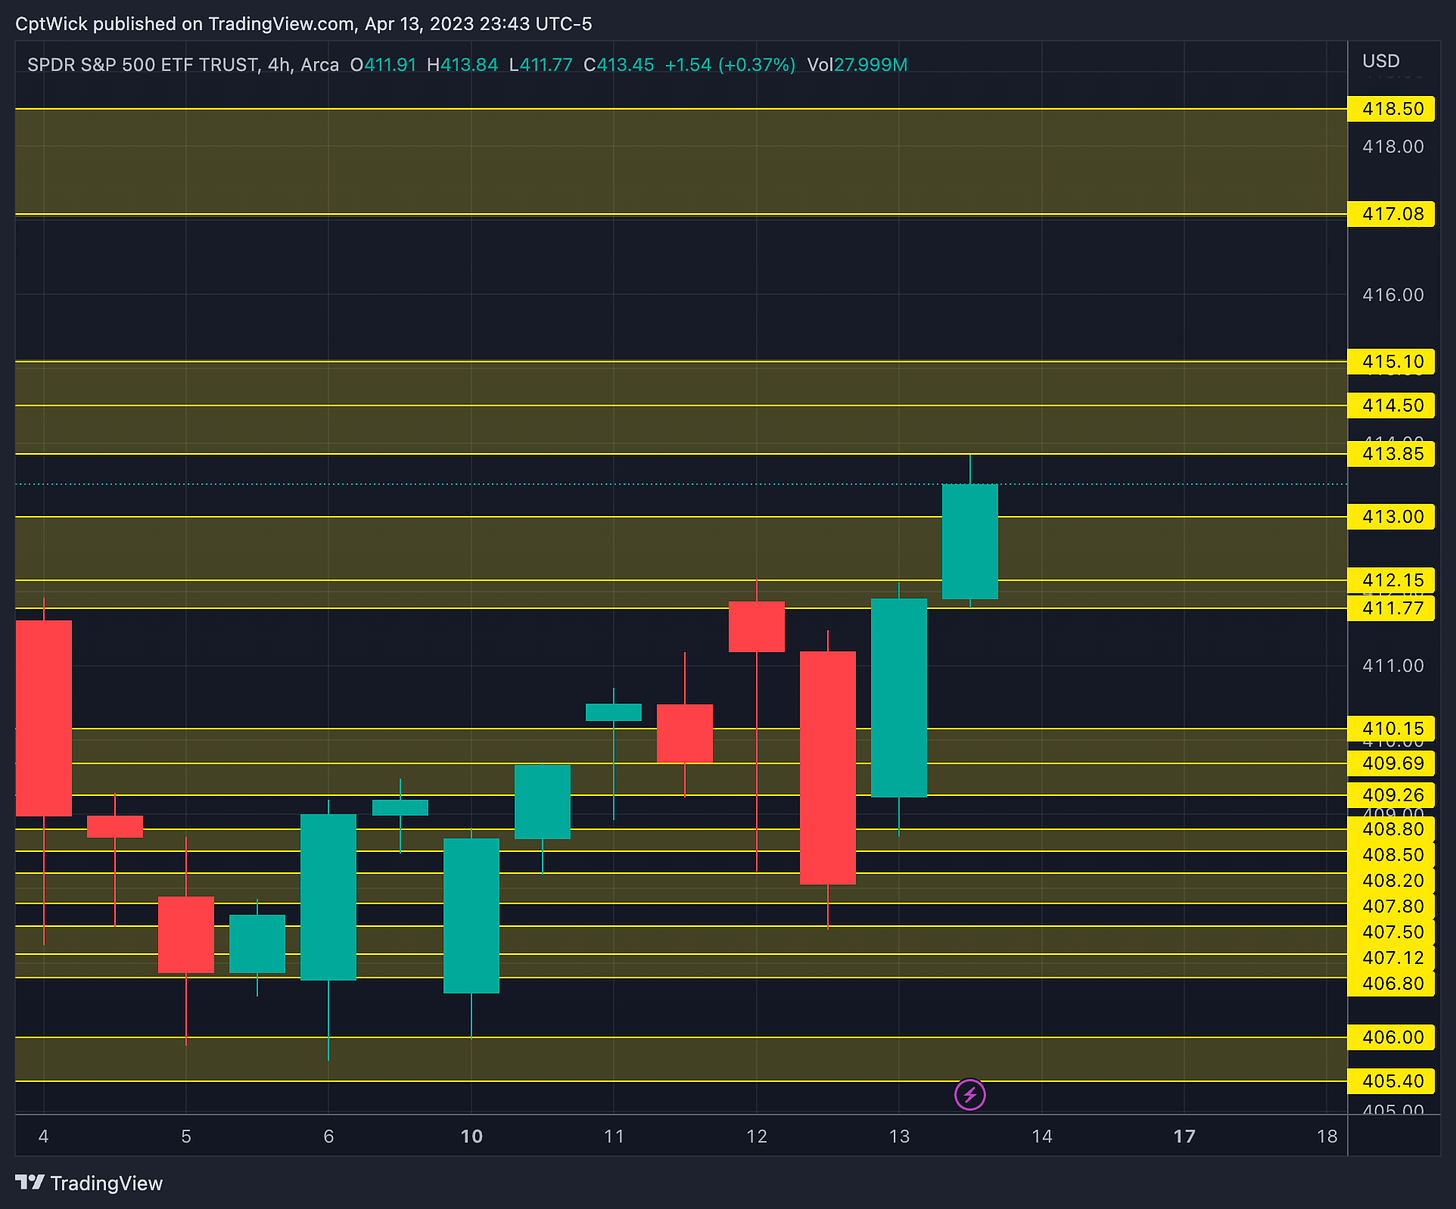
Key Levels Above (previous close - 413.47)
413.85, 414.50, 415.10
415 is negative vanna/positivie gamma (stronger resistance)
413/414 is positive gamma (resistance)
417.08 - 418.50
417.08 is Feb’s VAH
416/417 is positive gamma (resistance)
418 is negative vanna (resistance)
420.09, 420.36, 421.16, 421.87
419 Is positive gamma (resistance)
422 is negative vanna (resistance)
Key Levels Below
413, 412.15, 411.77
413 is positive gamma (support)
412 is negative vanna (support)
411.77 is Feb’s POC and it is also close to this weeks current weekly VAH 411.56
410.65, 410.15, 409.69, 409.26
410.65 is this weeks current POC
408.80, 408.50, 408.20, 407.50, 406.80
407 is positive gamma (support)
406.49 is last weeks VAL
406- 405.40
405 is positive gamma/negative vanna (stronger support)
404.60, 404.26, 403.54
404.26 is a naked weekly VAH
403.54 is a naked weekly POC
I think that is a solid demand zone. I will be watching this area close. I think that if we were to selloff into this area the bulls might defend it.
If the gamma profile acts like it has recently, meaning 405 is the last line of defense until 392, I would think that this demand would hold and we would rally back into positive gamma.
Be careful if you are holding shorts in this area, I know I will be, a strong reversal could happen.
403 is positive gamma (support)
402.70 - 401.50
Gap fill
401.56 is the MMs weekly low expected move.
Happy Trading,
—WICK—
To cover our basis…
Welcome to my Substack where I provide a daily SPY trading plan to help guide my intraday trading. The purpose of this letter is not to advice you on your trading or investment decisions. I am simply documenting my daily trading plan for myself to help with planning and execution. These are simply my opinions and the data sourced from the likes of vol.land, TradingView, Quantdata.us and others. The stock market is risky, gains are not guaranteed. This is not about getting rich quick, but learn to educate yourself and make the necessary financial decisions on your own. This is not financial advice.

