Readers,
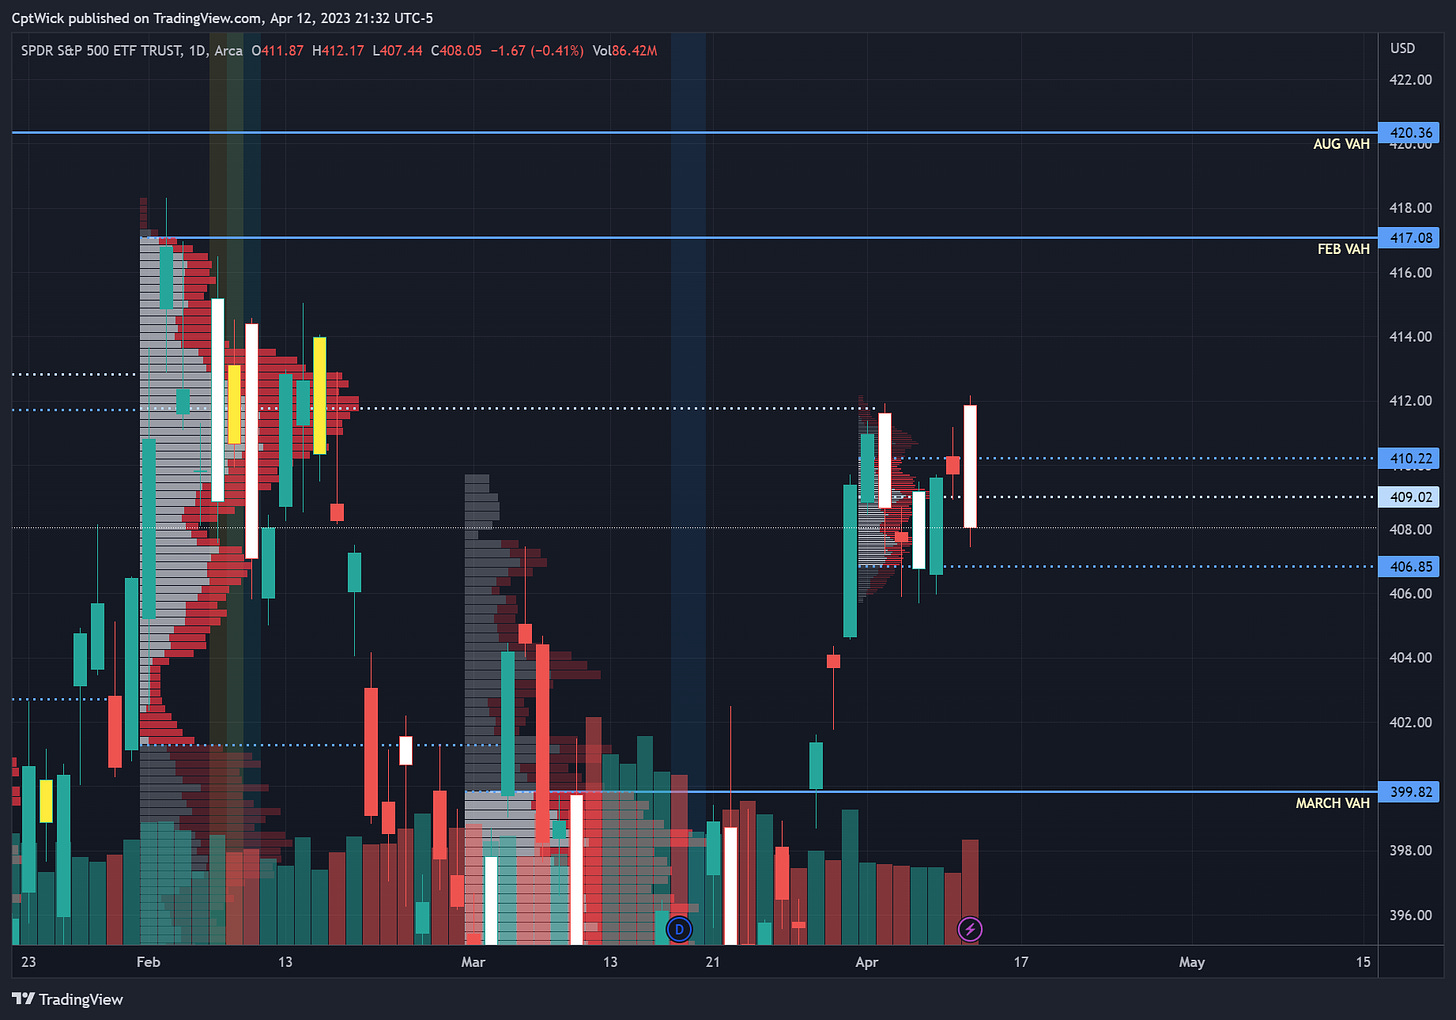
A significant level to note is February's Point of Control (POC) around the 411.77 mark, which has been staunchly defended by the bears. It's worth observing how price formed a double top around this area and failed to sustain its upward momentum on April's profile, ultimately closing below the current POC the value area low now becomes a very important level, and it would open the door for a chance that we revisit the March value area.
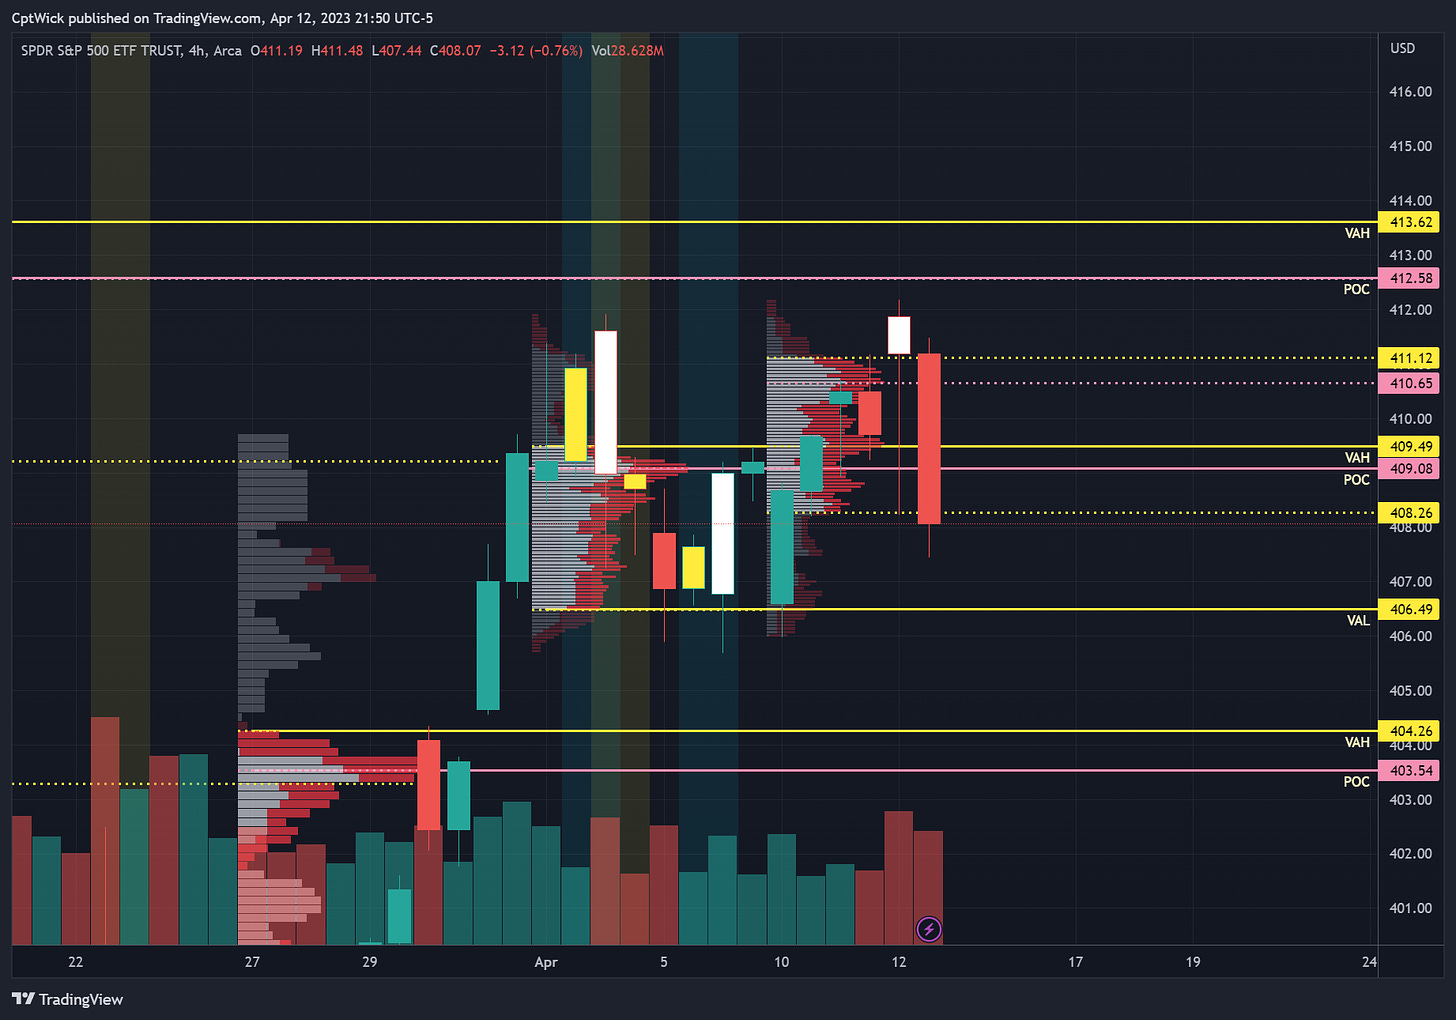
The weekly profile is showing a similar look, but on the weekly we broke down under the VAL (the current week is the dotted lines). We are also under the POC of last weeks value area, just like the monthly, this VAL at 406.49 will be key. If we lose 406.49 and the bulls cant bring us back above, I would expect a retest of the value area starting at 404.26
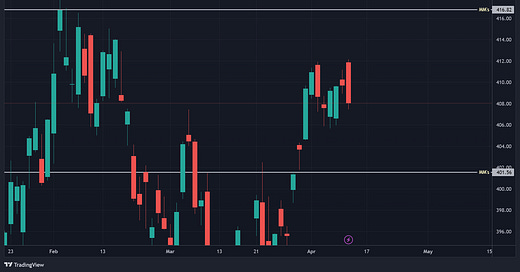
Here is a update on how the MMs expected move is looking, we are still pretty far from either side. That is a pretty nasty bearish engulfing candle as well I might add, pair that with the double top at Feb’s POC…the bears might have a good case here. The low on Thursday 4/6 would be the neckline to this double top, we could flush under that, but we do have some key demand zones near by and I will highlight those later in the plan.
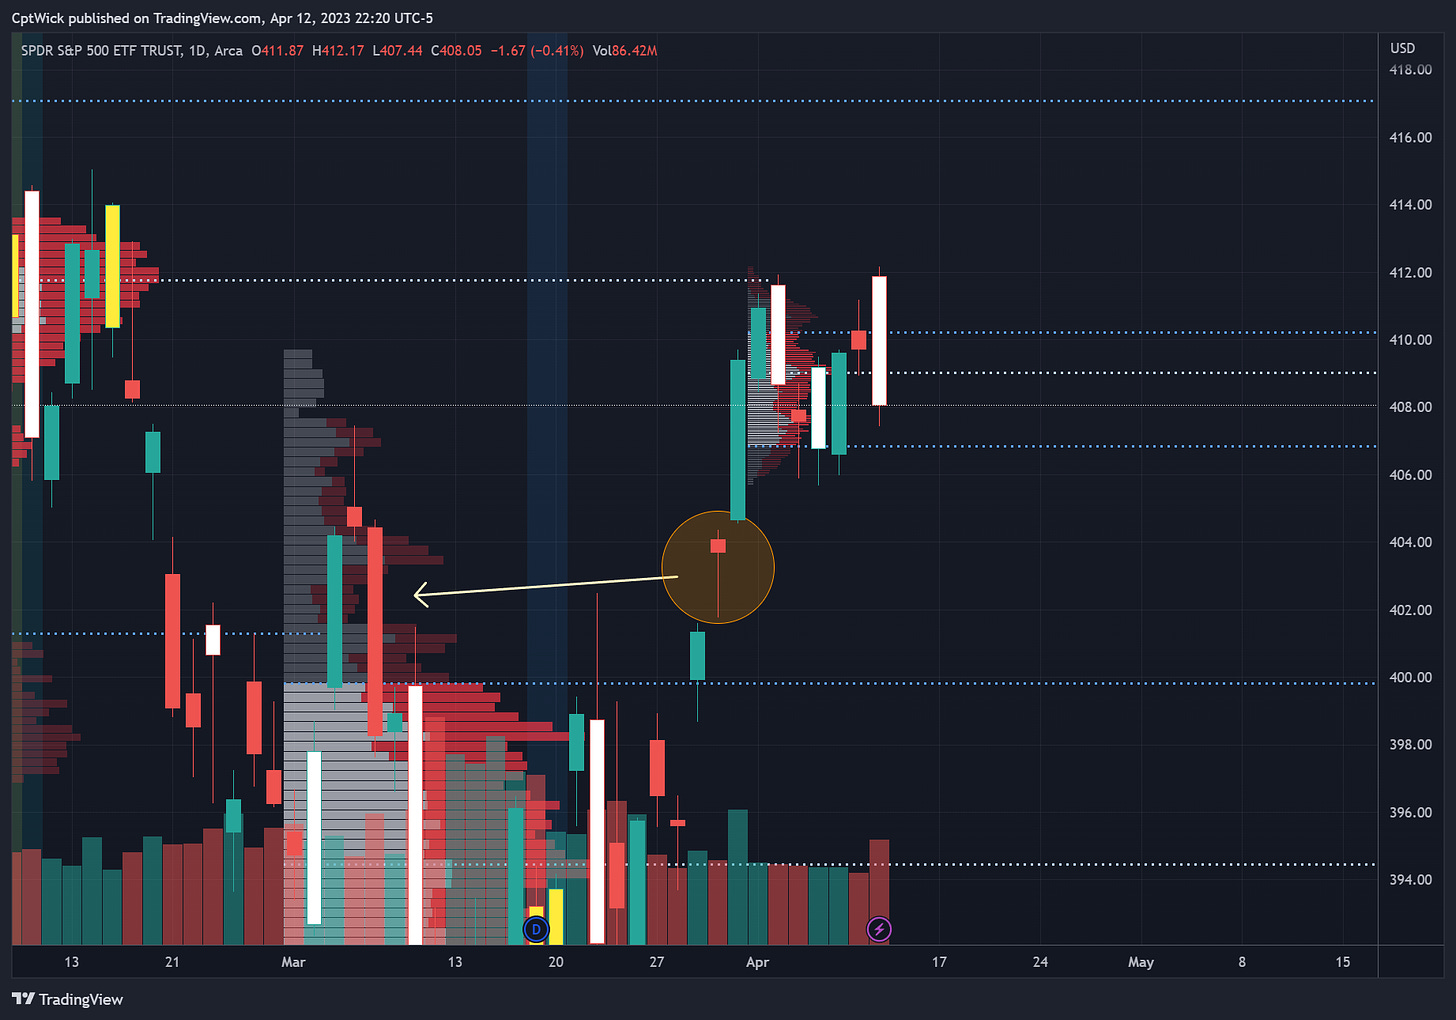
See this candle above, this is a hammer candle, it is also the “base” for the rally base rally that took us to Feb’s POC. You can also see that it created a nice low volume area on the monthly profile. This area is very critical for both sides. If we were to trade the range of this candle (404.35-401.76) I would expect there to be some fight from the bulls, if we blow past it, it could turn into a good supply zone where longs could exit before we head lower, just something to keep in mind.
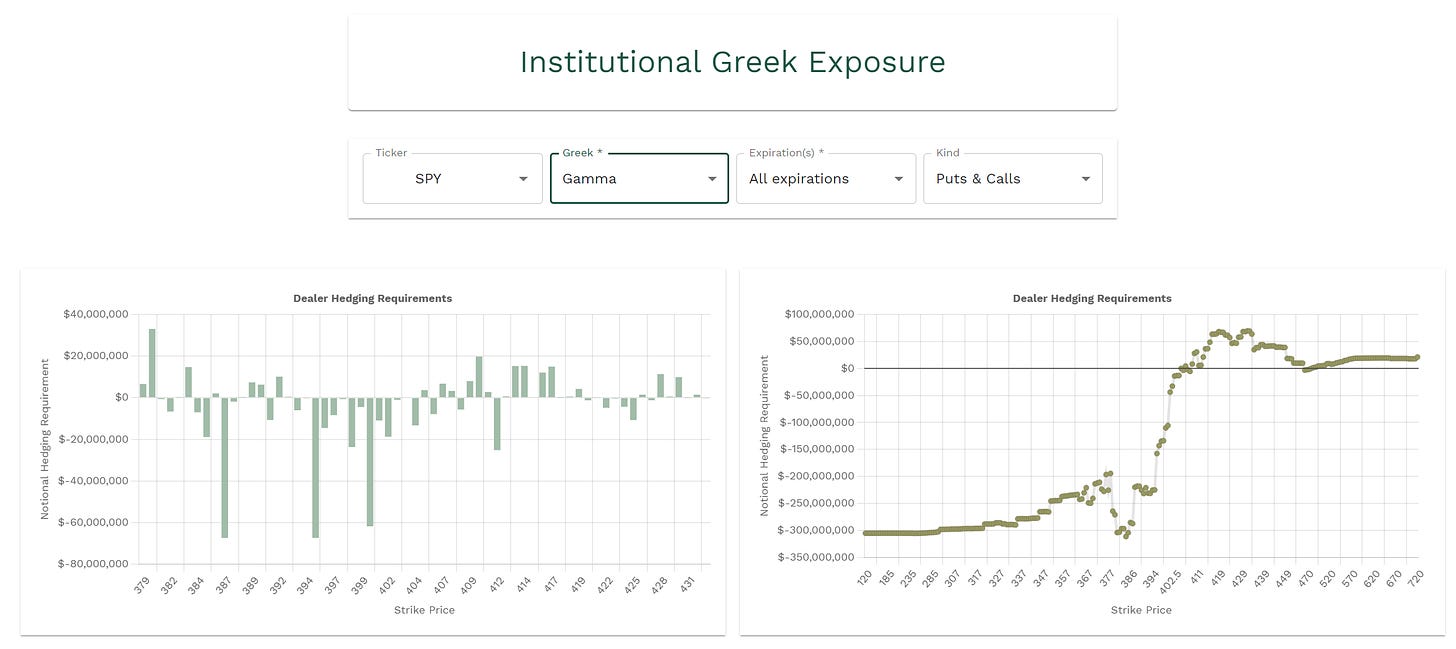
Similar look to how it has been the past few days. Our last line of defense for gamma is 405, we don’t have positive gamma under 405 until 392 on the aggregate view. We also have positive gamma at 407, 409, 410. If price falls under 405 it could get nasty, or we could find support at a demand zone and rally back to the gamma, again this is something to take into consideration with the news that will be released tomorrow we could have another volatile session.
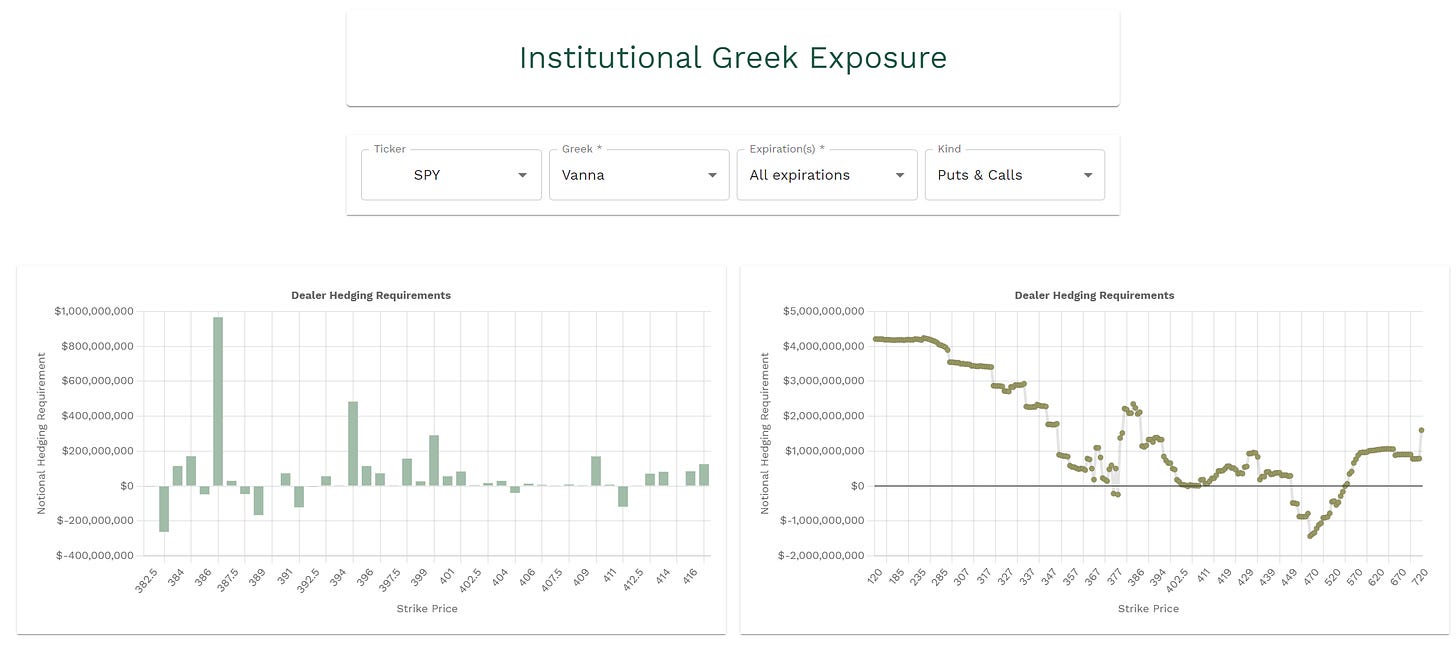
We have negative vanna at 392, 405, and 412. Are you starting to understand that 405 is a pretty big level?
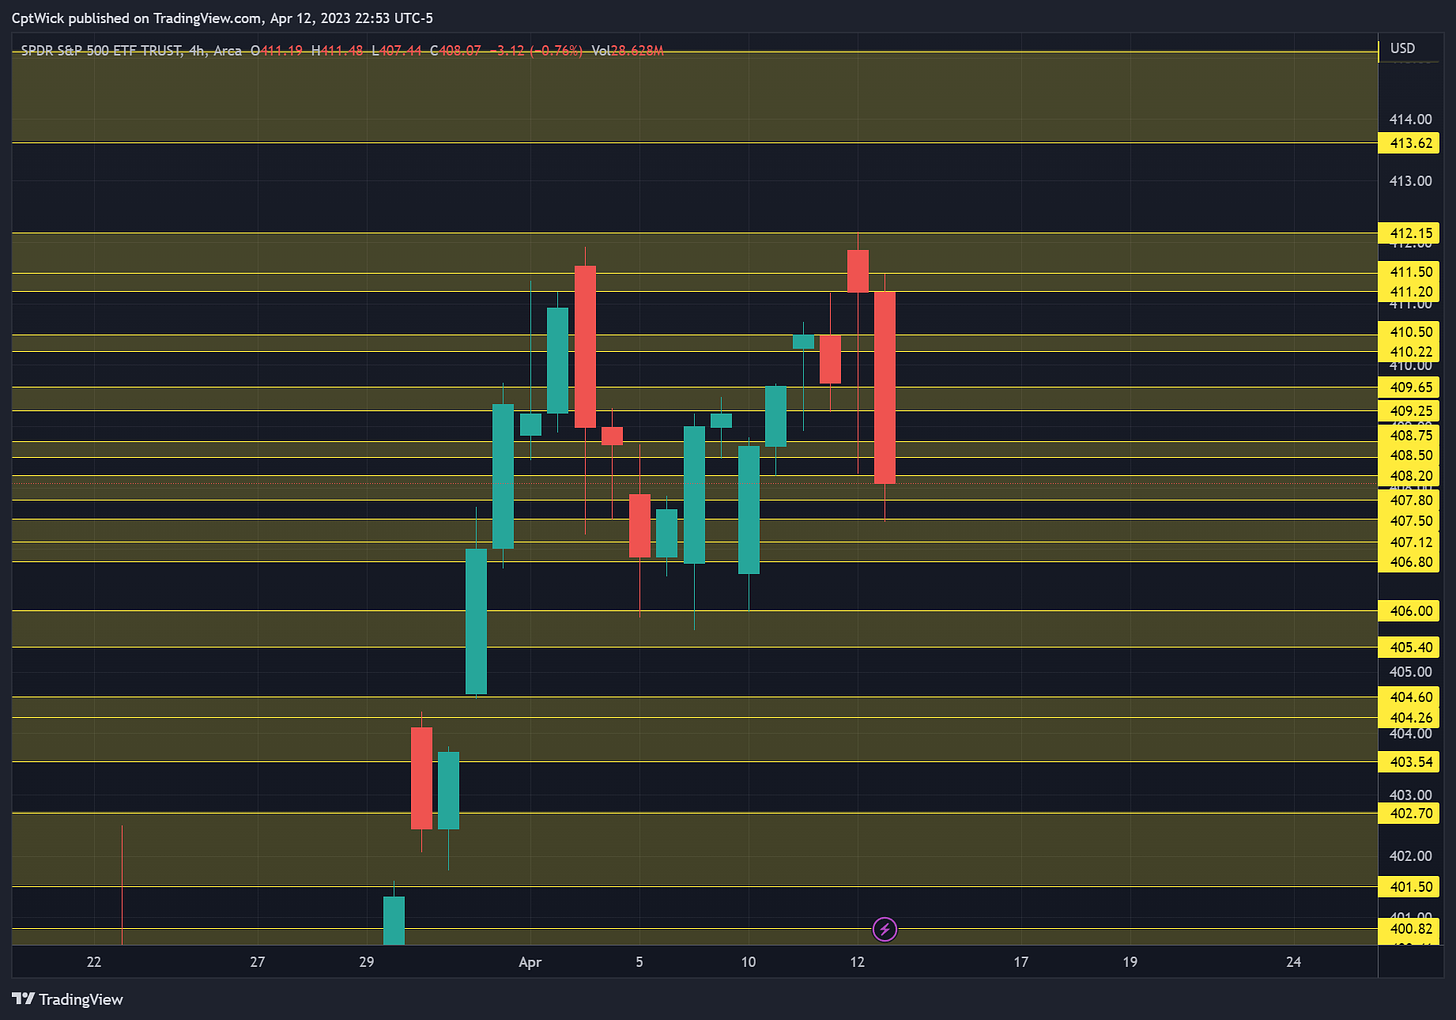
Here are my key supply and demand zones on the chart,
Key Levels Above (previous close-408.05)
Above 408.20 the next zone is 408.50 - 408.75
409.25 - 409.65
409 is positive gamma (resistance)
409.08 is also last weeks POC
410.22 - 410.50
410 is positive gamma (resistance)
411.20, 411.50, 412.15, 412.58
411 is positive gamma (resistance)
412 is negative vanna (resistance)
412.58 is a naked weekly POC
413.62 - 415.10, 416.82
413.62 is a naked VAH
413-417 is positive gamma (resistance)
416.82 is the MMs weekly high expected move
Key Levels Below
Below 407.80 the next zone is 407.50 - 406.80
407 is positive gamma (support)
406.49 is last weeks VAL
406- 405.40
405 is positive gamma/negative vanna (stronger support)
404.60, 404.26, 403.54
404.26 is a naked weekly VAH
403.54 is a naked weekly POC
I think that is a solid demand zone. I will be watching this area close. I think that if we were to selloff into this area the bulls might defend it.
If the gamma profile acts like it has recently, meaning 405 is the last line of defense until 392, I would think that this demand would hold and we would rally back into positive gamma.
Be careful if you are holding shorts in this area, I know I will be, a strong reversal could happen.
402.70 - 401.50
Gap fill
401.56 is the MMs weekly low expected move.
400.82, 400.41, 399.82
399.82 is March’s VAH
398.65, 398.10, 396.50
I think that a bigger move can come above 412 and below 405, based off the Volland data. If we don’t get continuation below 405 I think that we could be in a slow grind up situation.
Happy Trading,
—WICK—
To cover our basis…
Welcome to my Substack where I provide a daily SPY trading plan to help guide my intraday trading. The purpose of this letter is not to advice you on your trading or investment decisions. I am simply documenting my daily trading plan for myself to help with planning and execution. These are simply my opinions and the data sourced from the likes of vol.land, TradingView, Quantdata.us and others. The stock market is risky, gains are not guaranteed. This is not about getting rich quick, but learn to educate yourself and make the necessary financial decisions on your own. This is not financial advice.

