Readers,
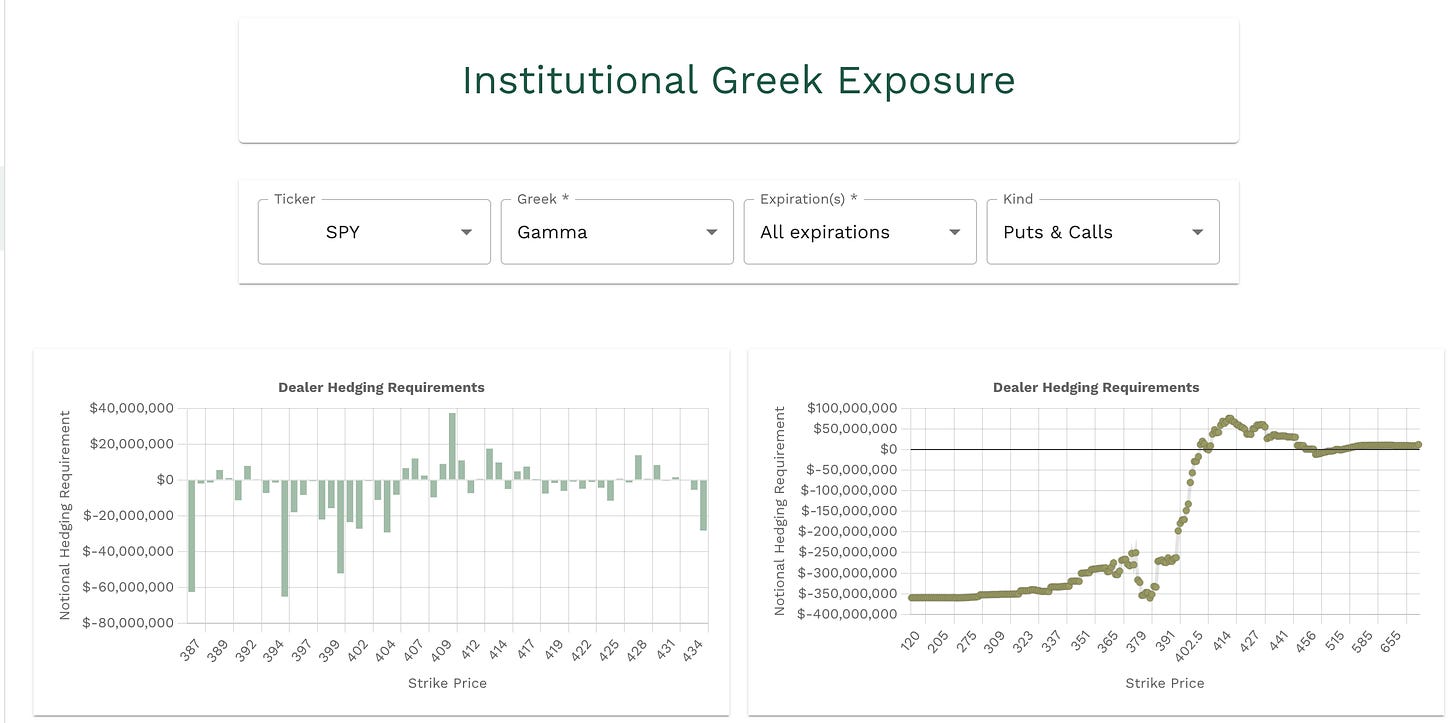
What a day for the our levels from last nights plan. Some good take aways from today’s session - In last nights plan I said that the gamma was looking very similar to how it was looking going into last week and it happened on Thursday as well, but we had positive gamma at 407.50, 410, but there was no other positive gamma under 407.50 until 392. I said that they could pin us between 407.50 and 410. —
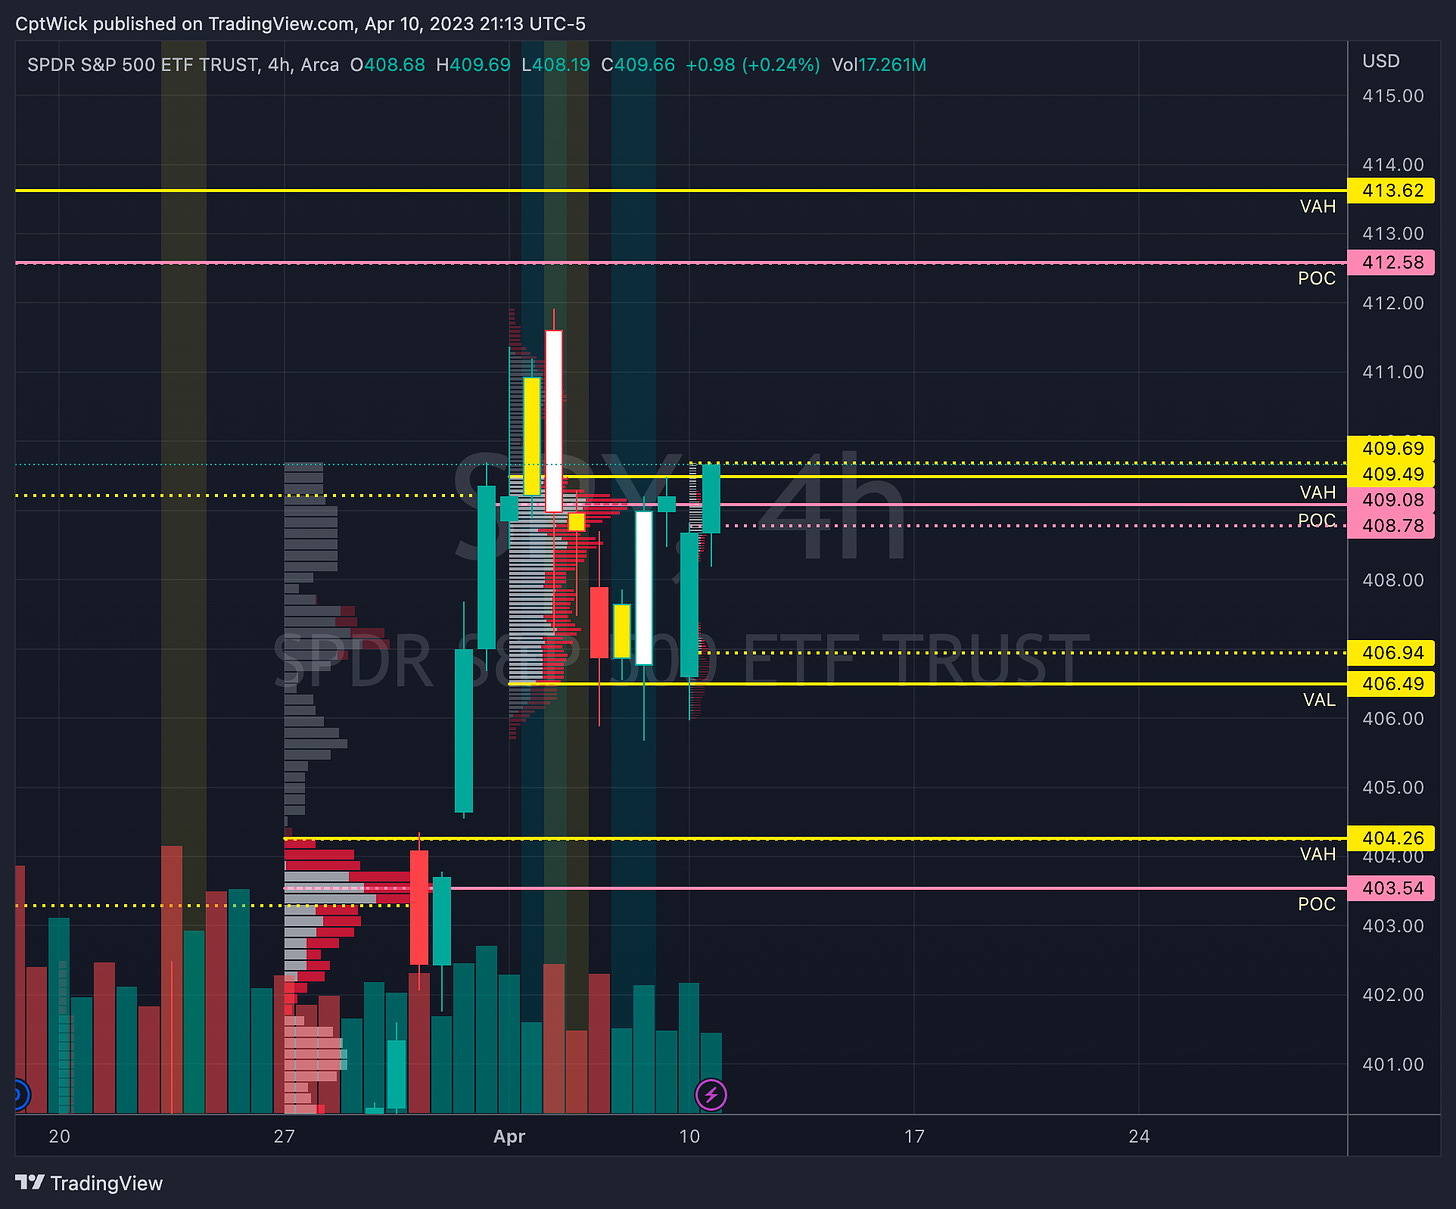
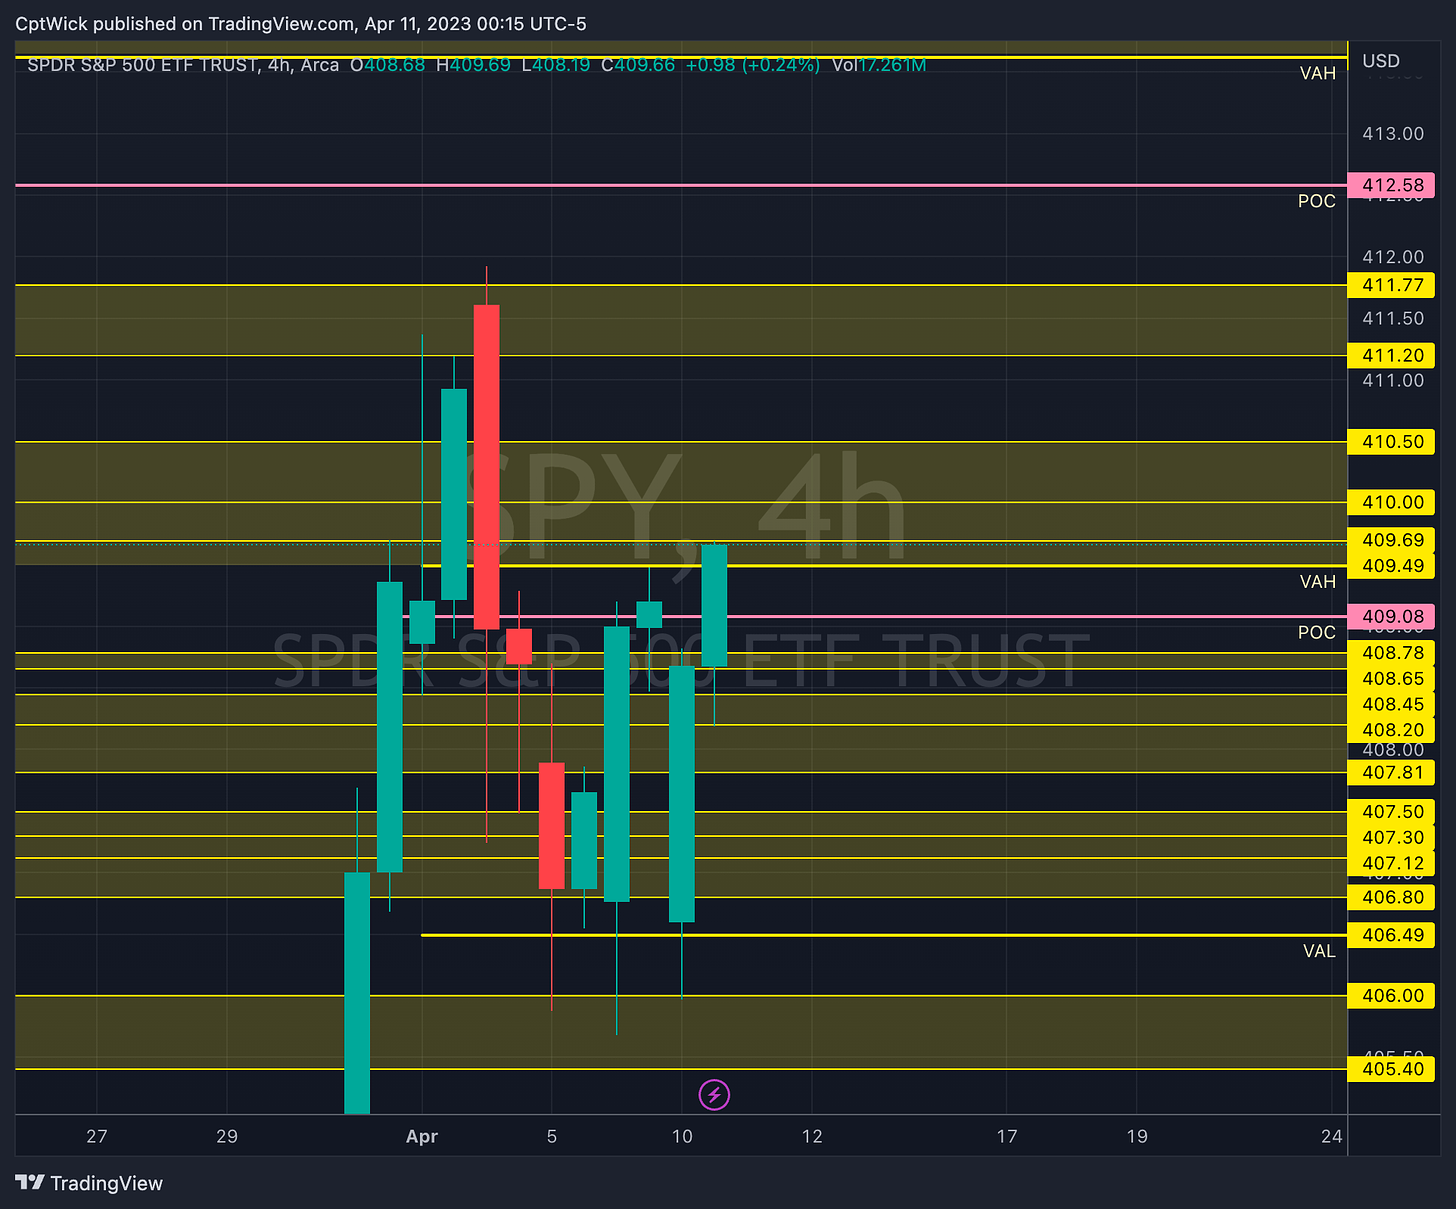
We also closed above last weeks value. The bulls managed to push above Thursday’s high and close above the VAH on the volume profile. The dashed lines is the current week, solid lines are previous weeks. 409.50 to 406.50. very very key levels, they will be important heading into CPI.
Gamma is starting to show a few more strikes.
Notable Positive Gamma for tomorrow
392, 406, 407, 407.50, 409, 410, 411, 413, 414
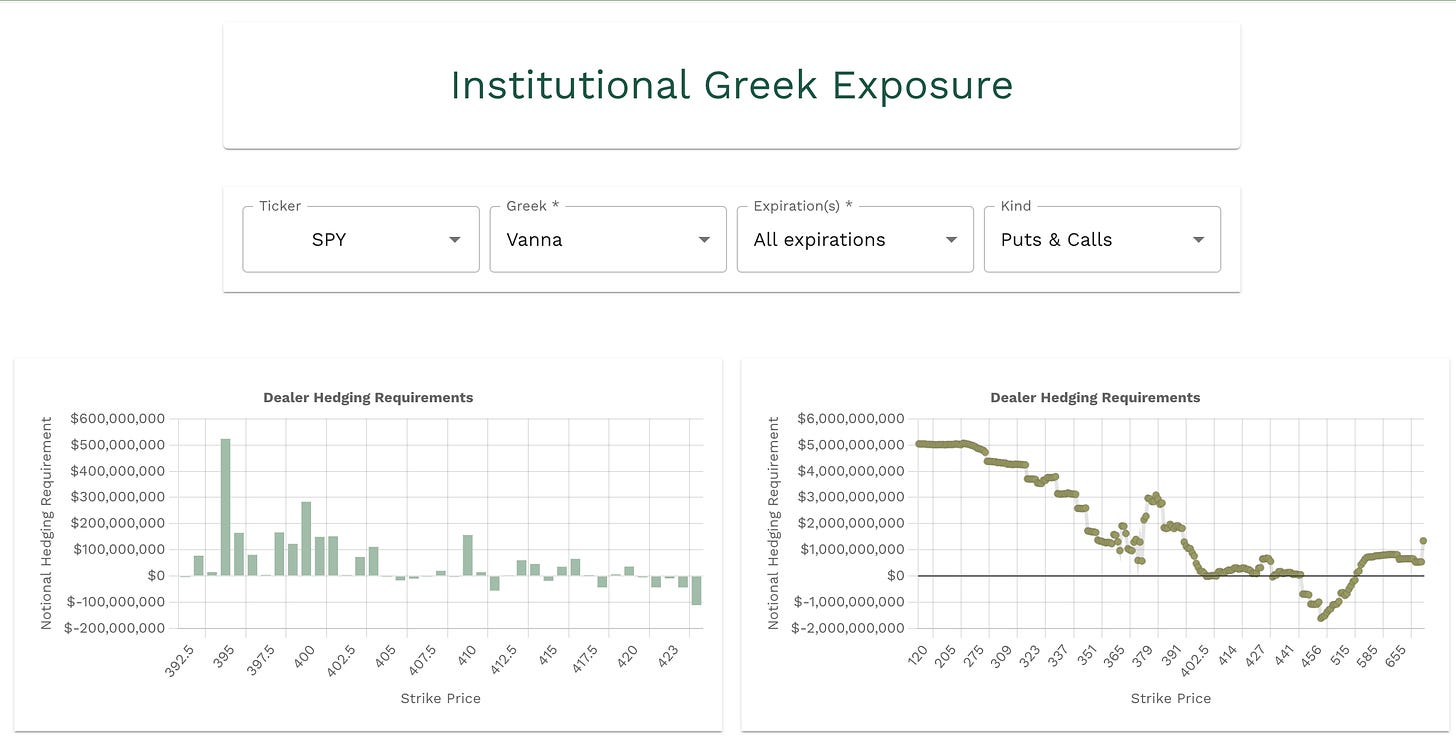
Notable Negative Vanna for tomorrow
392, 406, 407, 412, 415, 418
I am going to change up my key level section of my plan. I think instead of using bullish/bearish scenario, I am going to change it to Key levels above/below previous session’s close, I can see how the old way could be confusing at times. So with that, here are the levels.
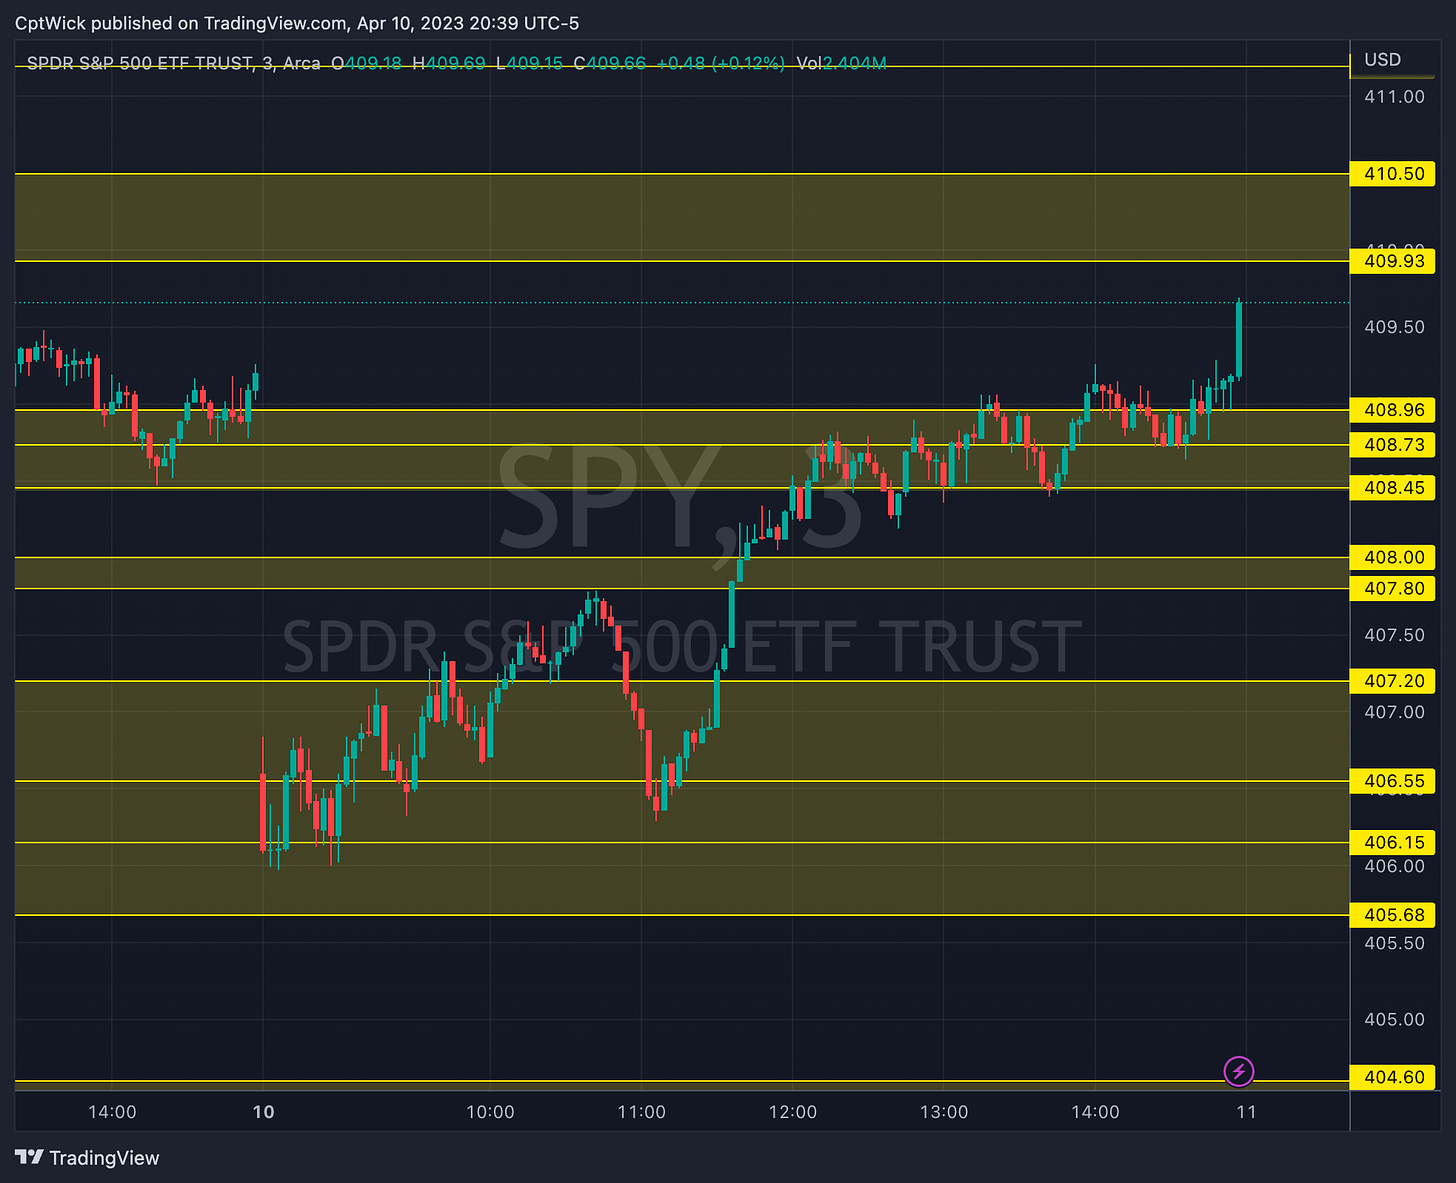
Key Levels Above (previous close-409.61)
409.69, 410, 410.50
409.69 is the current VAH on the week
410/411 is positive gamma (resistance)
If we get continuation above 410.50 the next zone is 411.20-411.77
411.77 was February's POC, tons of volume here from a previous supply zone, still acting as supply, Bulls need to take this out.
412 is negative vanna (resistance)
412.58 is a naked POC from a previous weekly value area (we are in this value area the VAL is 409.22) VAH is 413.62.
If we can breakout from that VAH at 413.62 I would want to target 415-415.10
413/414 is positive gamma (resistance)
415 is negative vanna (resistance)
Key Levels Below (previous close 409.61)
We closed outside of last weeks value area, above the VAH at 409.49, the POC for that value area is 409.08, but its no longer naked since the bulls took it out yesterday, the VAL is 406.49. I think it is critical for the bulls to keep pressure above 409.
409.49-409
409 is positive gamma (support)
Under 409 I would look for 408.78-408.65 (demand zone on the VP)
408.45, 408.20, 407.81
407.50 is positive gamma (support)
407 is also negative vanna/positve gamma (stronger support)
407, 406.80, 406.49, 406, 405.40
406 is negative vanna/positive gamma (stronger support)
Under 405.40 the next naked value area is from 404.26 to 395.13 with a POC at 403.54.
The levels here are getting cluttered, its a sign of consolidation, the market is getting ready for a move and it very well could happen this week with CPI.
I know it looks like a lot on bigger timeframes but I am trying to squeeze them in a screenshot for you to see. It much much much easier when you are watching it play out live on a smaller timeframe. I usually use the 3min, but you can use whatever timeframe you want. 1min,3min,15min…. whatever makes you feel comfortable!
Just a friendly reminder, support and turn into resistance and resistance can turn into support. Im not sure who needs to hear that but for my plan it is key that you understand this concept.
One last thing, my daughter turns 2 tomorrow! So just a heads up that I may not get to a full plan tomorrow night but Ill give you some levels via Twitter, so if you don’t get a Substack email by market open, check twitter!
Happy Trading,
—WICK—
To cover our basis…
Welcome to my Substack where I provide a daily SPY trading plan to help guide my intraday trading. The purpose of this letter is not to advice you on your trading or investment decisions. I am simply documenting my daily trading plan for myself to help with planning and execution. These are simply my opinions and the data sourced from the likes of vol.land, TradingView, Quantdata.us and others. The stock market is risky, gains are not guaranteed. This is not about getting rich quick, but learn to educate yourself and make the necessary financial decisions on your own. This is not financial advice.


