Readers,
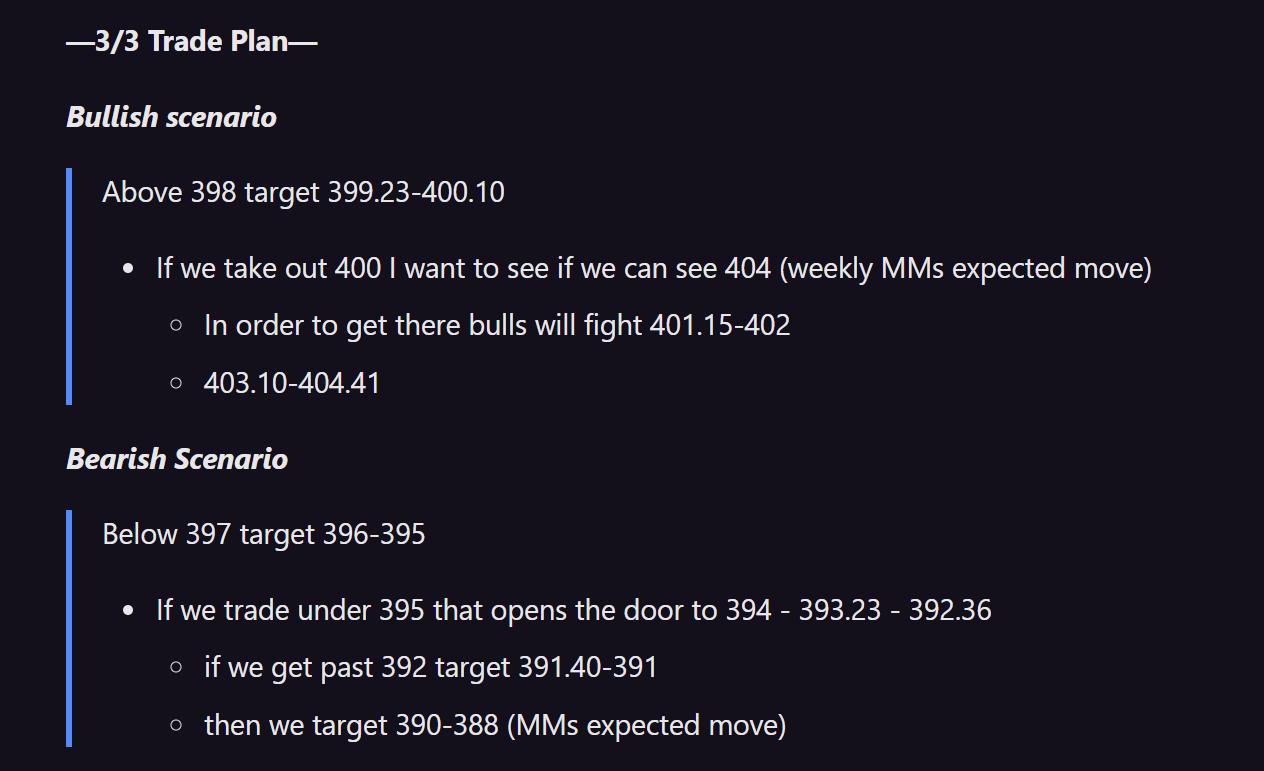
Going into last week, we or I was pretty bearish not going to lie. Lets see what the keys levels were last week per the plan.
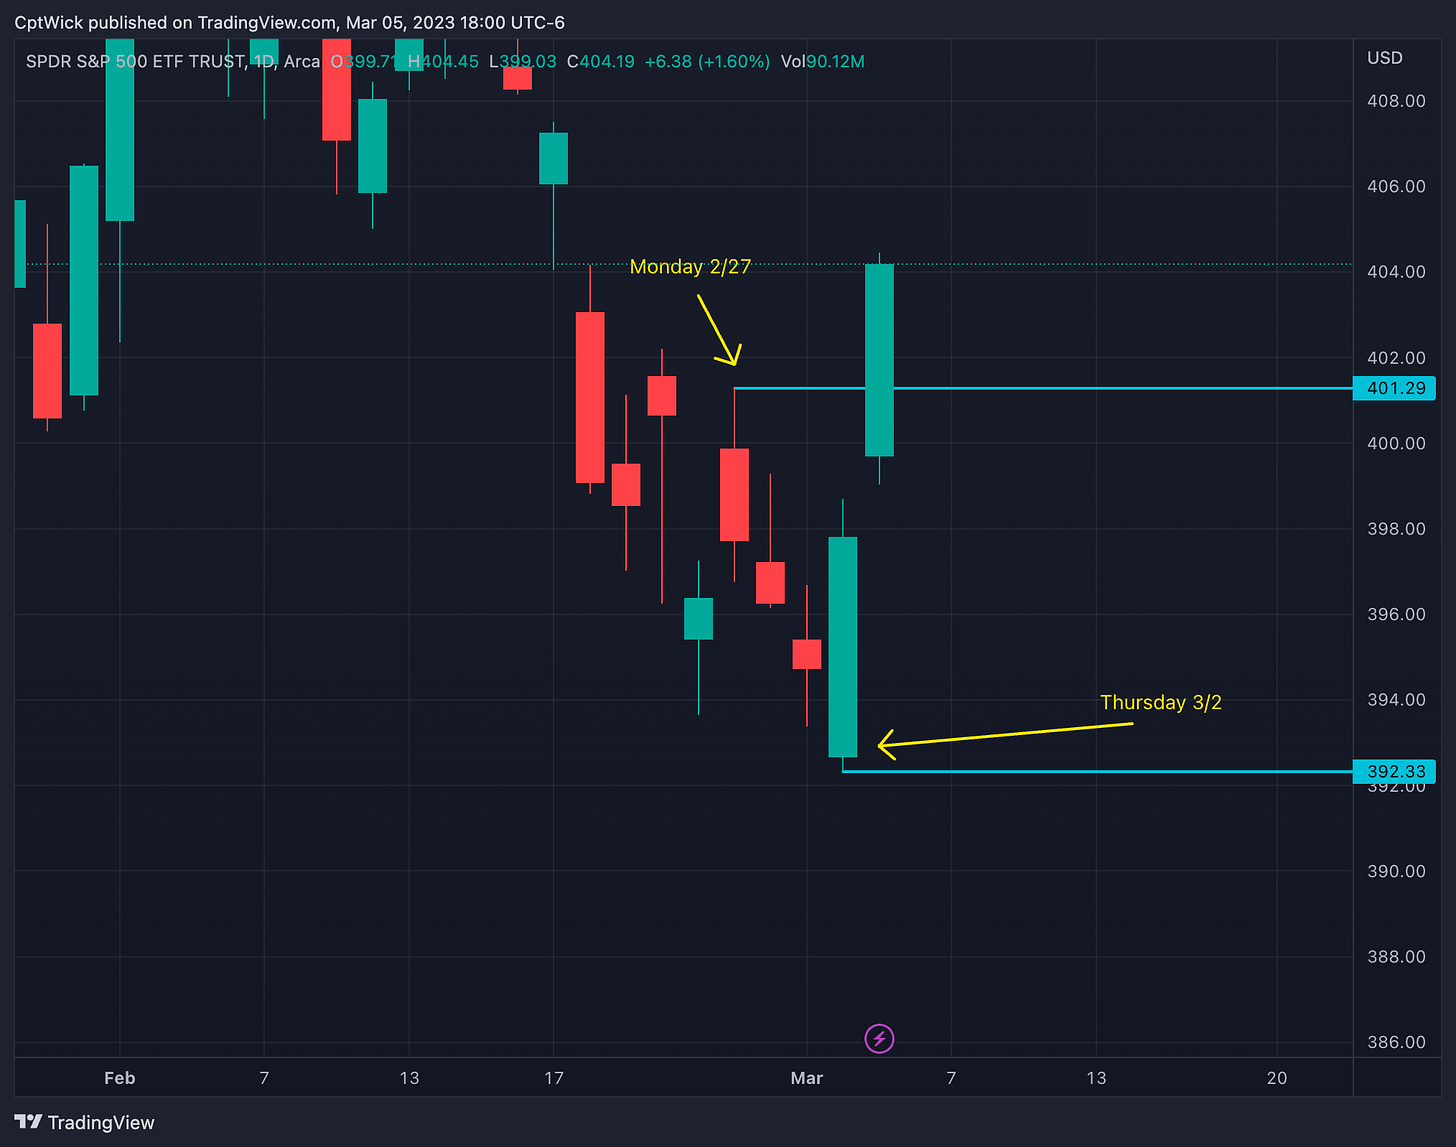
On Monday the 27th we gapped into 399 taking out some of the upside targets, I said that the bulls needed 401.80-402 to get to 404. Monday’s high was 401.29, the bulls failed to take it back into January’s value, it caused the sell off that I was looking for, notice the downside levels. Under 394 we would target 393.23 - 391.80ish (392.36 was one of my levels on Thursday, you can see it here. .03 off the low). The bears had a very very good opportunity to flush this down under 390 and they failed to get the job done.
I keep referencing the weekly market maker’s (MMs) expected move in my weekly/daily plans. These levels come into play time and time again. On Friday we were still pretty far away from that move, I had both scenarios thought out and all we had to do was execute. There is no way of proving if the downside would of done the same, but we were ready for it just in case. Throw the bias out the window and play the levels. Bus stop to bus stop! We are just getting started here at Dark Matter Trade, are you in?
—Weekly Pre-Plan—
If you have been here before you know the drill… Big picture first! Lets look at the MMs expectations on the week and find the bigger areas of interest.
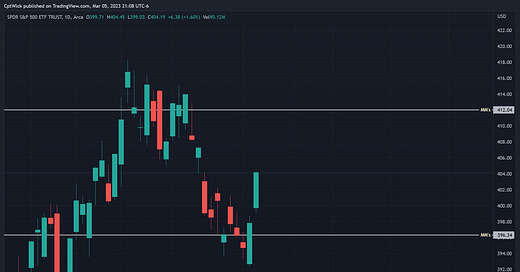
The MMs expected move is $7.85 which gives us a Friday(3/10) target of 412.04 or 396.34. Once we get into the other details you will see how these two values line up in our analysis. I don’t make up these values, they are all available to public if you know how to find them. Or if you want to me to do the work for you, then keep tuning in!
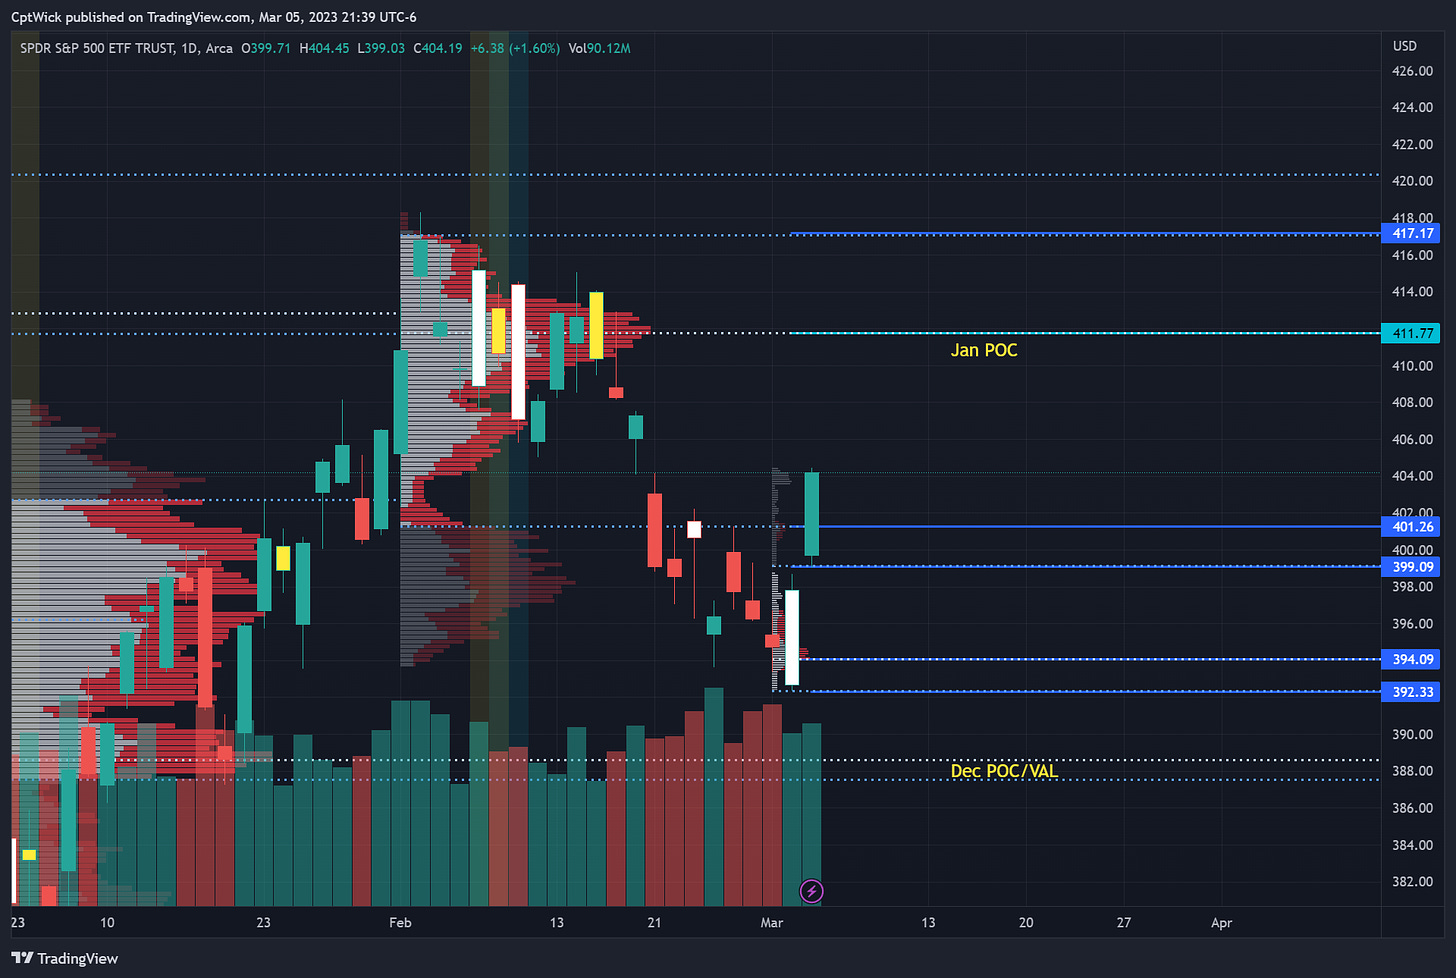
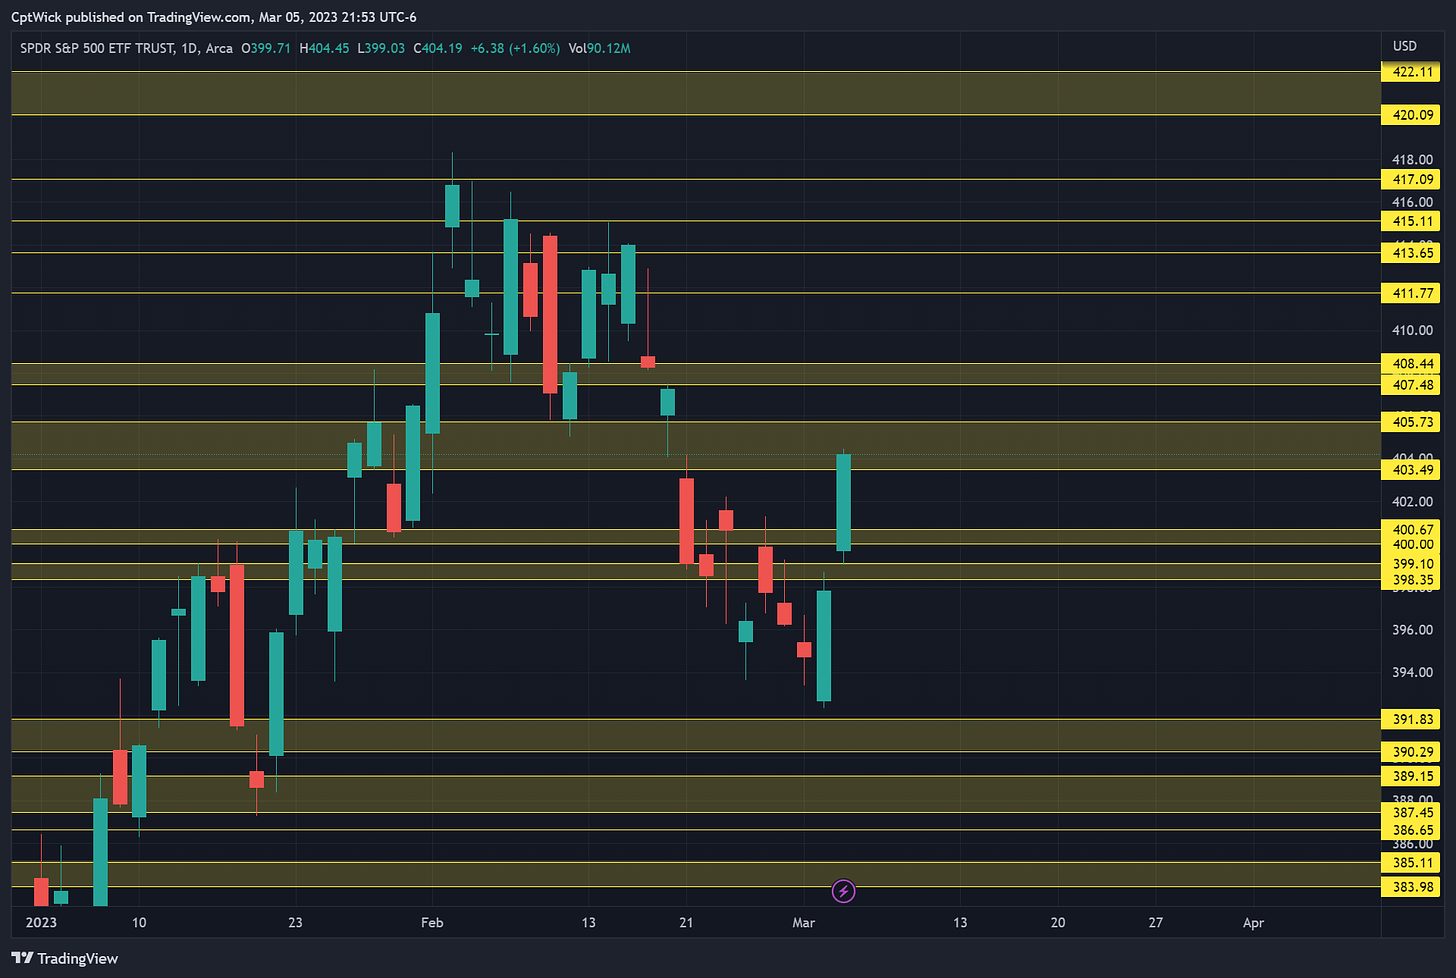
Looking at the monthly profile, this is strong by the bulls if they can hold this, 401.26ish is January’s VAL, notice how the bears created a imbalance down under the VAL and now the bulls have brought price back into January’s value. We need more confirmation other than just this chart to make a informed decision, but looking at this, one could say that the bulls seem to have taken back control. Or have they? I’m looking for the bulls to hold 401-399 or we could make a run for 392-388. If they can hold this area I think we can make a run at 411-412 maybe 417+ but we need more info.
When we break the volume down and look for areas of interest this is what I came up with. We need to zoom in a little further to find some voids in the monthly setup because we only 3 trading days into March.
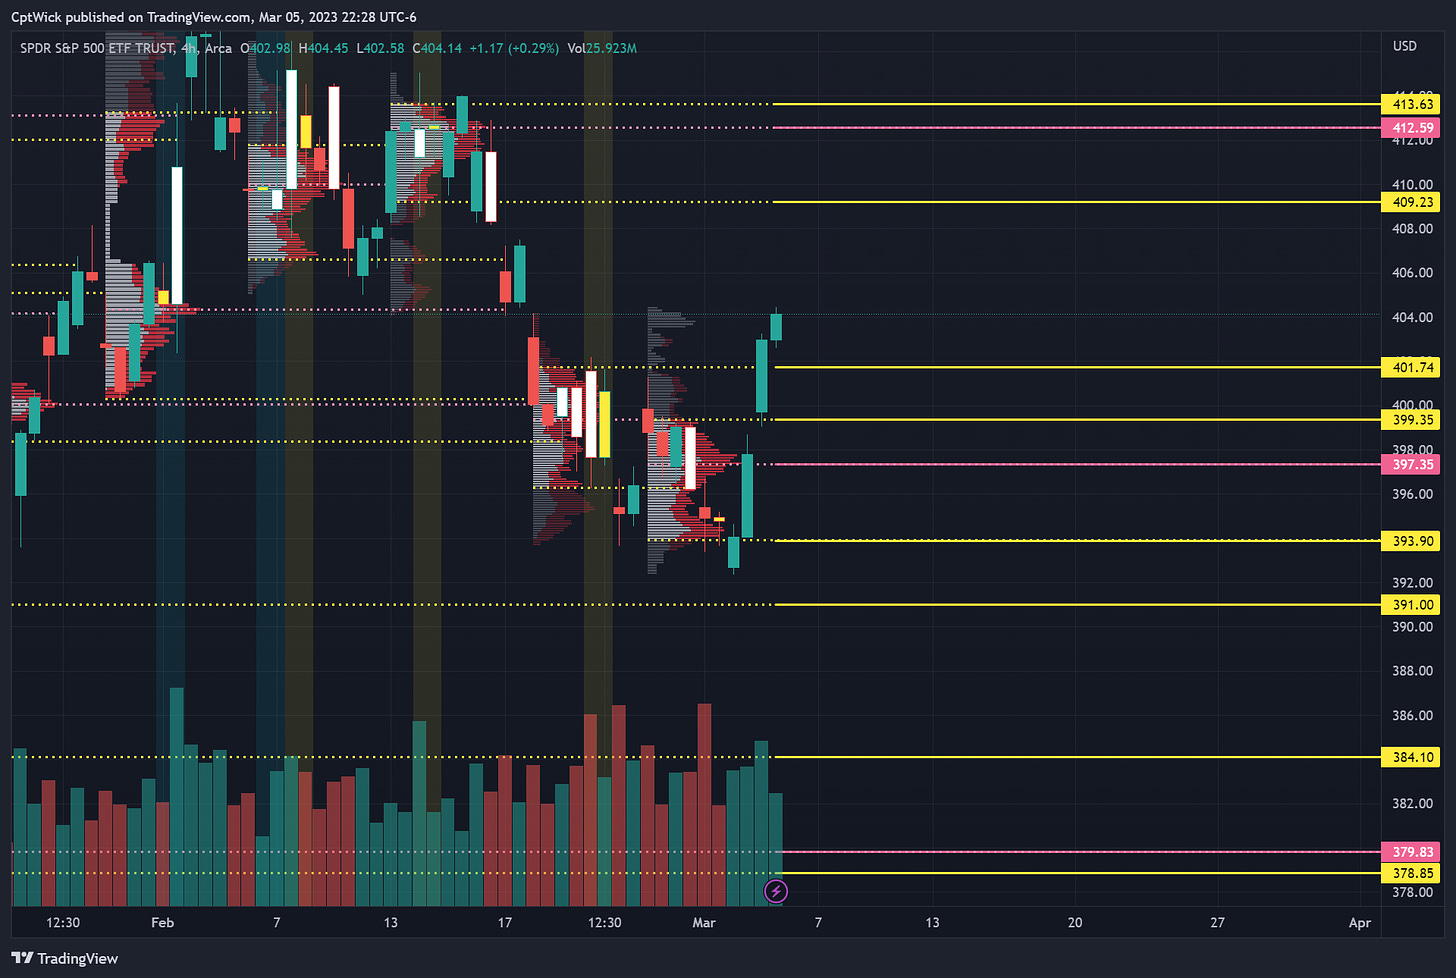
Now if we zoom in on the weekly we can see where some of the gaps are filled in and we can also see that some of the areas “overlap” and this brings conviction to these levels.
Last weeks POC is sitting around 397.35 and 399.35 is important because it was last weeks VAH and it was also the POC from two weeks ago, we have the two naked POC’s at 412.60 and 379.80. The weekly is showing the same thing as the monthly, the bulls want to see 401- 399 hold.
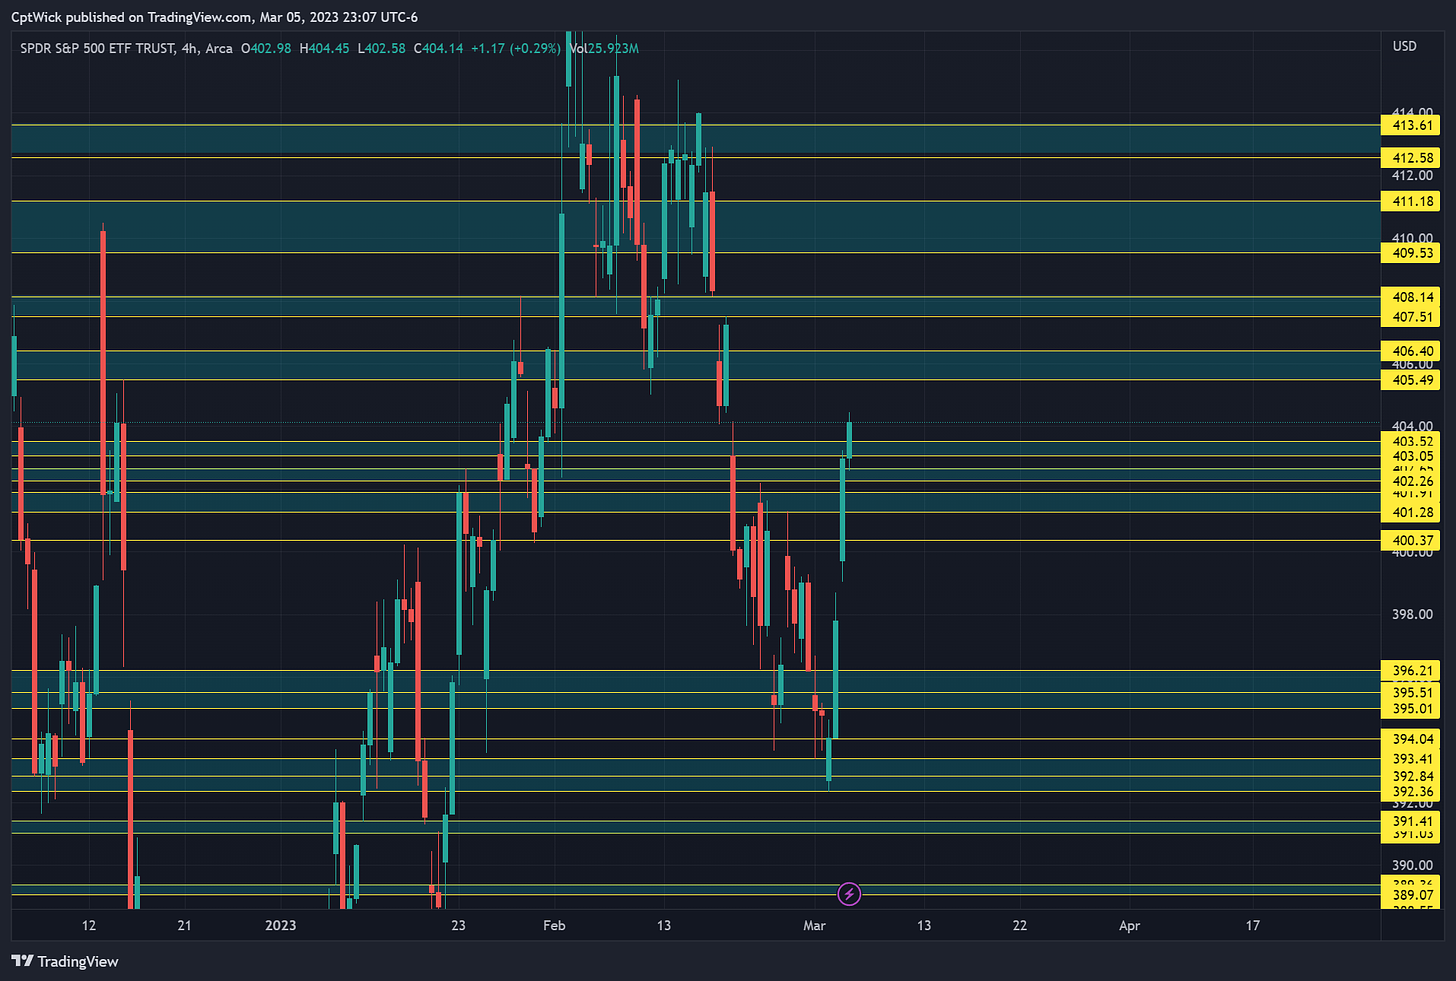
When we add the supply and demand we get these levels. I know it is a lot but we are not going to use them all, again I just want to show you how I am getting these levels more or less.
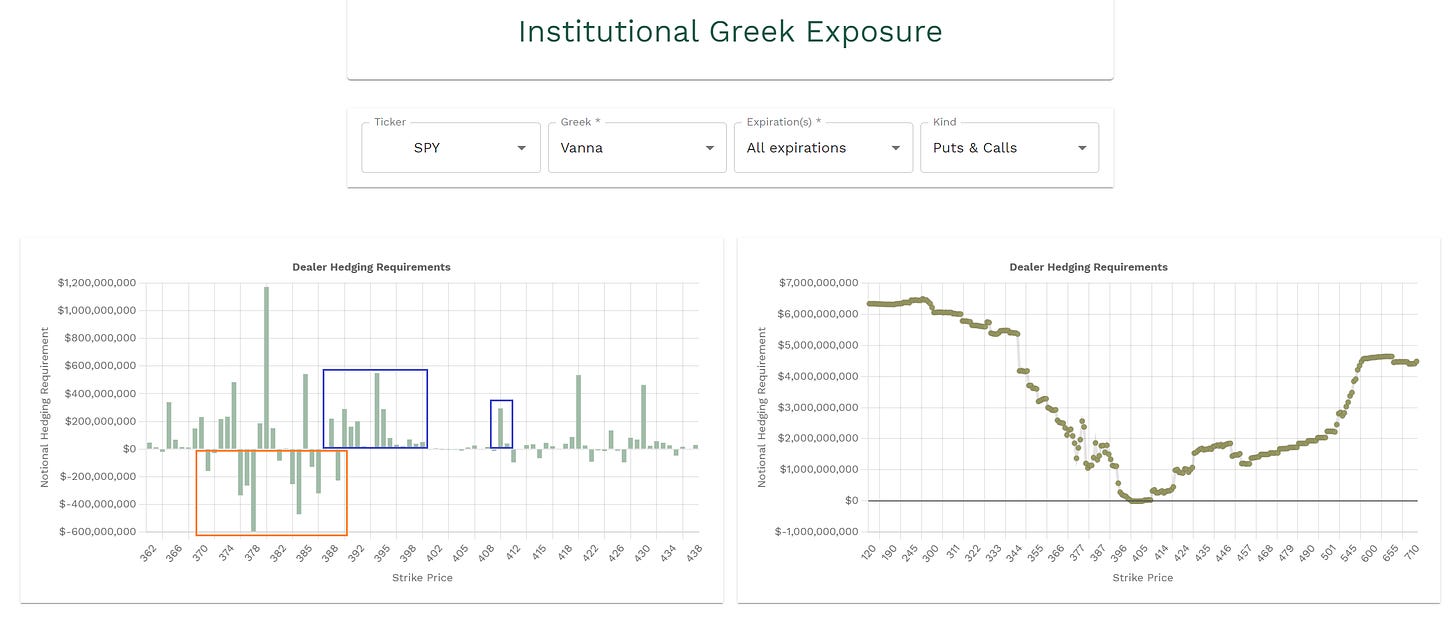
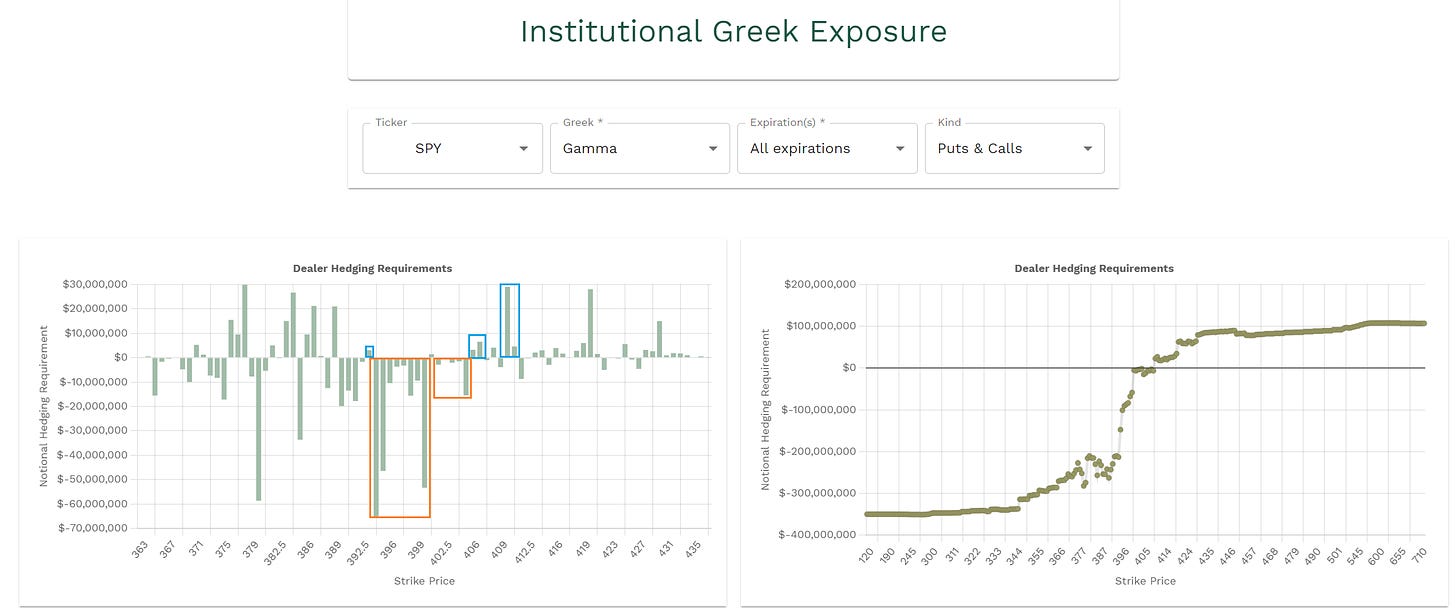
The next step in the process is to head over to Volland to see if the greeks/dealer positioning can help us define these levels.
The aggregate vanna on SPY is showing a gap at the spot close on 3/3. We have a cluster of positive vanna below from 400-390 and negative cluster’s below as well, notable levels above us are 410 positive 412 negative. We need to now look at gamma and see what we have there for this gap in vanna.
The gamma is negative where we closed on Friday and we have more negative vanna below us and with some positive at 389, 393, 406-408 and 410.
—Weekly Trade Plan—
Bullish Scenario
Bulls need 401.75-399 to hold
Not much support from vanna and what I mean by this is we have positive above and below so we need to get out of the vanna gap to see direction.
We do have a smaller amount of positive gamma at 401, this could be support but its not that much.
On Friday we closed at 404, we could have some dip buys at some of the weekly levels. Before 401.75 at 403.50-402
We are still sitting in monthly supply until around 405.75, above that the next area is 407.50-408.50
This is where I would maybe expect some selling pressure because 1) Low volume/gap in price 2) Positive gamma
409.23 would be next as it is weekly val
Negative gamma at 409 with positive vanna at 410-411 and negative vanna at 412 so above 409.23 we can see 412.
If they can push above 413.75 I want to target 417+
These are weekly levels let price talk to you, if we are holding 401.75 and VIX isn’t doing anything or going down that might be a good indication that they want to take us higher. We might not even trade 401.75 this week, I cant tell you 100% certainty what is going happen, but hopefully I can help paint a picture of what might happen.
Bearish Scenario
Bears need price back under 399
The positive vanna and negative gamma could spark a strong sell down to 394-392, this is also where our current POC/VAL sits.
Under 399 my first target would be 398.35-397.35
Monthly demand and weekly naked POC
396.20-395
Weekly demand
Under 395 target 393.40-392.33
Weekly demand
Positive gamma at 393 (could be support)
Under 392.33 I think we can go 390-388
December POC
TL;DR
Upside targets above close (404.19)
405.75, 406.40, 407.50, 408.50, 409.23, 410, 411.77 412
Downside targets below close
403.50, 401.75, 400, 399, 398.35, 397.35, 396.20, 395, 393.41, 392.36, 390-388
A nugget of wisdom
You don’t have to be a bull if we are trading above 401.75, you can be a bear at 405.75 or at 407-412, or you can be a bull at 399-396, you need to be #paytience with your entries and you need to have a exit plan. Use these levels I gave you and watch how price reacts when they trade, also keep your eyes on VIX, its a good indicator (most of the time, I say this because you can have situations where IV is up and so is spot, but that is for another time), if you have been following along with me you know that these levels are important. You just need to learn how to trade them, with that being said would you like some video content? I am thinking about doing a weekly plan video and then a weekly recap video, let me know if you think that would be beneficial!
Happy Trading,
—WICK—
To cover our basis…
Welcome to my Substack where I provide a daily SPY trading plan to help guide my intraday trading. The purpose of this letter is not to advice you on your trading or investment decisions. I am simply documenting my daily trading plan for myself to help with planning and execution. These are simply my opinions and the data sourced from the likes of vol.land, TradingView, Tradytics and others. The stock market is risky, gains are not guaranteed. This is not about getting rich quick, but learn to educate yourself and make the necessary financial decisions on your own. This is not financial advice.

