Readers,
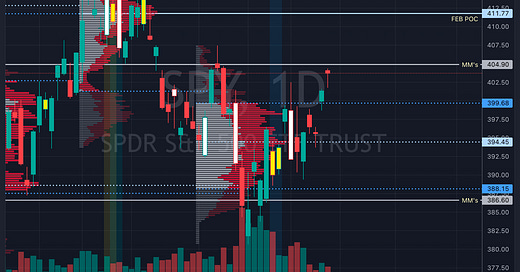
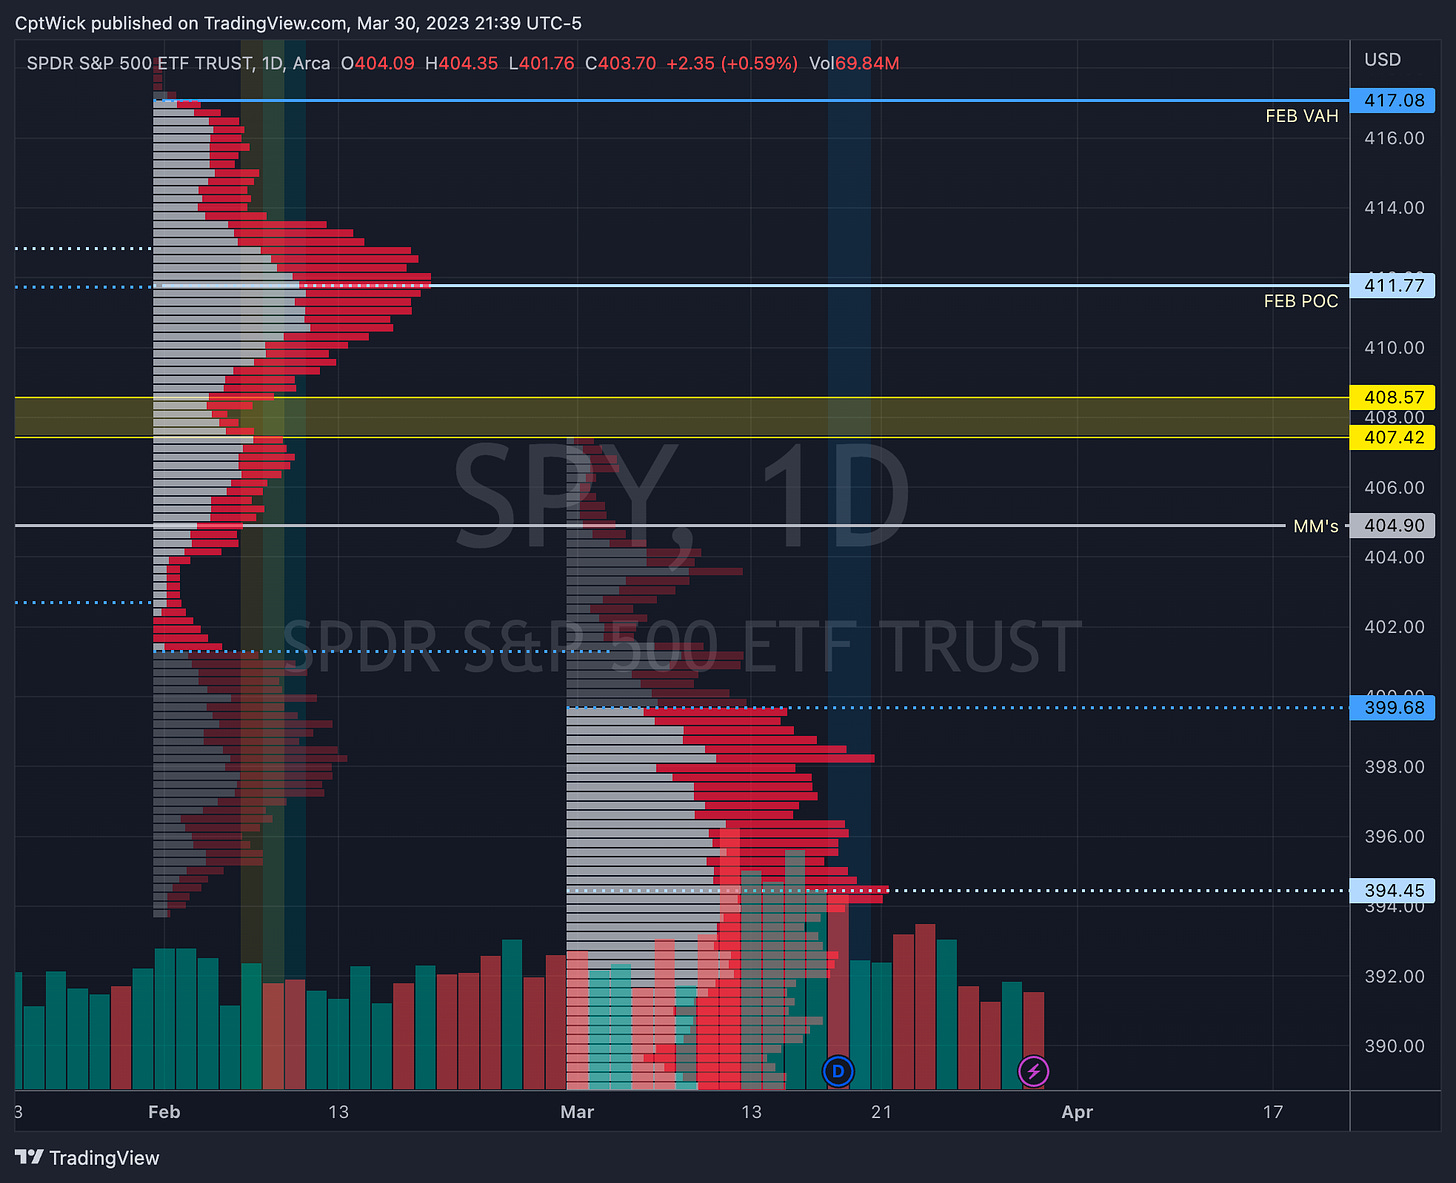
Let’s go over a few things to catch back up to speed here. We have one trading day left in the month and we are currently at a monthly imbalance to the upside, and we have made it into February’s value area on a second attempt. Tomorrows news could set the tone for April.
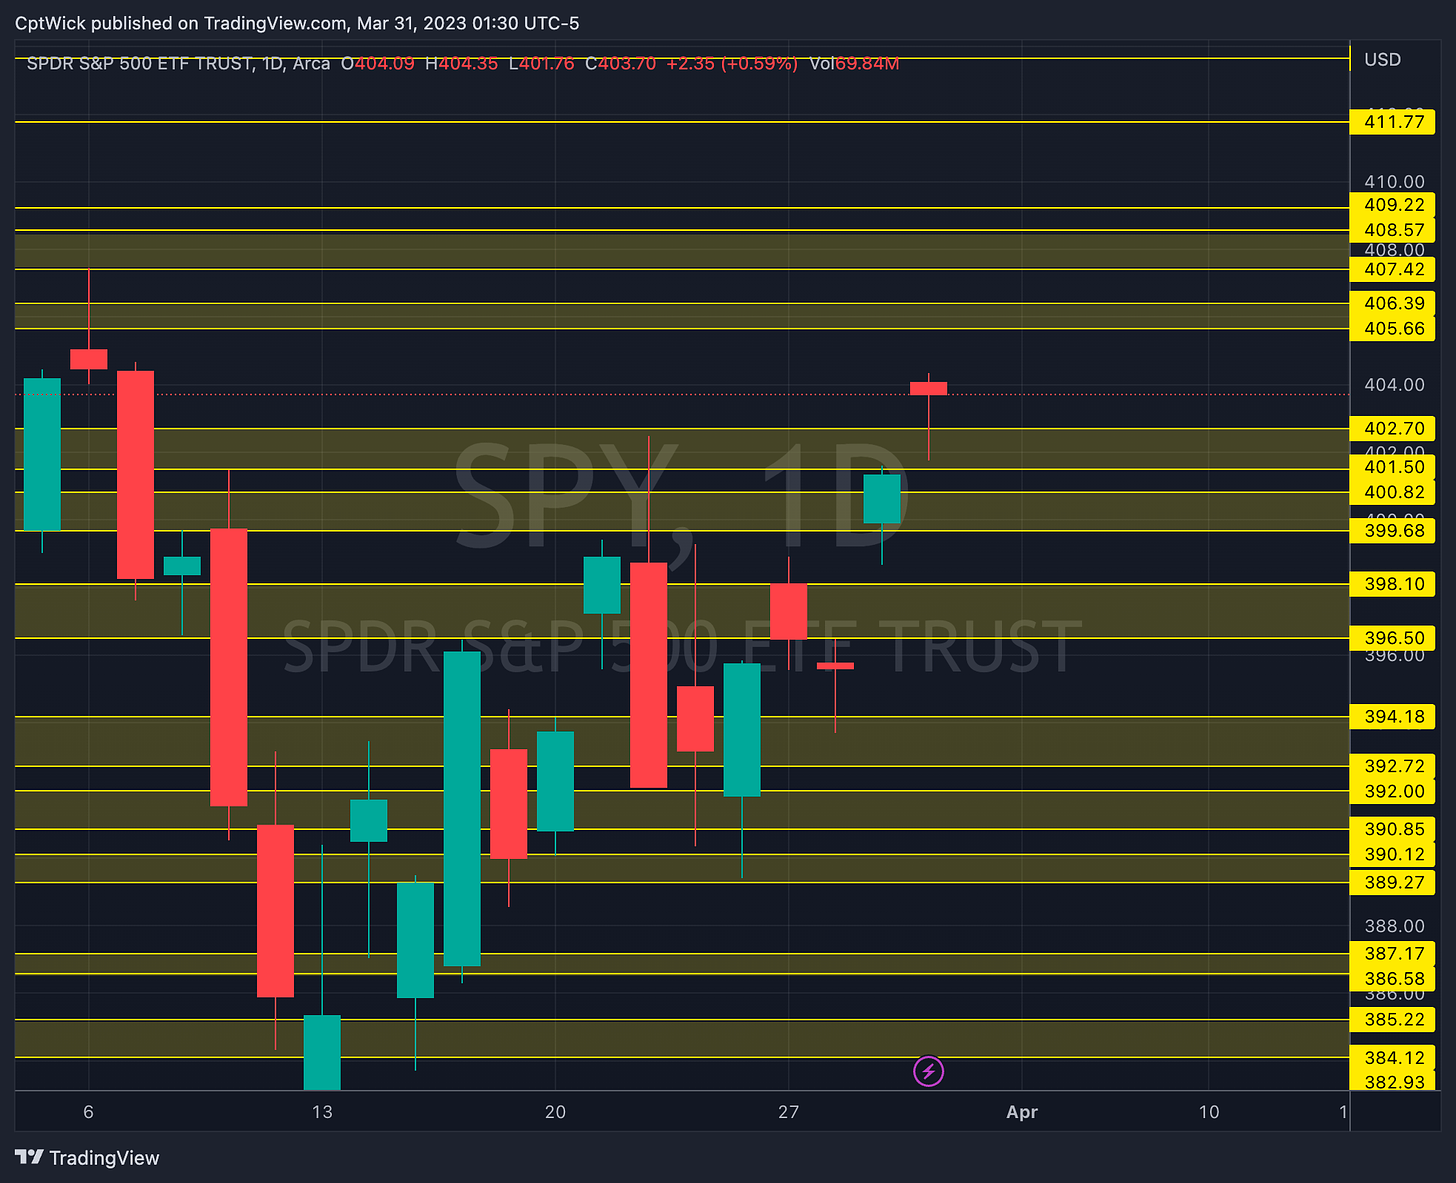
We are trading well above this months current VAH 399.68 and we are above February's VAL at 401.29.
So looking at this we can come up with some like scenarios to try and find a trade. PCE is released tomorrow so we could potentially have a wild open that could cover a wide range. We are also very close to the MMs weekly upside expectations of 404.90. If they bring it back to balance we could fill some gaps and possibly target 394-390 area. The profile is currently showing a b signaling weak sellers, so dips into 399-388 could get bought longer term.
If price stays accepted over 401.29 there is a chance that in near future we will make a run at 411.77, February's POC.
I think that the real wall for the bulls is going to be this low volume area between 407.42 and 408.57, I think if the bulls can over take that area soon, we can see that POC at 411.77.
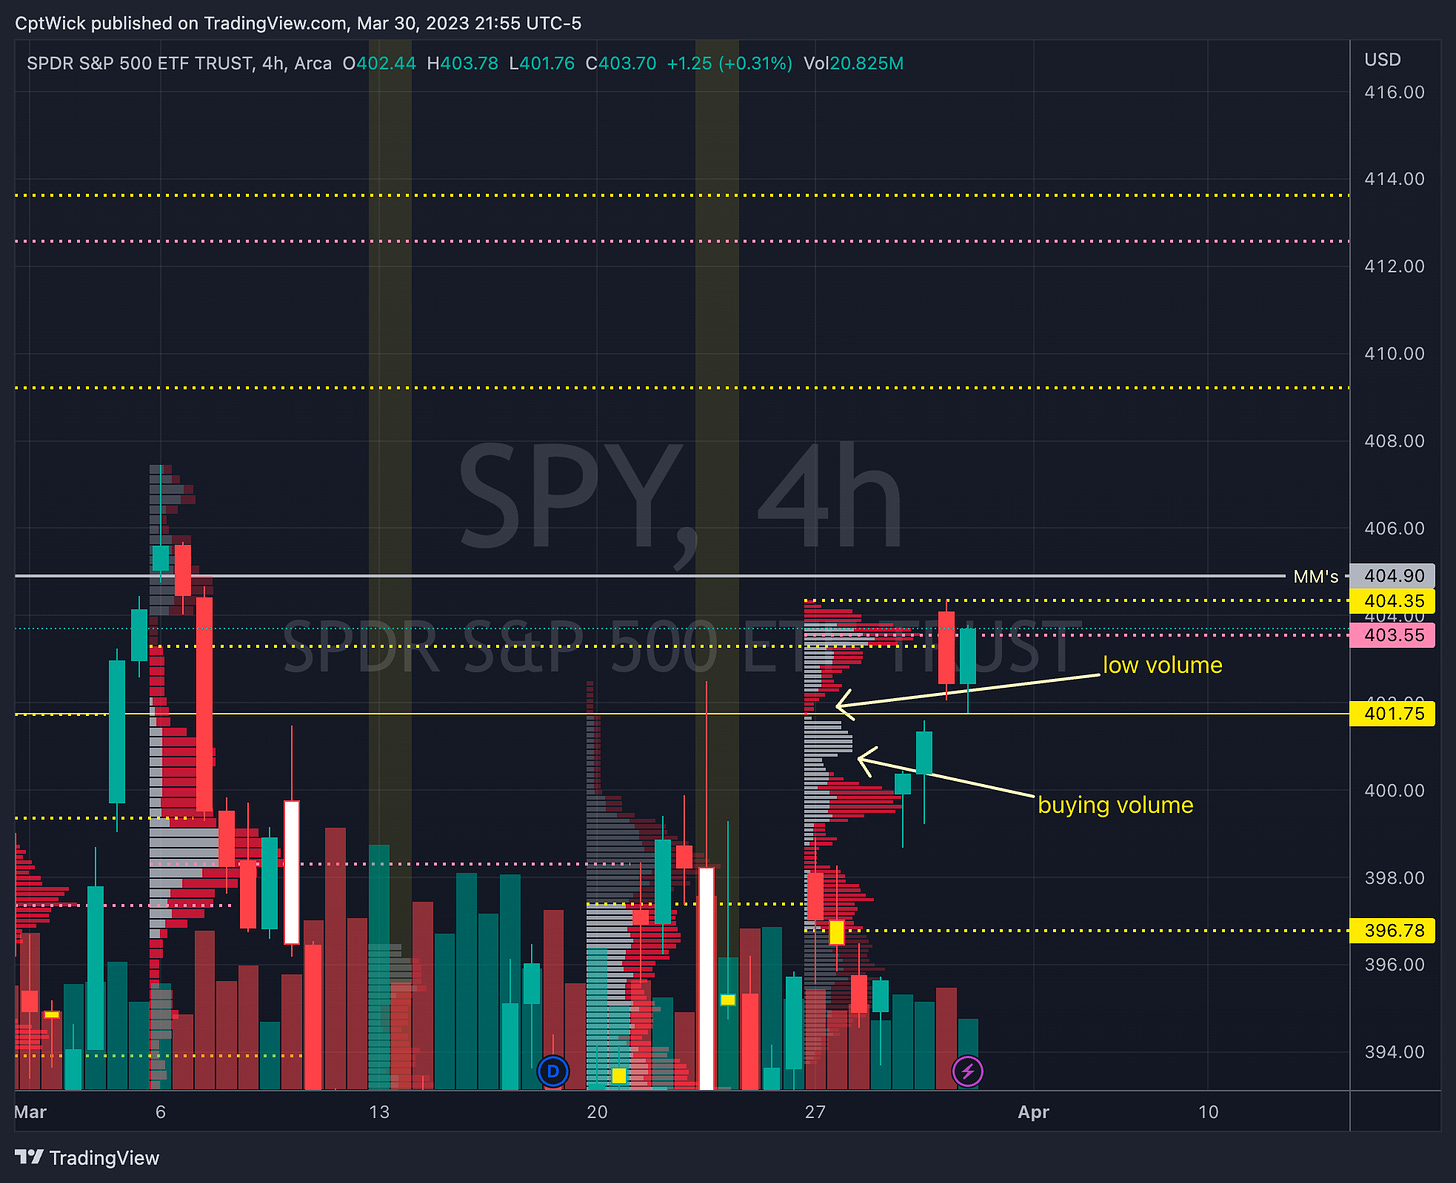
This weekly profile is interesting, we can see that there is very little volume around the 401.75 level, with a bulk of buying volume looking to support it into 400 level.
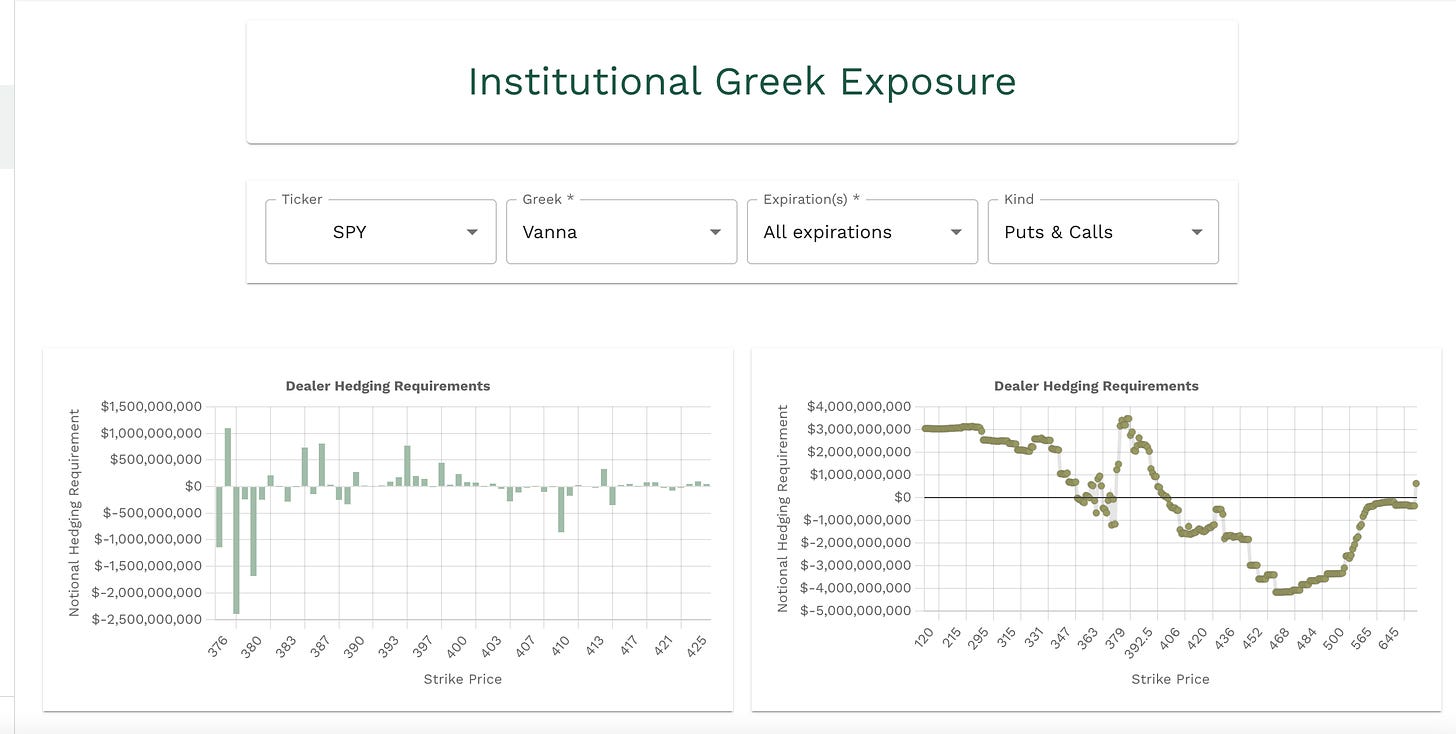
Aggregate vanna is showing negative above us until 412-414, and positive below us until 389-388, these are also key areas on the volume profile.
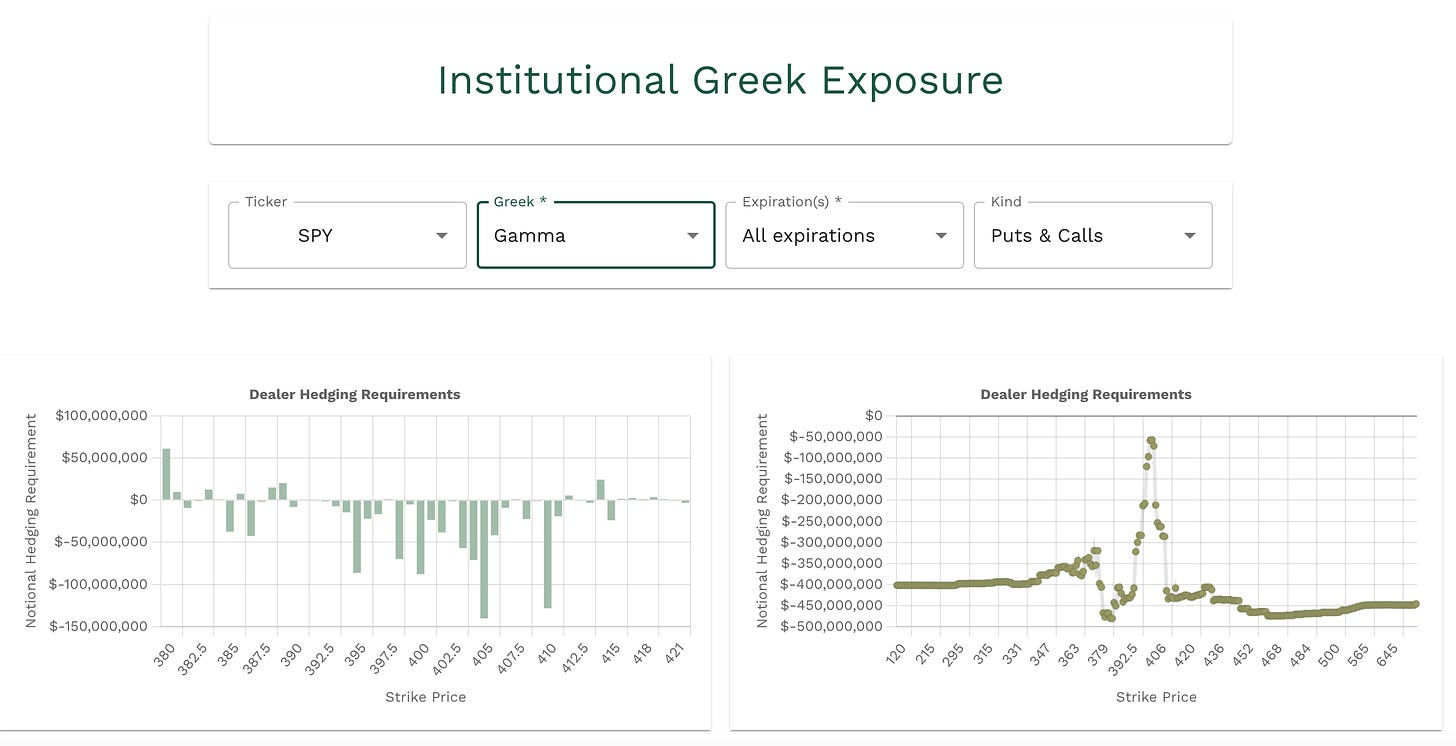
Gamma is positive at 388-389 and 412 and negative in between.
The data for me is meh, its been saying roughly the same story for some time now. It appears that we have limited upside but yet we keep pushing up. This is why we need to have multiple ways of looking at the market, and its why I use volume profile in my trading strategy, I can see where they key areas of interest are.
Bullish Scenario
Above 402.70 target 404.90
404.90 is the MMs weekly expected move to the upside.
405 is a notable negative vanna level that could act as resistance
Above 404.90 target 405.66, 406.40, 407.42, 408.57, 409.22, 410, 411.77
The vanna and gamma are both negative at these levels so in order to push through we are going to need VIX down lower, or some type of a news event, PCE?
I would think that according to the volume profile the major upside hurdle to cross for a bigger move up is 407.42 to 408.57.
Bearish Scenario
Below 402.70 target 401.50, 400.42, 399.70
The vanna is positive from 403 to 390. So if we get rejected from February's value area again we could see a violent move down. Towards that 389-388 level where the negative vanna sits.
399.68 is also the current monthly VAH with only one trading day left in March.
Below 399.70 target 398.10, 396.50, 394.18, 392.72, 392, 390.85, 389.27, 388.15, 387.17
394.45 is the current monthly POC.
388.15 is the VAL, 389-388 is also a notable negative vanna/positive gamma area, this Ould be stronger support.
Happy Trading,
—WICK—
To cover our basis…
Welcome to my Substack where I provide a daily SPY trading plan to help guide my intraday trading. The purpose of this letter is not to advice you on your trading or investment decisions. I am simply documenting my daily trading plan for myself to help with planning and execution. These are simply my opinions and the data sourced from the likes of vol.land, TradingView, Quantdata.us and others. The stock market is risky, gains are not guaranteed. This is not about getting rich quick, but learn to educate yourself and make the necessary financial decisions on your own. This is not financial advice.

