Readers,
Today was reckless to say the least, but for the plan… it was a killer day. These levels I show you are the bread and butter to my strategy, it is something that will ALWAYS be in trading, volume and price. Volume or lack of volume, throw everything else out of the window, every indicator that you have used is meaning less without price and volume. We will talk about price and volume so much that you are going to get sick of it, but look at the results that it produces.
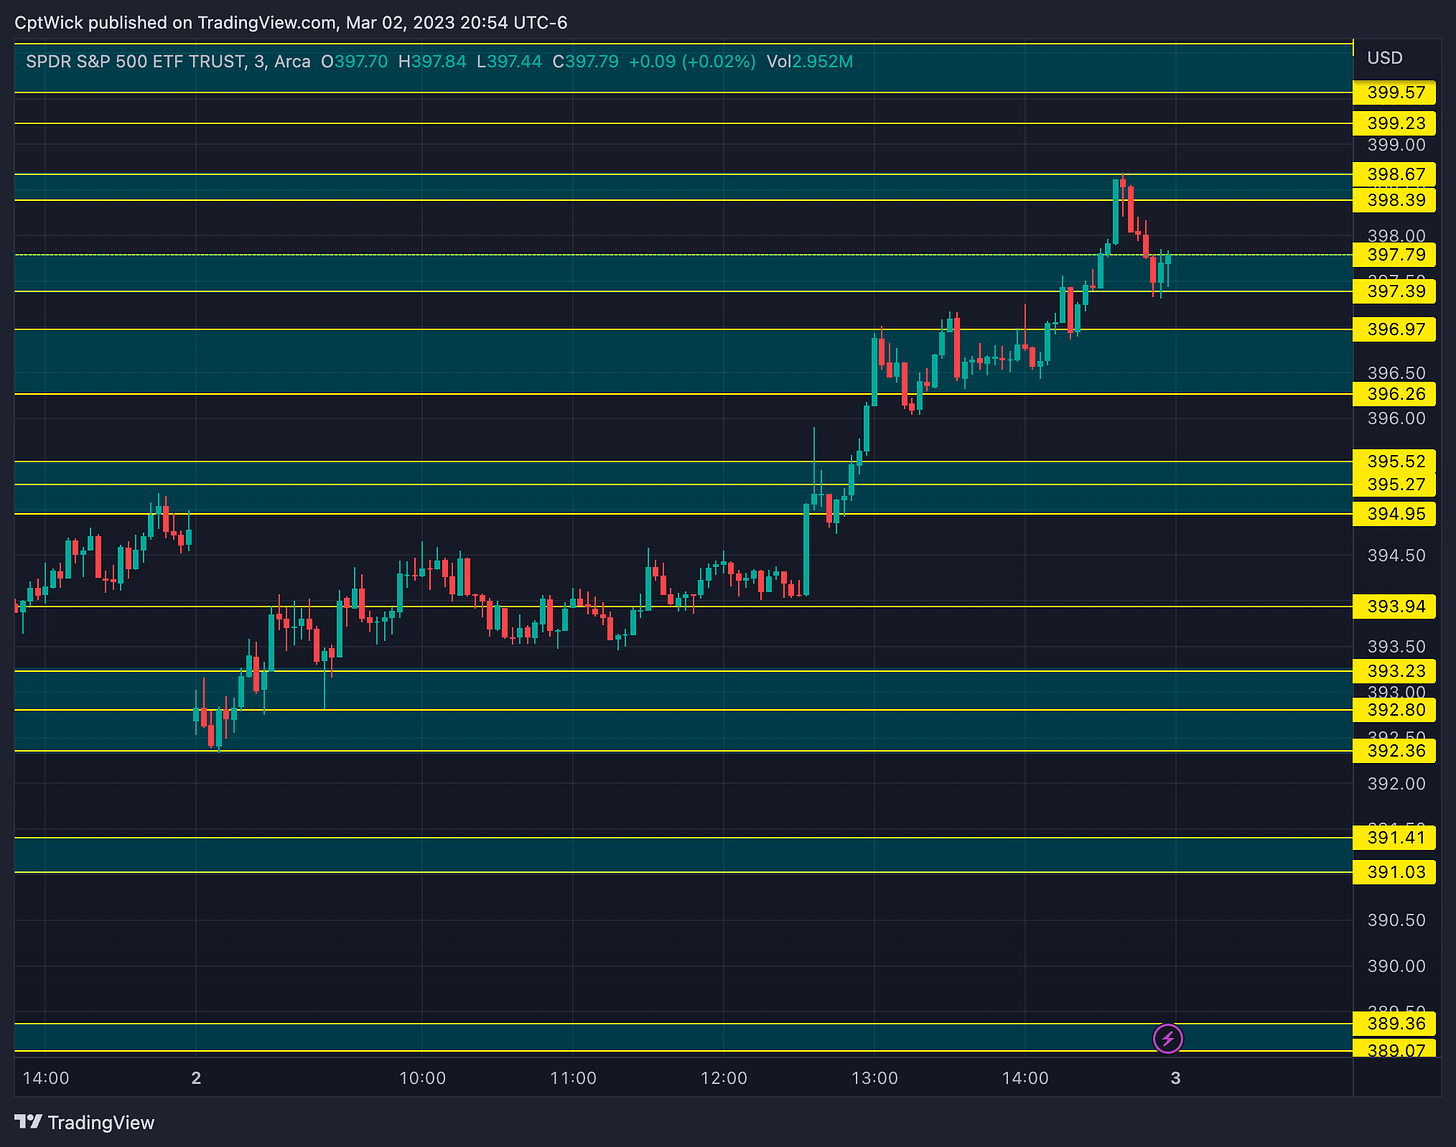
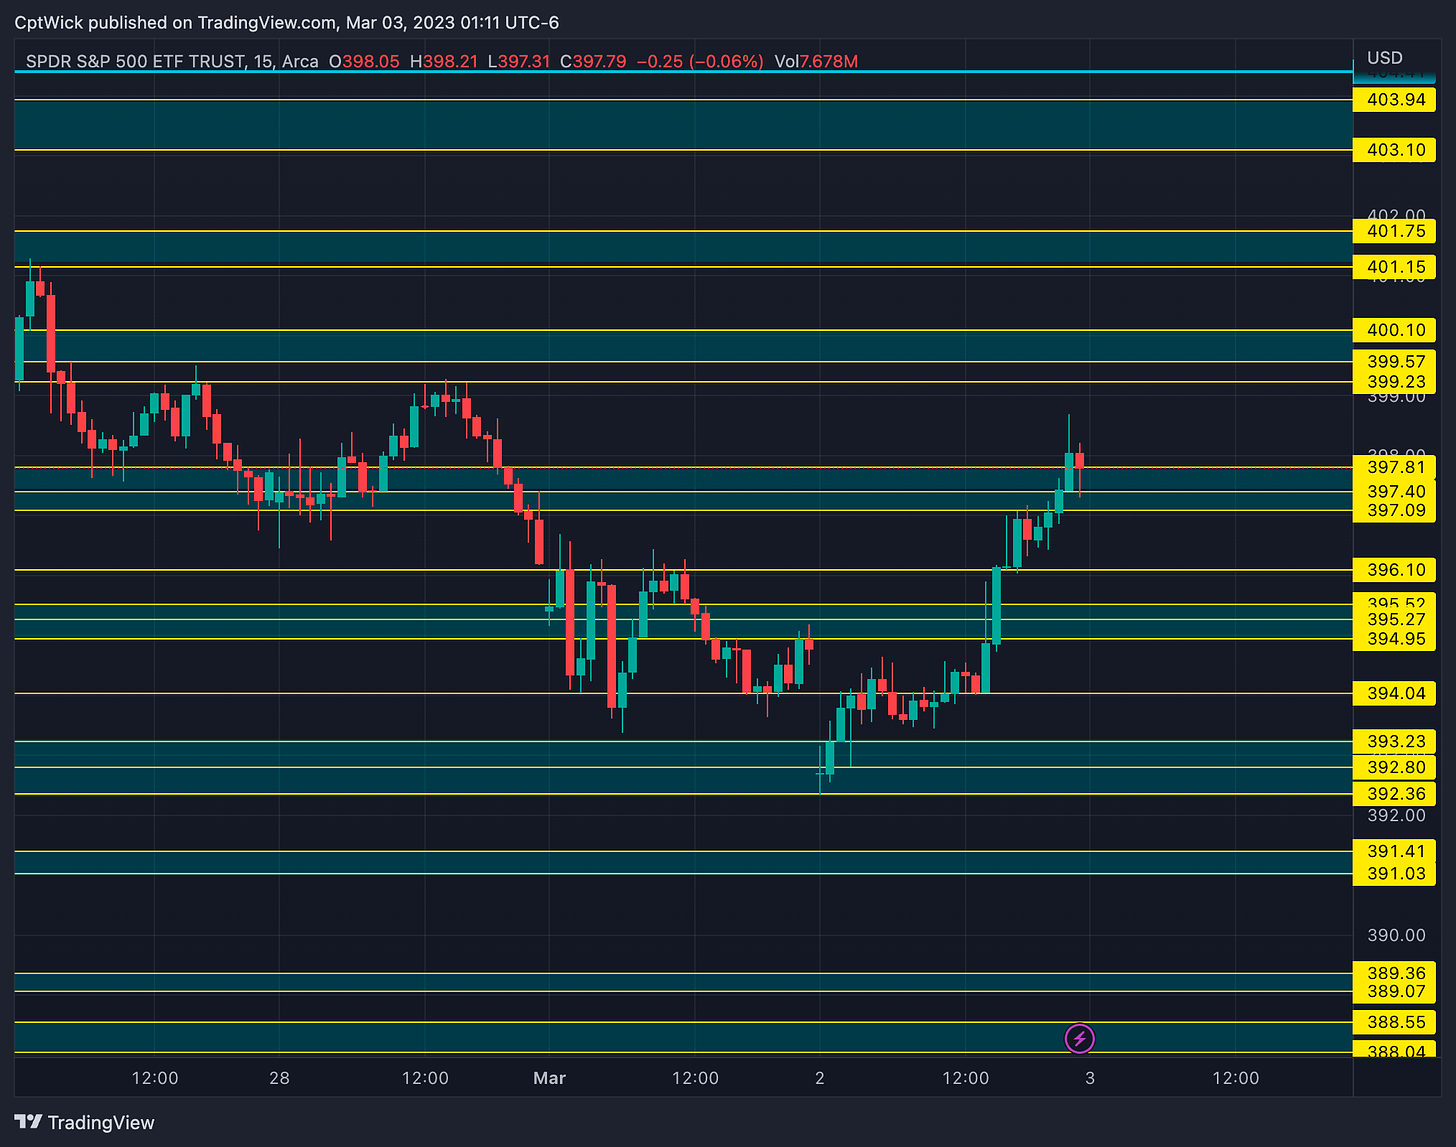
Here is a 3min chart with our levels from last nights plan. I have not changed or altered any of this, here is a link. Notice how the candles react when it comes into these levels, and more importantly, when it retests the key area. Study what the wicks are telling you, look at how price leaves comes into the level or “bus stop” if you will, and either consolidates inside the area usually hitting both sides and then it decides where its going. See how at the end of the day we blew past 397.79 and then extended right to the next level, just to come back and end the day. It’s truly remarkable.
At the open, we gapped down right into the beauty zone 393.23-392.36, I even sent out a tweet here saying that if this holds, we are probably going up 395+, and if we lose this area I wanted to target 391 and under.
How did I know that this area was going to hold? Well at first, I didn’t, I needed some type of confirmation, but when price was staying above 392.80 showing support I took longs, and we were holding the 200sma. I also use other tools such as Volland to give me the edge. Using this data in correlation with the volume is a deadly combo.
More to come in the future! Stay tuned!
—3/3 Pre Plan—
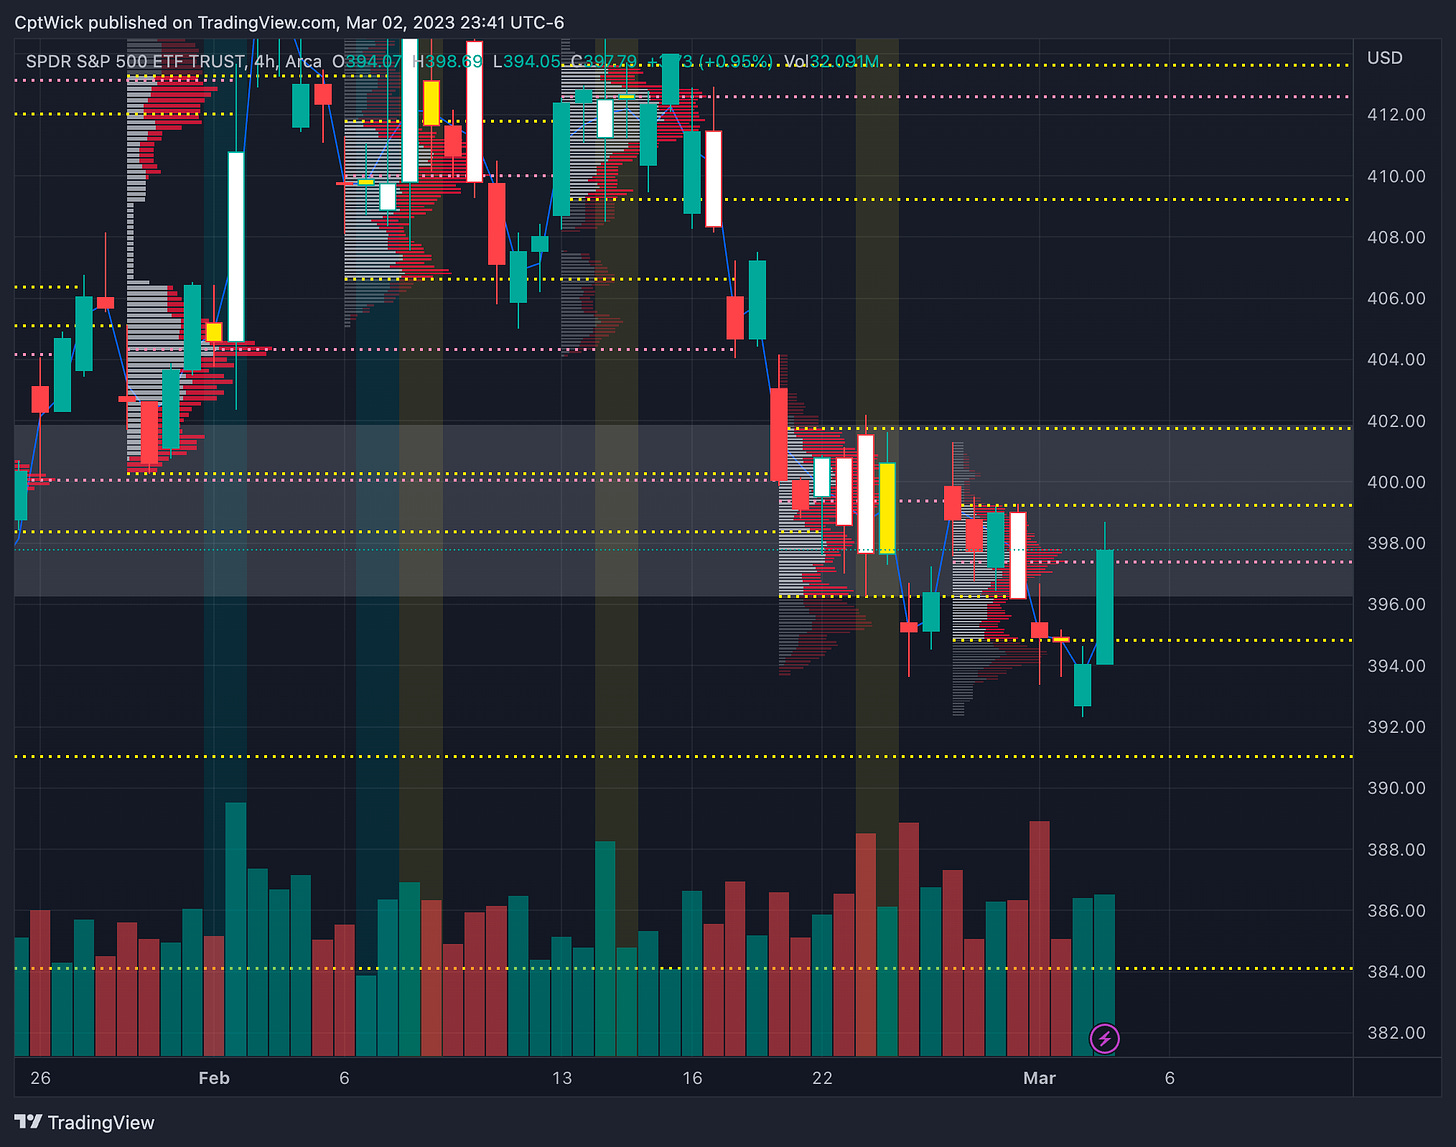
You know that I have been a bear once we lost 396.26 and we dipped out of the “chop zone”. The bears had a really good opportunity to take this down into 390-388 but the failed to do so. I get that there was a fed comment about them pausing and the algo bought it up, but it pushed priced back into this chop zone, or what was a chop zone.
This area is just last weeks value, we are now “balanced” again, so we might need to be cautions of getting caught in rough trading conditions if we stay here. So as of right now I have no bias, which brings me to another point that I struggle with from time to time and that is we shouldn’t have a bias. To be successful we need to know both sides of the story, we have to be nimble, and we have to have a plan for both sides. I now need more confirmation.
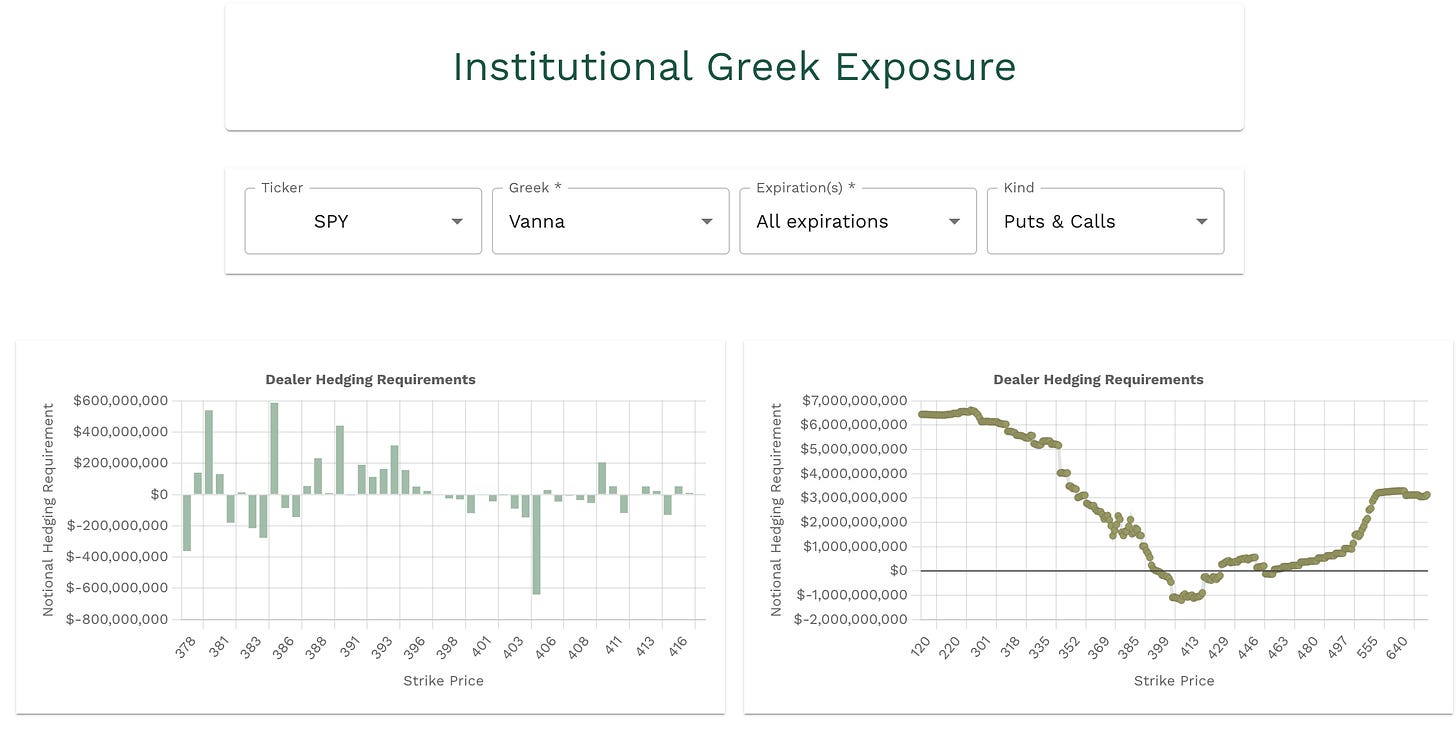
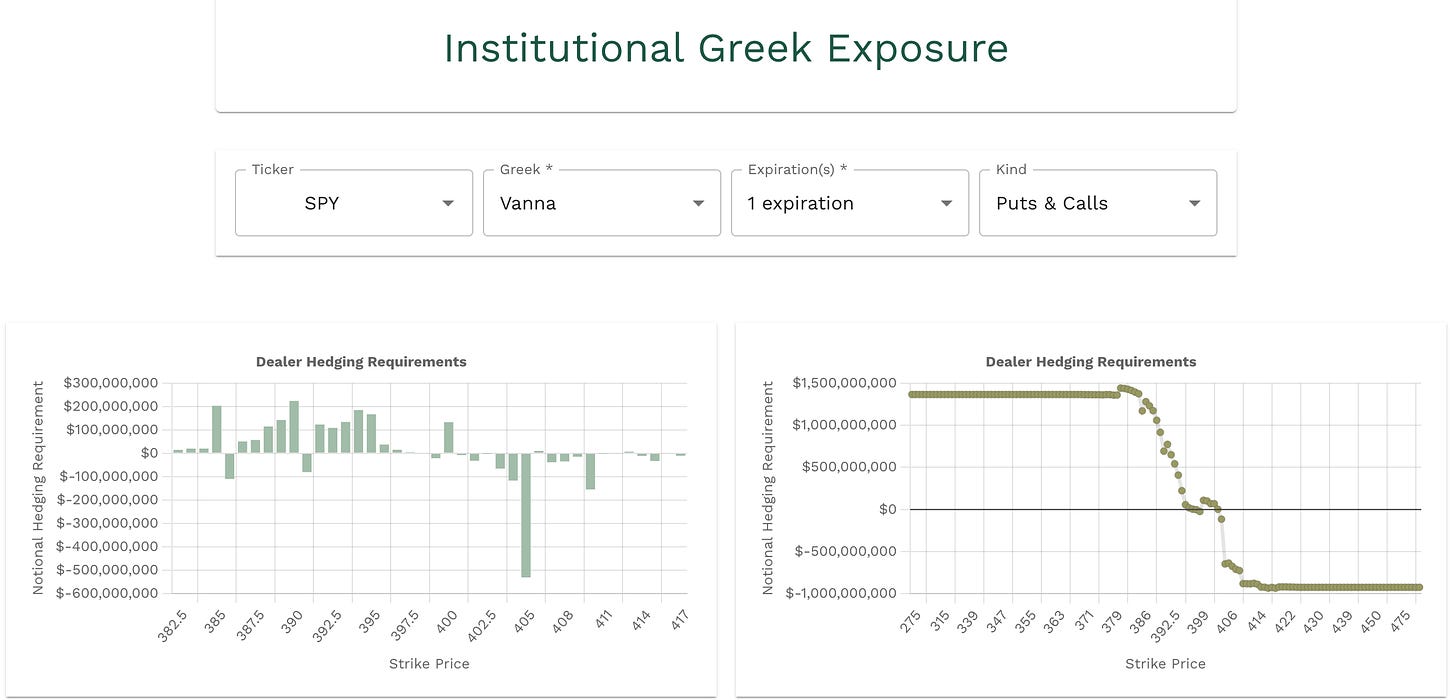
Aggregate Vanna is still showing the same thing, negative above and positive below, so no big change there.
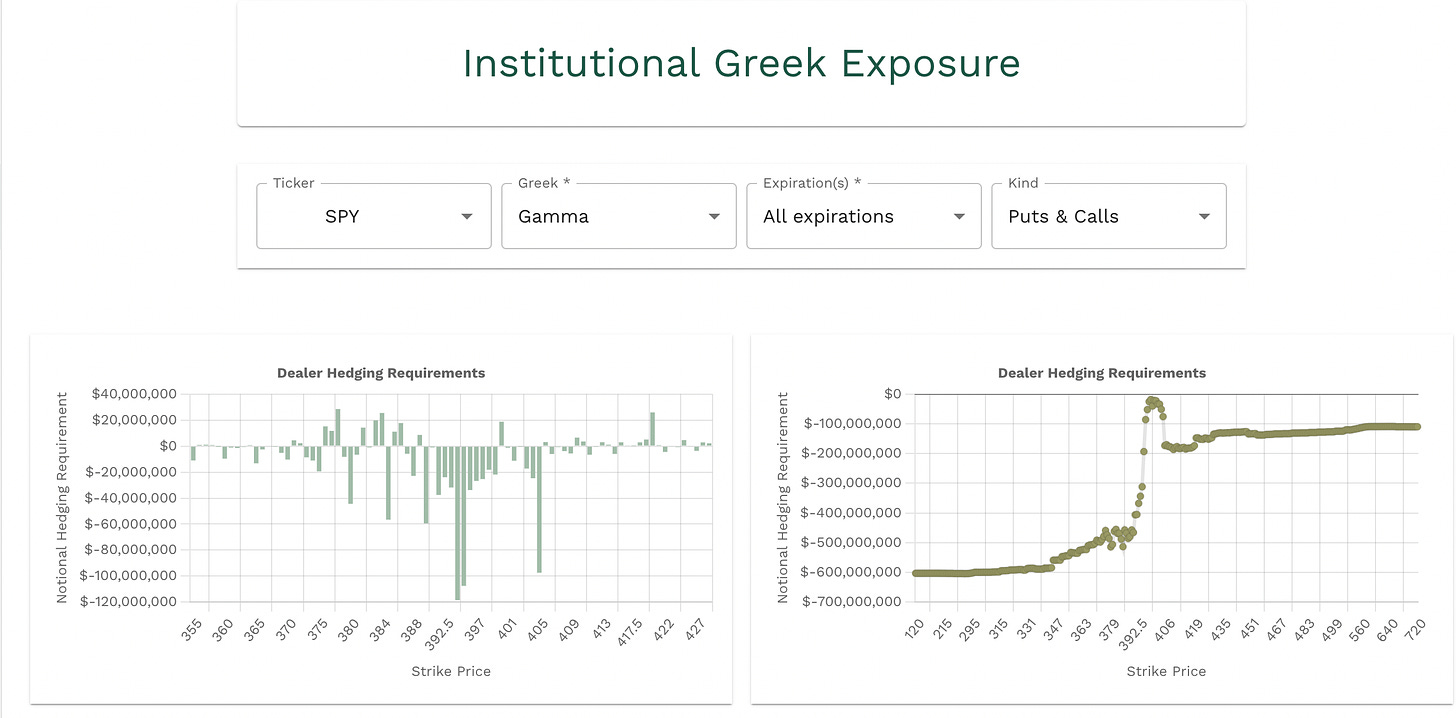
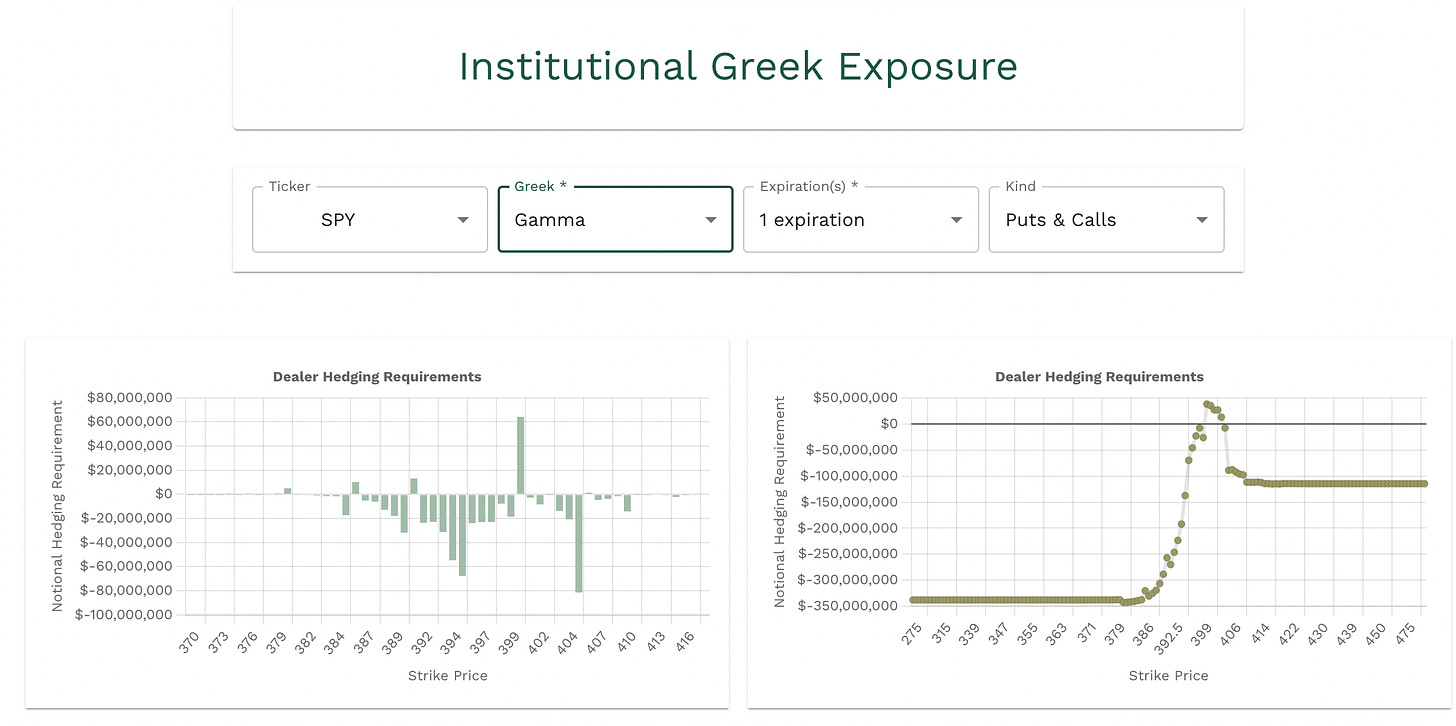
The gamma is also negative between 400 and 389, and negative to 406.
The vanna for the 3/3 expiration, we have positive at 400 and positive down to 392 and a negative cluster from 402-405 and at 391.
The gamma for 3/3 has positive values at 400, 391, 386.
—3/3 Trade Plan—
Bullish scenario
Above 398 target 399.23-400.10
If we take out 400 I want to see if we can see 404 (weekly MMs expected move)
In order to get there bulls will fight 401.15-402
403.10-404.41
Bearish Scenario
Below 397 target 396-395
If we trade under 395 that opens the door to 394 - 393.23 - 392.36
if we get past 392 target 391.40-391
then we target 390-388 (MMs expected move)
The data is showing that the upper levels might be tougher to achieve. 400 seems like it is going to be resistance but it can be very beneficial to the bulls if we can push above, I think this can lead to 404.
If we trade 400 early and fail, I want to target 396 and then follow our bearish scenario.
If we trade 396 early and it holds I want to target 400 and follow the bullish scenario
If you have been following along with this letter over the past few weeks you have seen how this levels play out. Pay attention to how price reacts at this levels. Remember they are bus stops, watch for wicks, consolidation and separation. Take them one zone at a time!
Happy Trading,
—WICK—
To cover our basis…
Welcome to my Substack where I provide a daily SPY trading plan to help guide my intraday trading. The purpose of this letter is not to advice you on your trading or investment decisions. I am simply documenting my daily trading plan for myself to help with planning and execution. These are simply my opinions and the data sourced from the likes of vol.land, TradingView, Tradytics and others. The stock market is risky, gains are not guaranteed. This is not about getting rich quick, but learn to educate yourself and make the necessary financial decisions on your own. This is not financial advice.


