Readers,
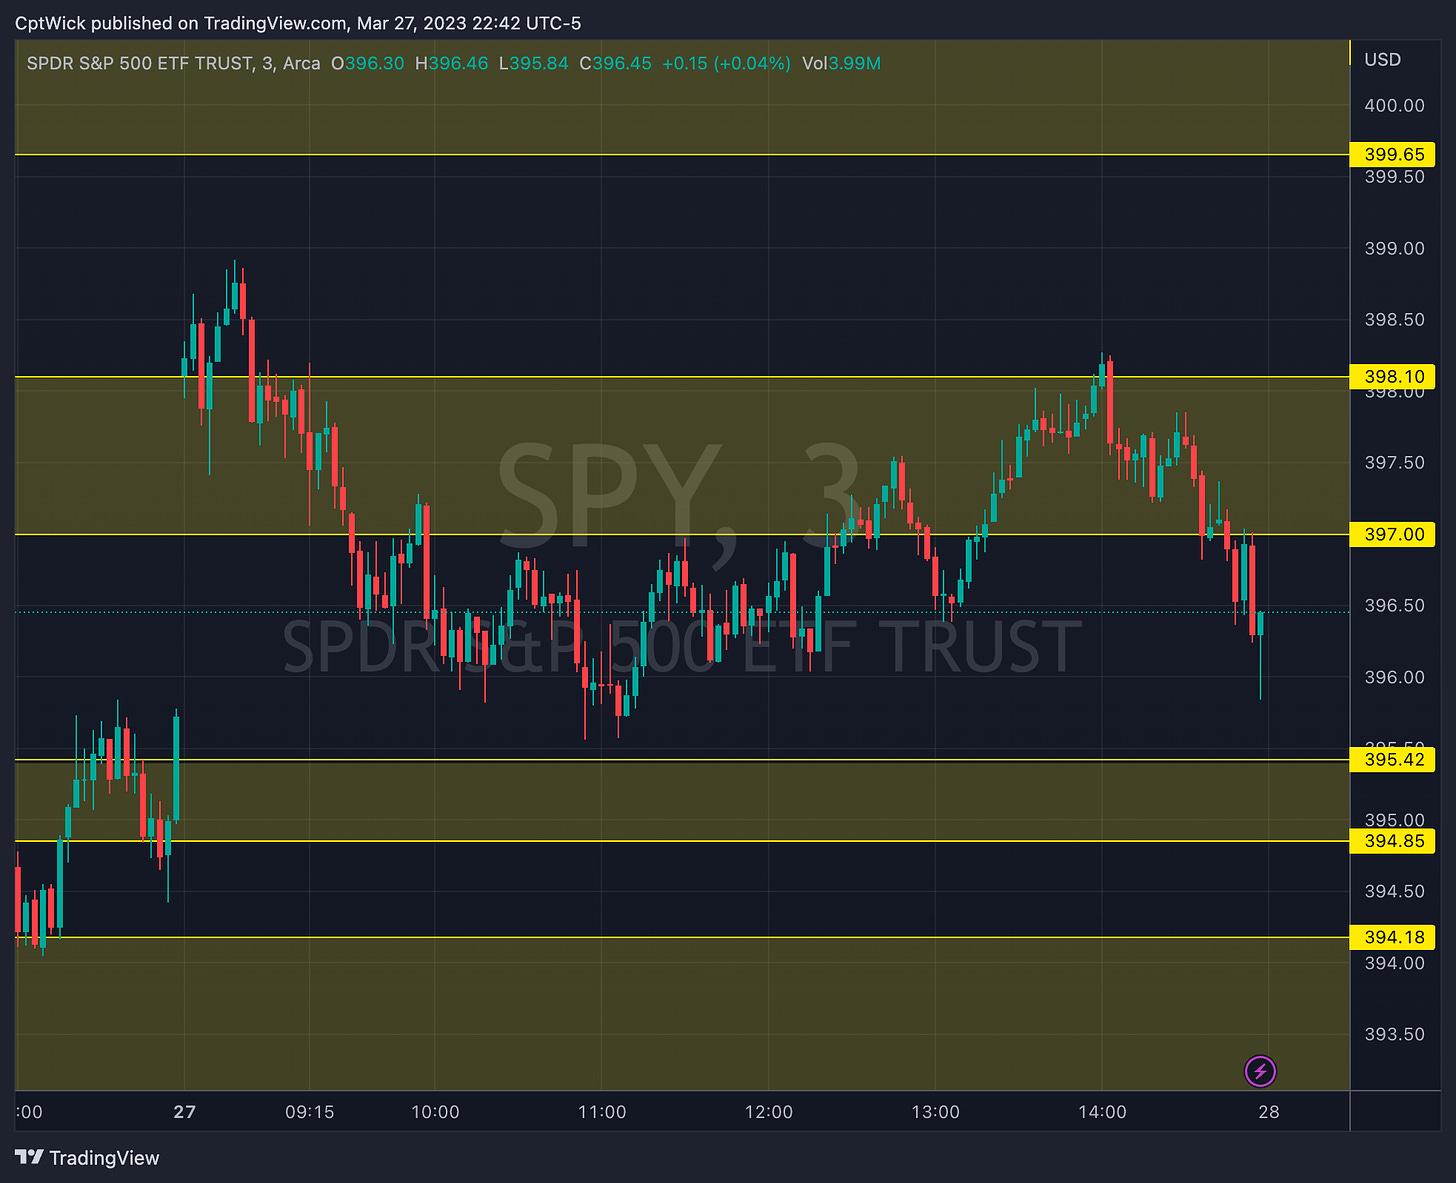
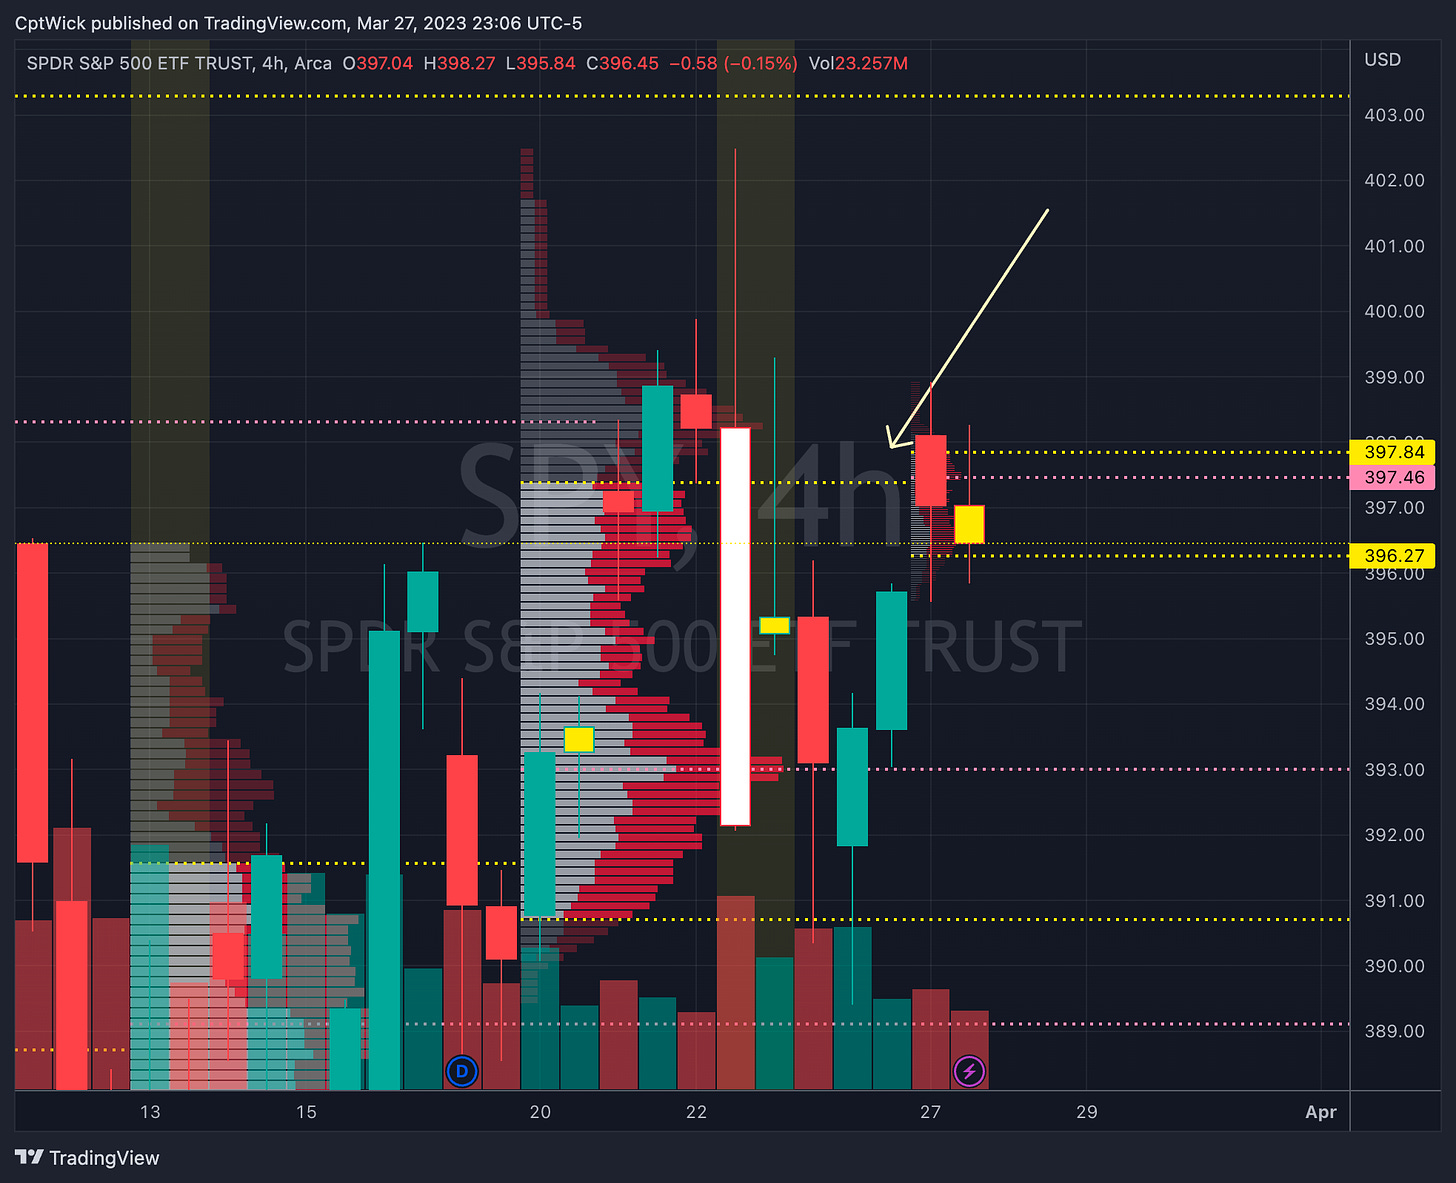
As anticipated in our weekly plan, the market seems to be in a balancing phase in the range of 397-394. Today's session saw a high of 398.92, which aligns with our observation of negative vanna in the 399-400 level, indicating a strong resistance zone. On the other hand, the session low of 395.56 also corresponds to an area of negative vanna and positive gamma, which could provide support to the market.
—3/28 Pre Plan—
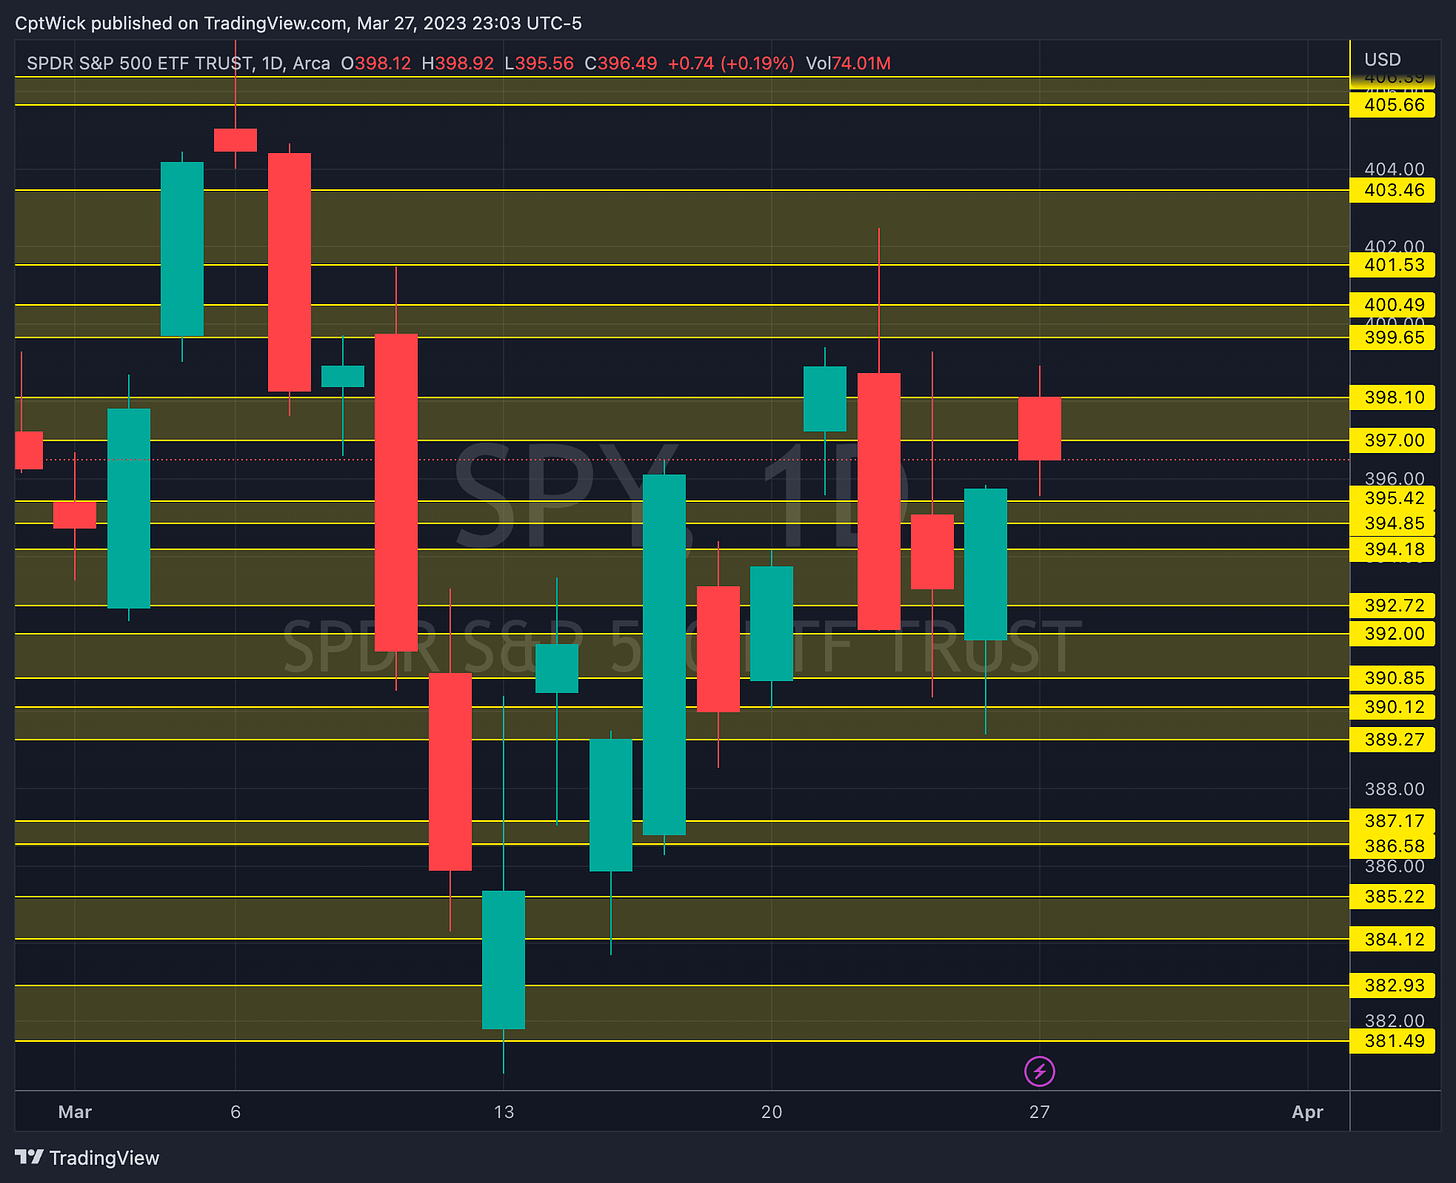
My major supply and demand zones are going to stay in tact going into tomorrow. The Volland data for SPY is showing a very similar story as the plan from last night, but I want to include some data for just the rest of the week.
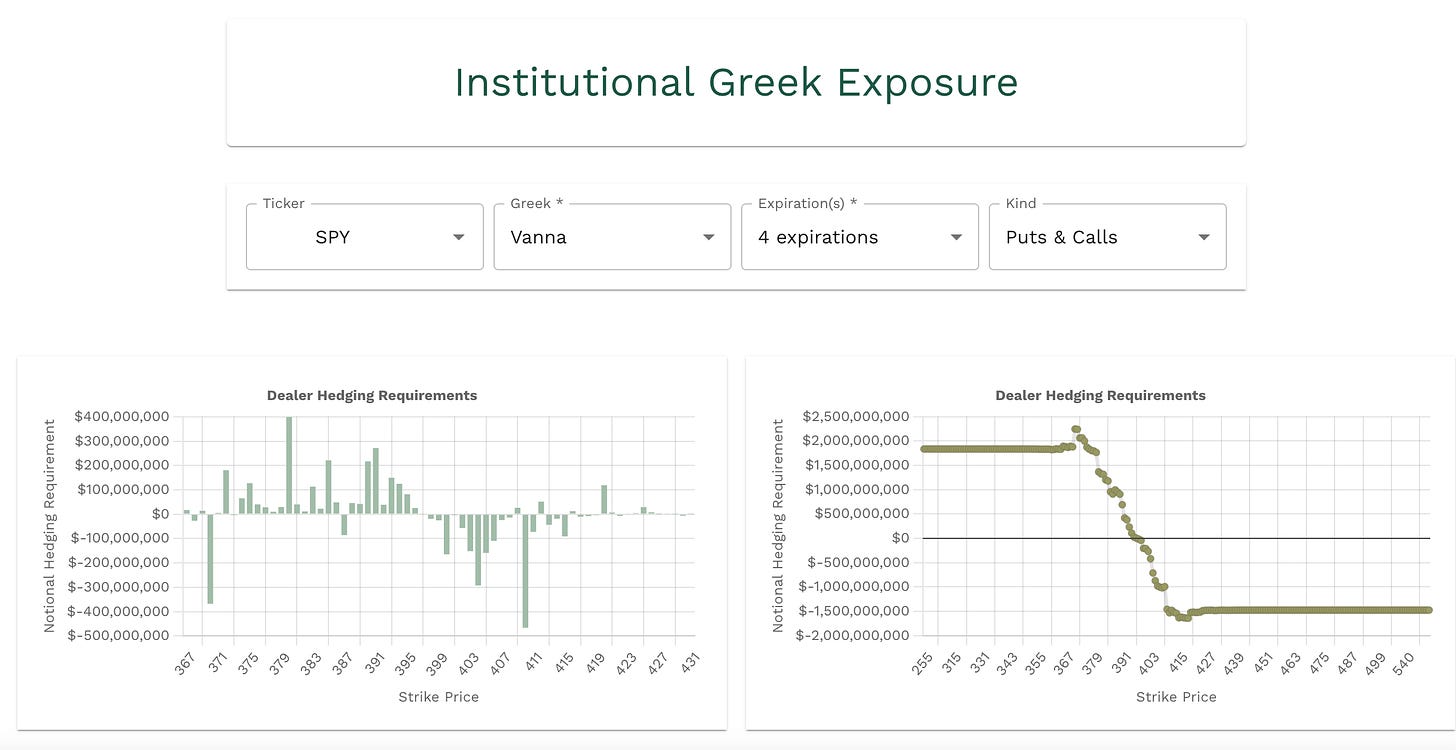
We can see that the vanna is negative above us and we have a strong cluster of positive vanna below us, this is basically telling me that in order for spot price to increase, we are going to need IV to go down. At current IV levels the negative vanna should push price down towards the positive vanna below.
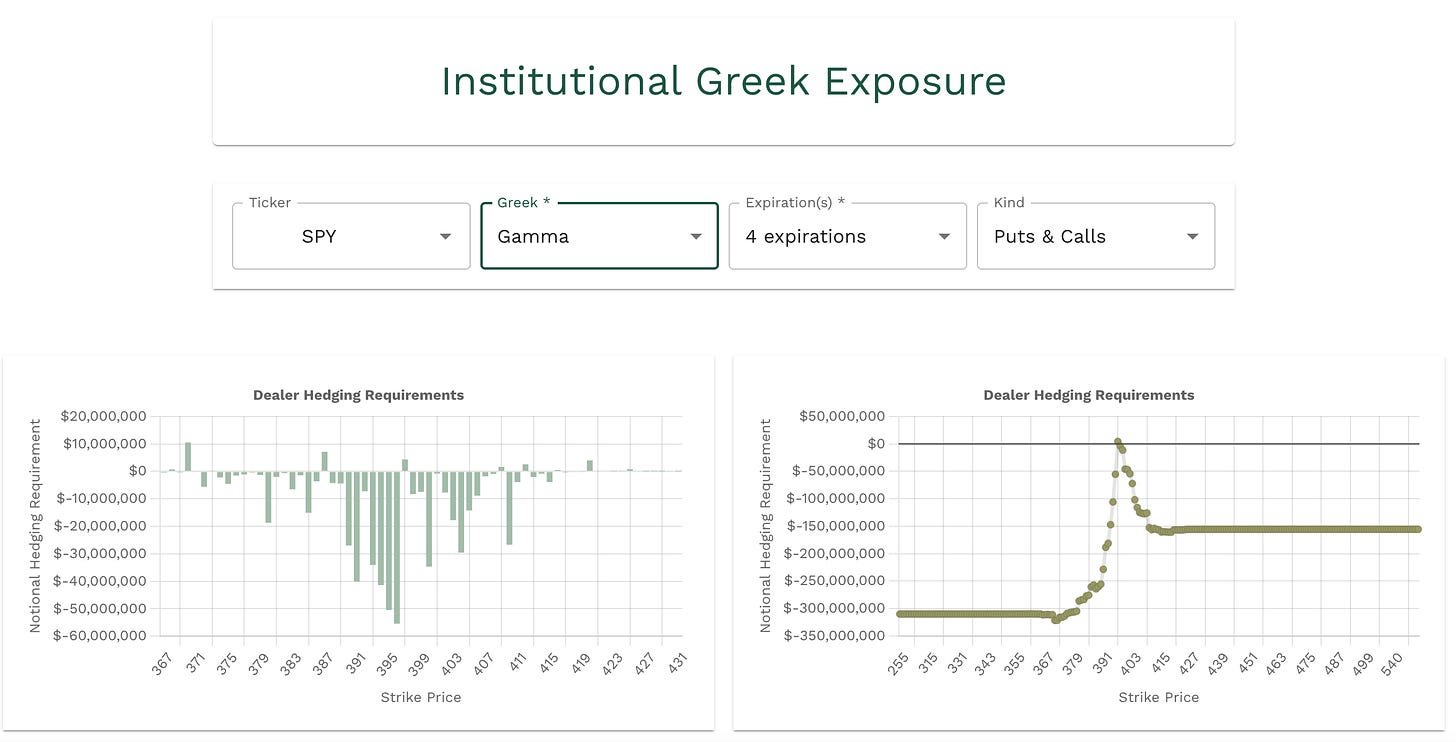
Gamma looks like we want to pin somewhere between the positive value at 397, and the positive value at 387. So it would be safe to say that under 397, I want to target 387.
We also rejected last weeks VAH, if we can stay under I think we can test 393-390.
—3/28 Trade Plan—
Bullish Scenario
Above 397 target 398.10, 399.65-400.50
This area is also negative vanna, but we do have positive vanna and gamma at 401, so its possible that this area could as has stronger resistance.
Above 400.50 target 401.50, 403.50, 405.66, 406.40, 407.50
We have negative vanna from 402-405 and positive at 401 and 406 along with positive gamma.
404.90 is the MMs weekly upside expectations.
I would expect selling pressure at these levels based on current IV levels.
But this does not mean we can not push higher.
Bearish Scenario
Below 397 target 395.50, 394.85, 394
The negative vanna at 395-394 turned positive, and the next positive gamma/negative vanna area is 389-388.
We also have a key POC at 389.11 and we have positive gamma/negative vanna at 388, this area could be supported.
I see that in the weekly plan I have this level marked as 398.11. Make a note that it was a typo it should be 389.11
Under 389.25 target 387.20-386.50, 385.25, 384.15, 383-380
386.60 is the MMs weekly downside expectations
The short term vanna is positive from 396 ti 388, so that aligns with our theory that if we stay under 397, we head to the levels.
386 is positive gamma/negative vanna (support)
383 is positive gamma/negative vanna (support)
378 is a big negative vanna/positive gamma level if this were to trade I would expect some type of bullish reaction at this level.
Happy Trading,
—WICK—
To cover our basis…
Welcome to my Substack where I provide a daily SPY trading plan to help guide my intraday trading. The purpose of this letter is not to advice you on your trading or investment decisions. I am simply documenting my daily trading plan for myself to help with planning and execution. These are simply my opinions and the data sourced from the likes of vol.land, TradingView, Quantdata.us and others. The stock market is risky, gains are not guaranteed. This is not about getting rich quick, but learn to educate yourself and make the necessary financial decisions on your own. This is not financial advice.


