Readers,
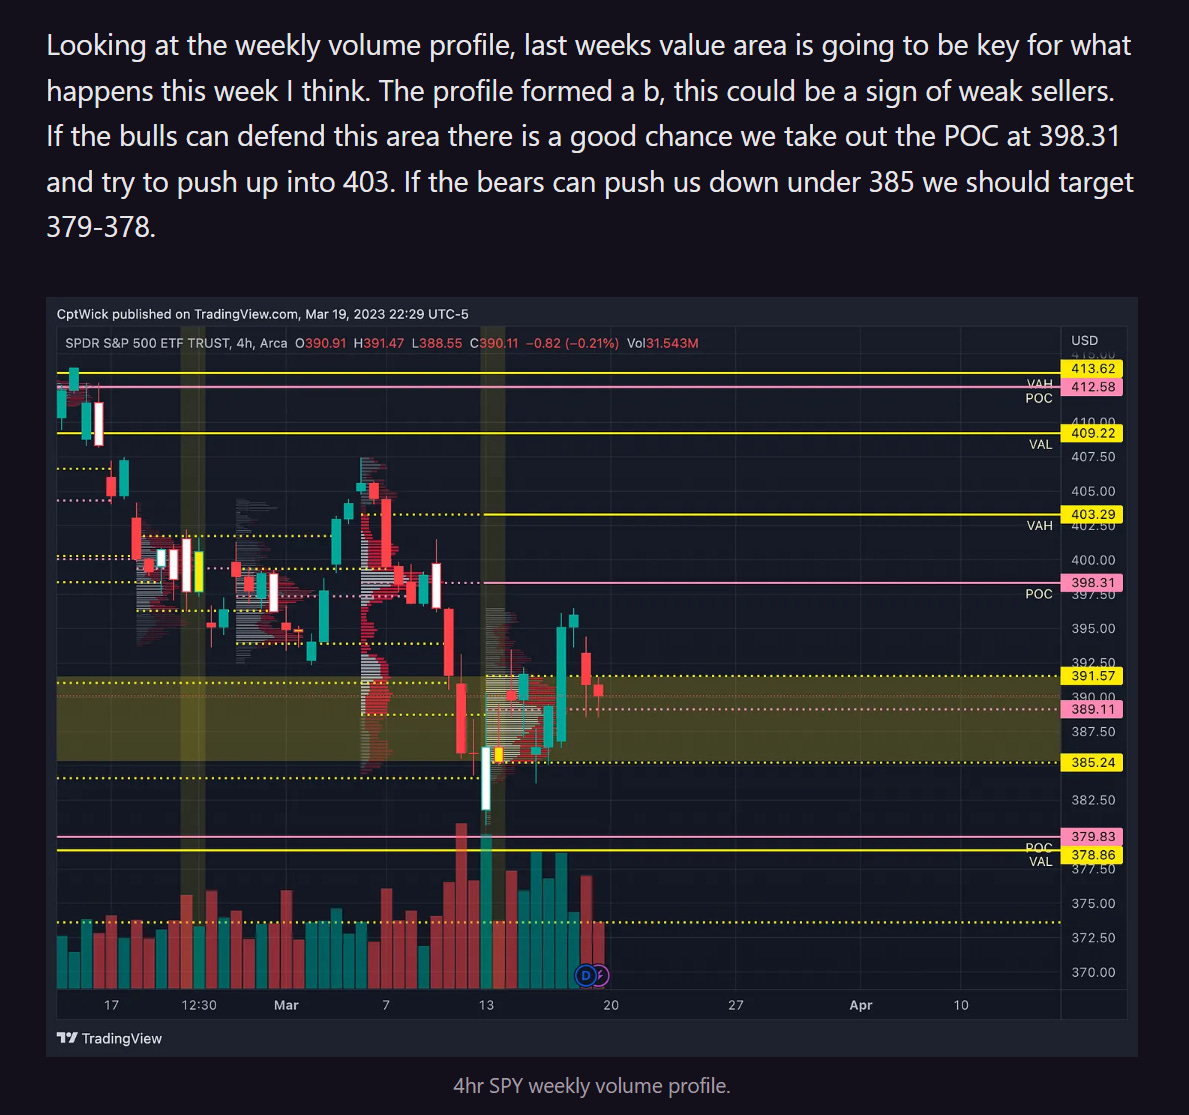
Let’s start with a little recap. Last week we said that the main area of focus was-
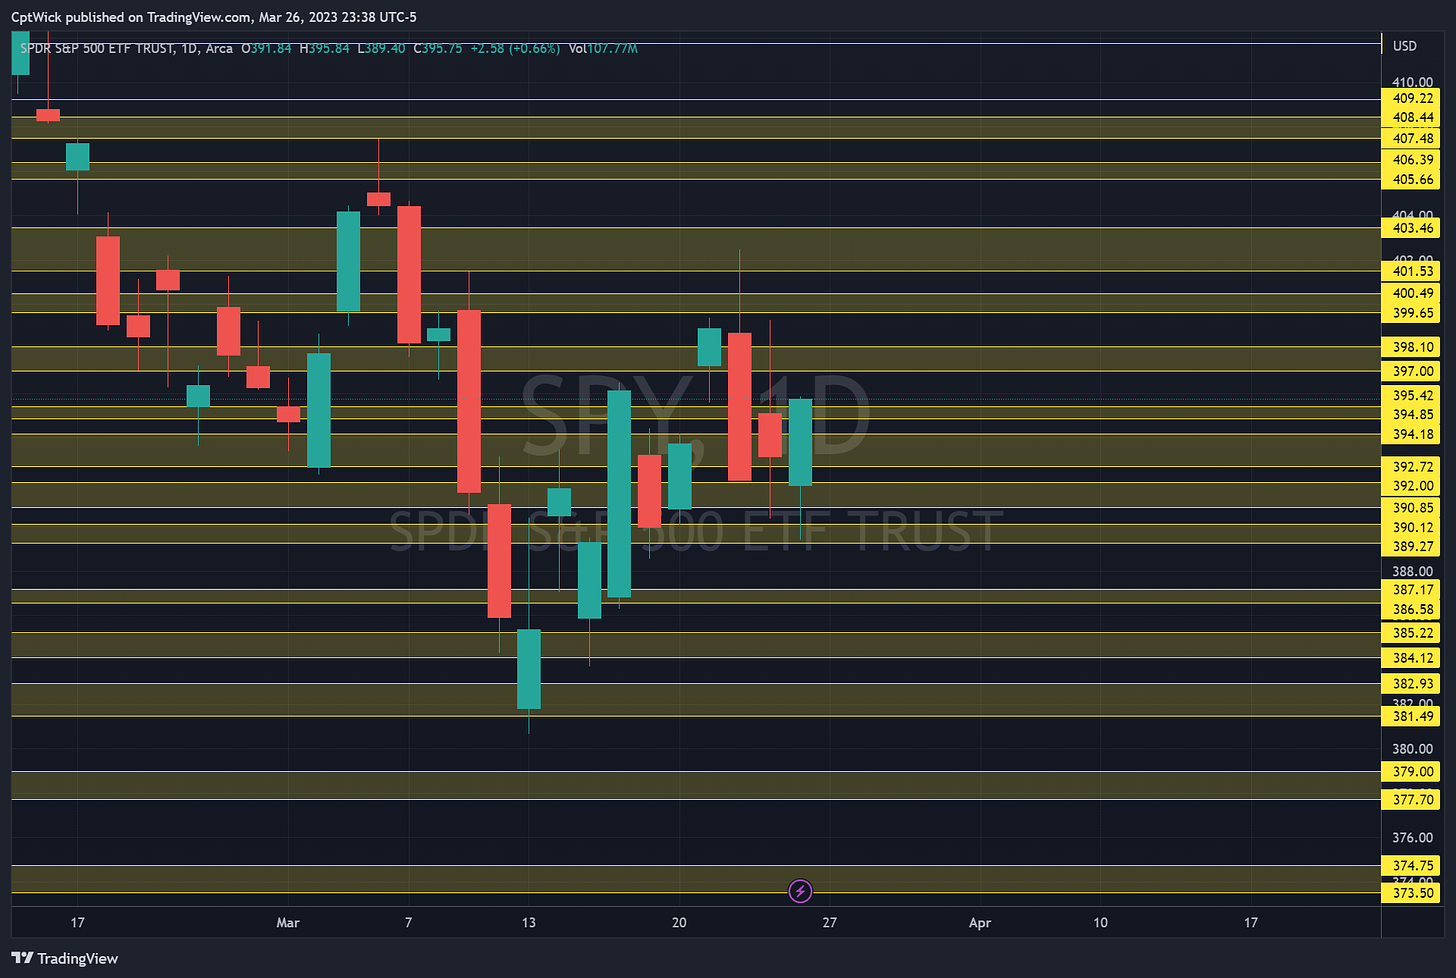
Now fast-forwarding to this week we can see that they defended this area and we pushed up away from it. The POC at 389.11 is still naked so we will keep that as a key level.
The weekly high was 402.49 and one of our upside targets was 402.02 because it was the MMs upper expected move, and we came back down and retested the 390 level.
—Weekly Pre-Plan—
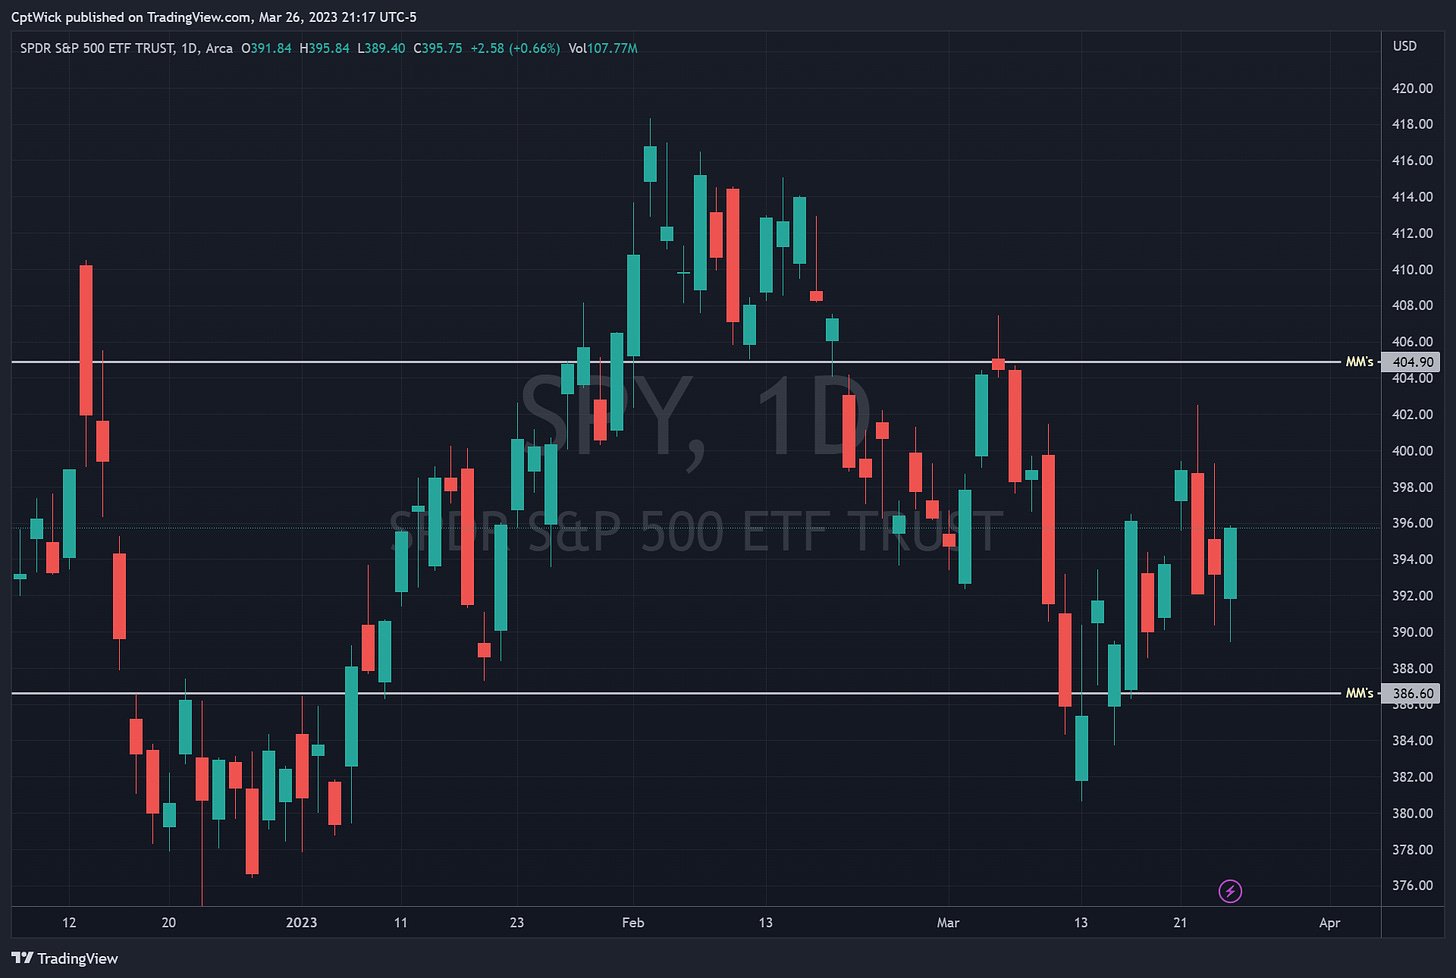
This week the MMs are predicting a move of $9.15. This gives us a lower target of 386.60 or a upper target of 404.90.
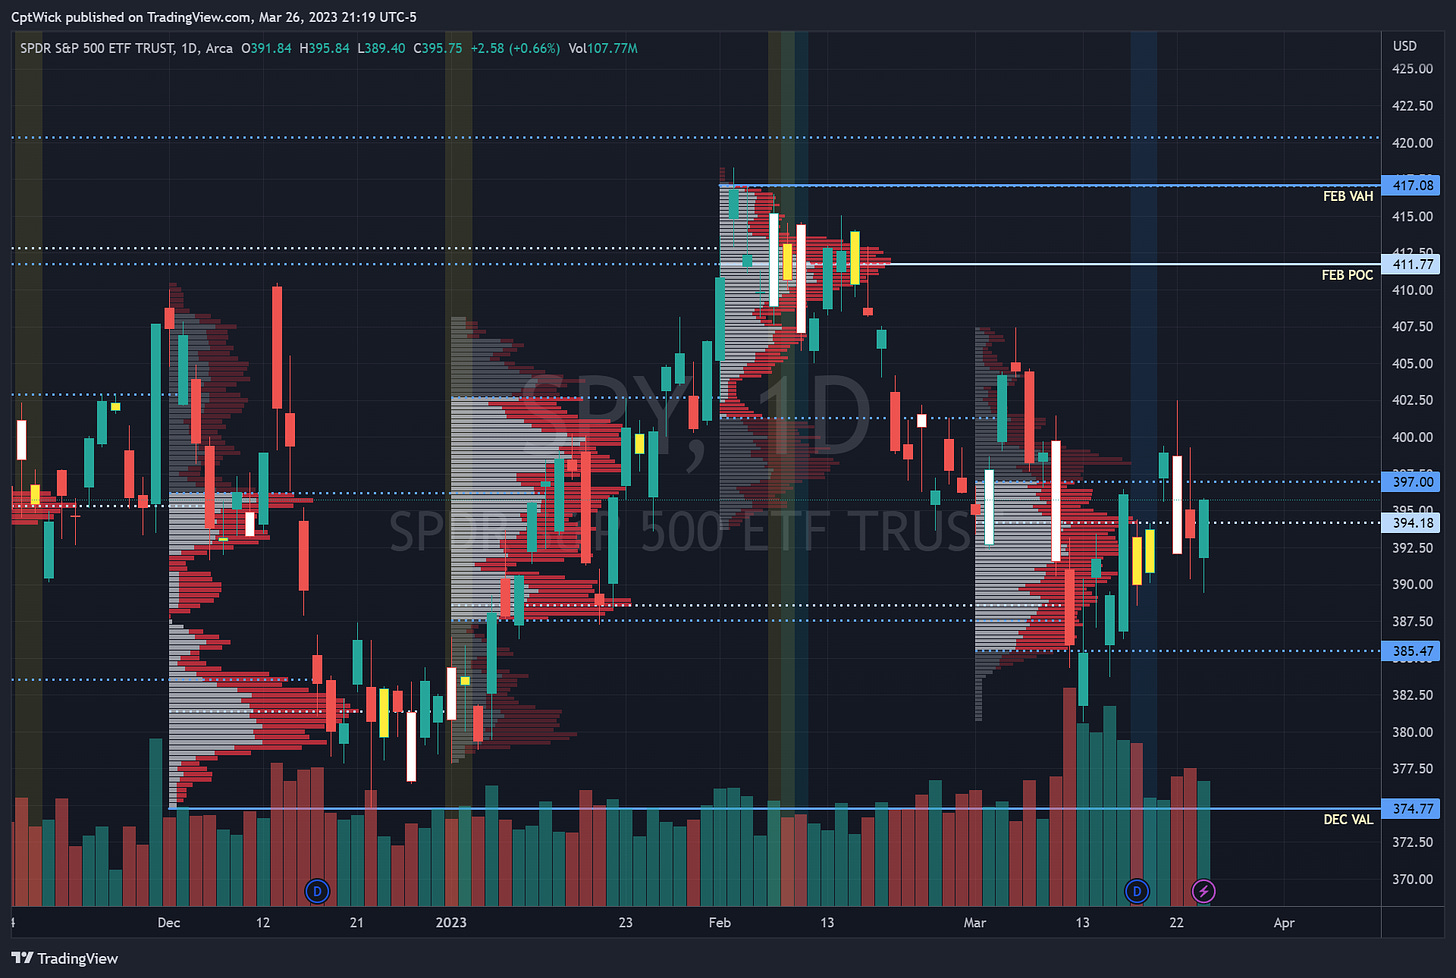
As a reminder, the monthly trading profile will come to a close this Friday. Currently, our trading range shows a value area high (VAH) of 397, a point of control (POC) of 394.18, and a value area low (VAL) of 385.47. If we anticipate further upward momentum, we need to see a move above the 397 level. It's worth noting that we've been holding January's POC, which prompts the question of whether we'll revert to February's levels or test December's. Keep a watchful eye on these levels as we approach the end of the trading week.
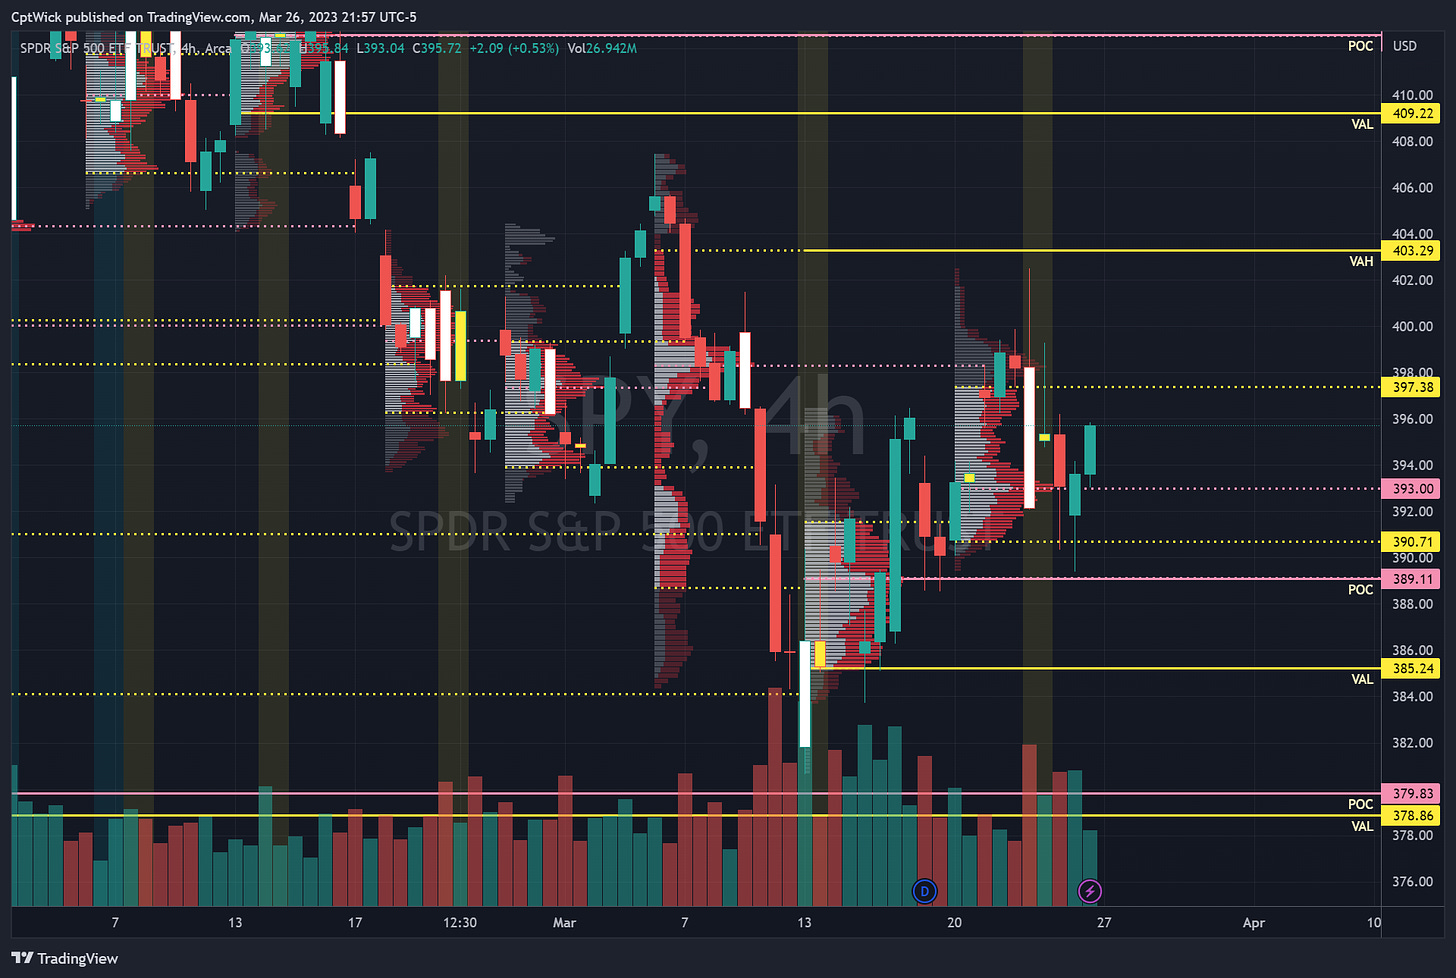
Upon examining the weekly trading profile, it's evident that we ended the week within the value area, indicating a balanced market. The current value area shows a VAH of 397.38, a POC of 393, and a VAL of 390.71. To potentially see further bullish movement, we need to see a push above the VAH, which could lead to a test of the untested VAH of the larger value area we're currently in at 403.29. Keep an eye on how the market responds in the coming days to gauge the strength of the bullish momentum.
On the bearish side, it's worth monitoring whether we can maintain movement below the 390-385 level. If this downward trend continues, we may need to consider testing the support levels at 380-378.
It's possible that we may witness further balance between the levels of 397 and 394 in the early part of this week, as indicated by the concentration of volume in this range.
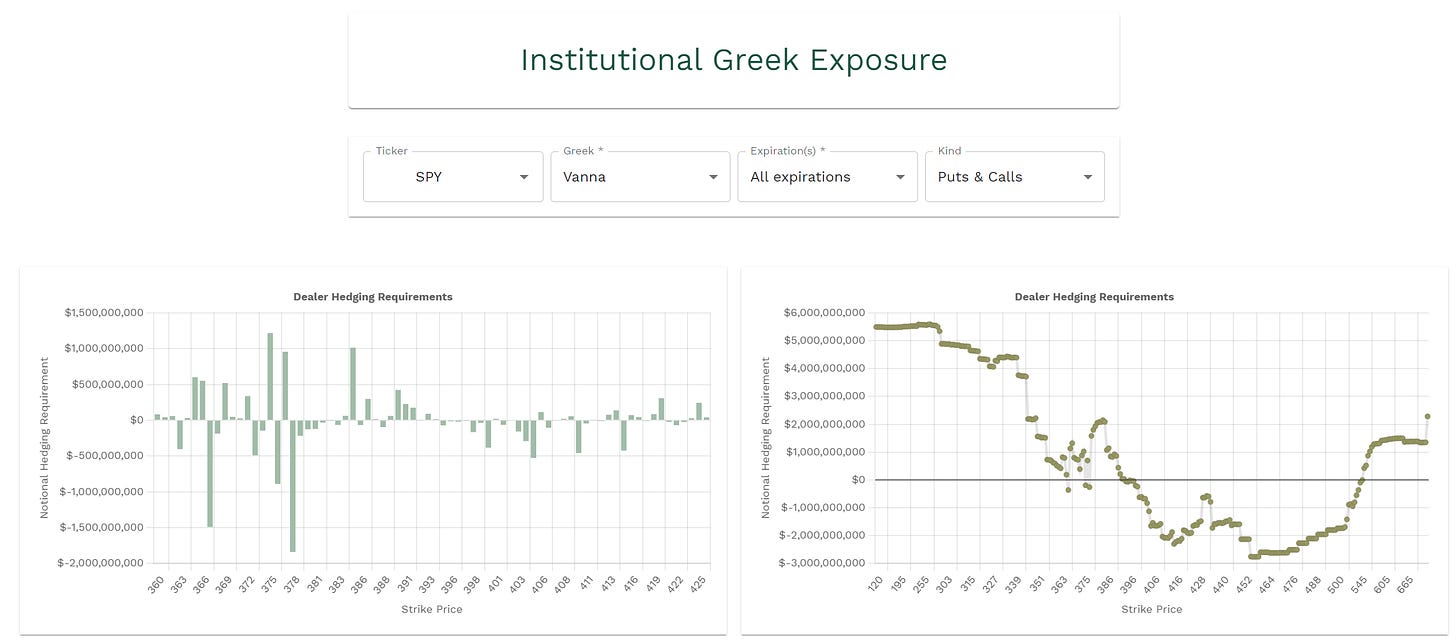
Some notable vanna levels that I am watching this week will be:
Positive
377, 385, 387, 390, 393, 401, 406
Negative
378, 383, 386, 388, 395, 398, 400, 402, 405, 407
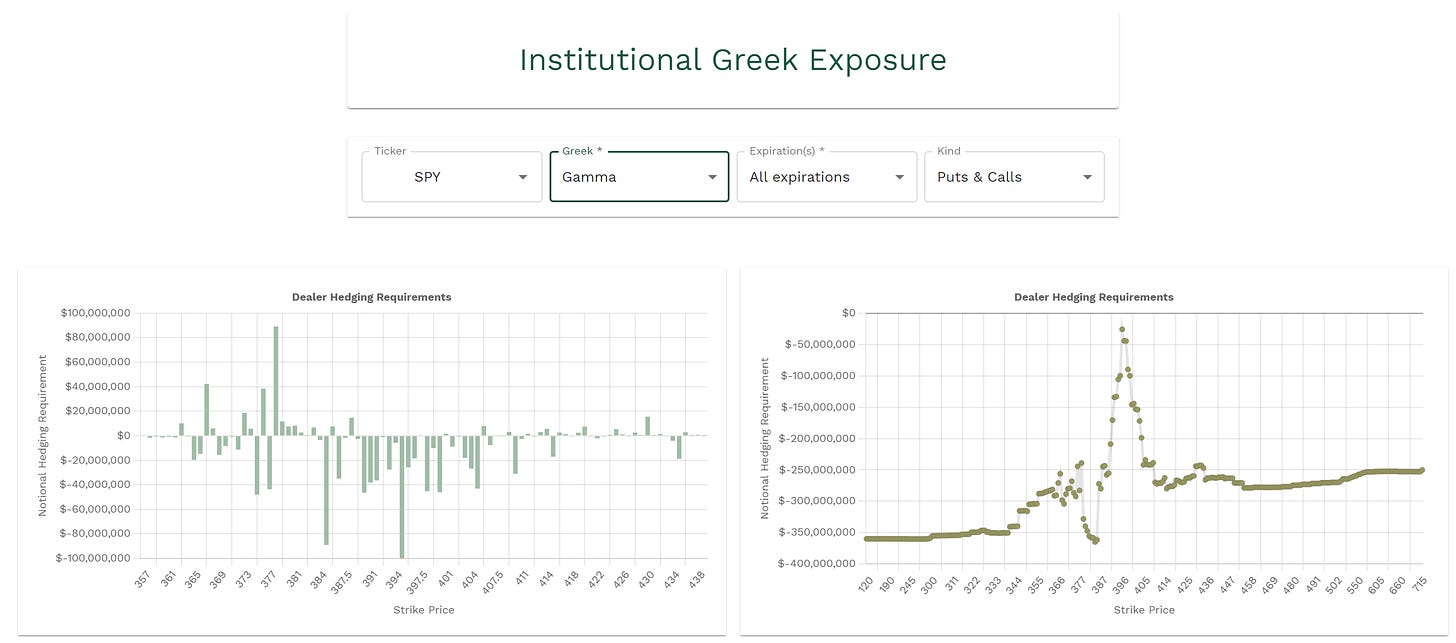
Gamma levels:
Positive
376, 378, 380, 383, 386, 388, 401, 406, 409
—Weekly Trade Plan—
Bullish Scenario
Above 395 target 397
As mentioned earlier, it seems that the market is currently in a phase of balancing within a certain price zone. In order for the bulls to gain an advantage, they need to break through the resistance level at 397. However, it's equally important for them to maintain this level once they do.
395 is also negative vanna act as support, 398 is also negative vanna so this could be resistance
397-398.10 is also one of our key zones.
Above 398.10 target 399.65-400.50
This area is also negative vanna, but we do have positive vanna and gamma at 401, so its possible that this area could as has stronger resistance.
Above 400.50 target 401.50, 403.50, 405.66, 406.40, 407.50
We have negative vanna from 402-405 and positive at 401 and 406 along with positive gamma.
404.90 is the MMs weekly upside expectations.
I would expect selling pressure at these levels based on current IV levels.
But this does not mean we can not push higher.
Bearish Scenario
Below 394 target 392.70, 392, 390.85, 389.25
The negative vanna at 395 along with the positive vanna from 394-389 could cause a move down to the 389-388 area
We also have a key POC at 398.11 and we have positive gamma/negative vanna at 388, this area could be supported.
Under 389.25 target 387.20-386.50, 385.25, 384.15, 383-380
386.60 is the MMs weekly downside expectations
386 is positive gamma/negative vanna (support)
383 is positive gamma/negative vanna (support)
378 is a big negative vanna/positive gamma level if this were to trade I would expect some type of bullish reaction at this level.
Happy Trading,
—WICK—
To cover our basis…
Welcome to my Substack where I provide a daily SPY trading plan to help guide my intraday trading. The purpose of this letter is not to advice you on your trading or investment decisions. I am simply documenting my daily trading plan for myself to help with planning and execution. These are simply my opinions and the data sourced from the likes of vol.land, TradingView, Quantdata.us and others. The stock market is risky, gains are not guaranteed. This is not about getting rich quick, but learn to educate yourself and make the necessary financial decisions on your own. This is not financial advice.


