Readers,
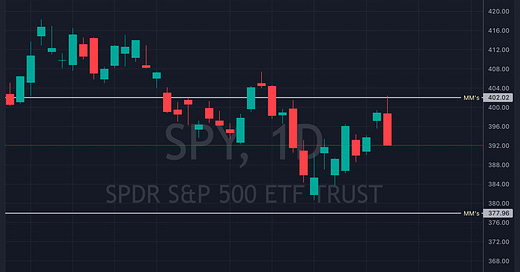
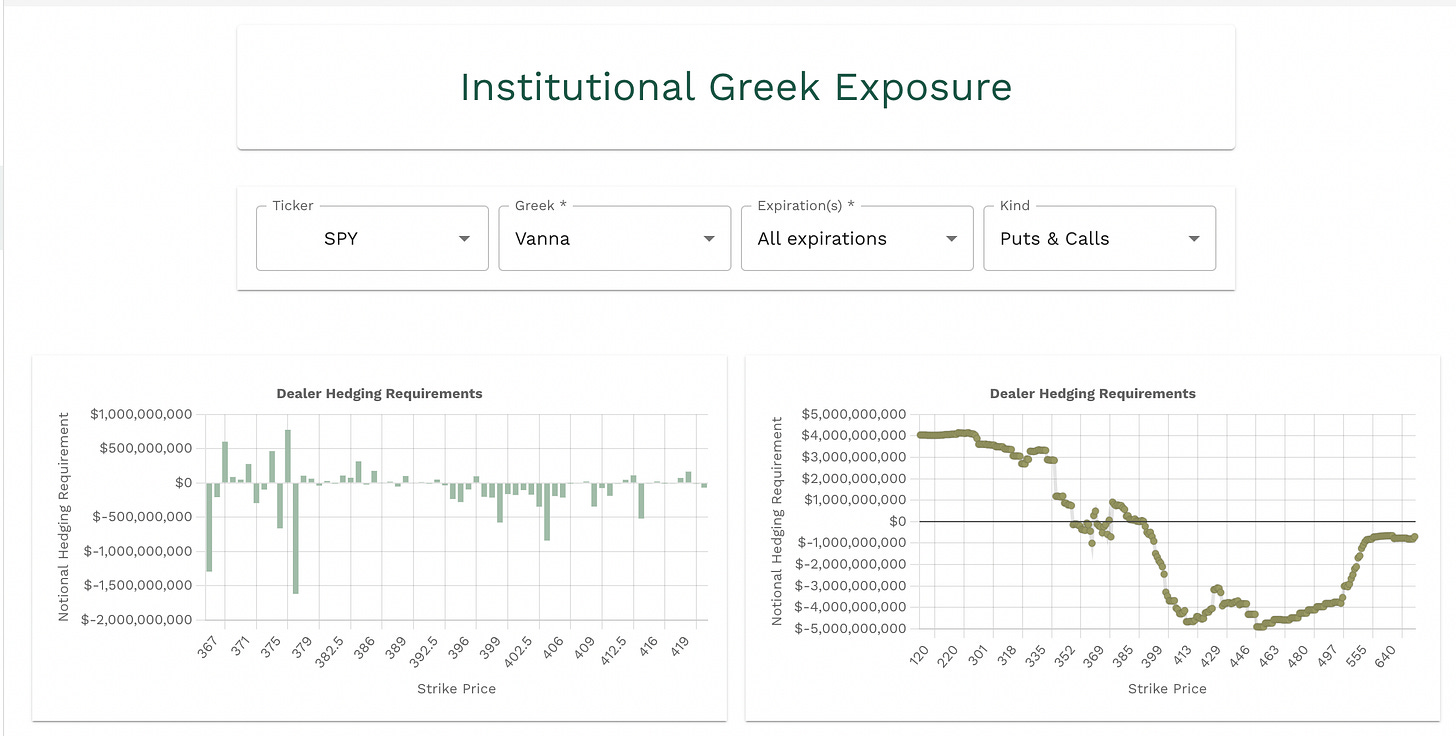
Let’s recap a few things that we have been watching this week. If you have been following along you know that we like to keep track of the weekly market makers expected move. We also knew that this area would be hard resistance based on vanna. Dide FOMC help this? Yes, but lets recap a few more items.
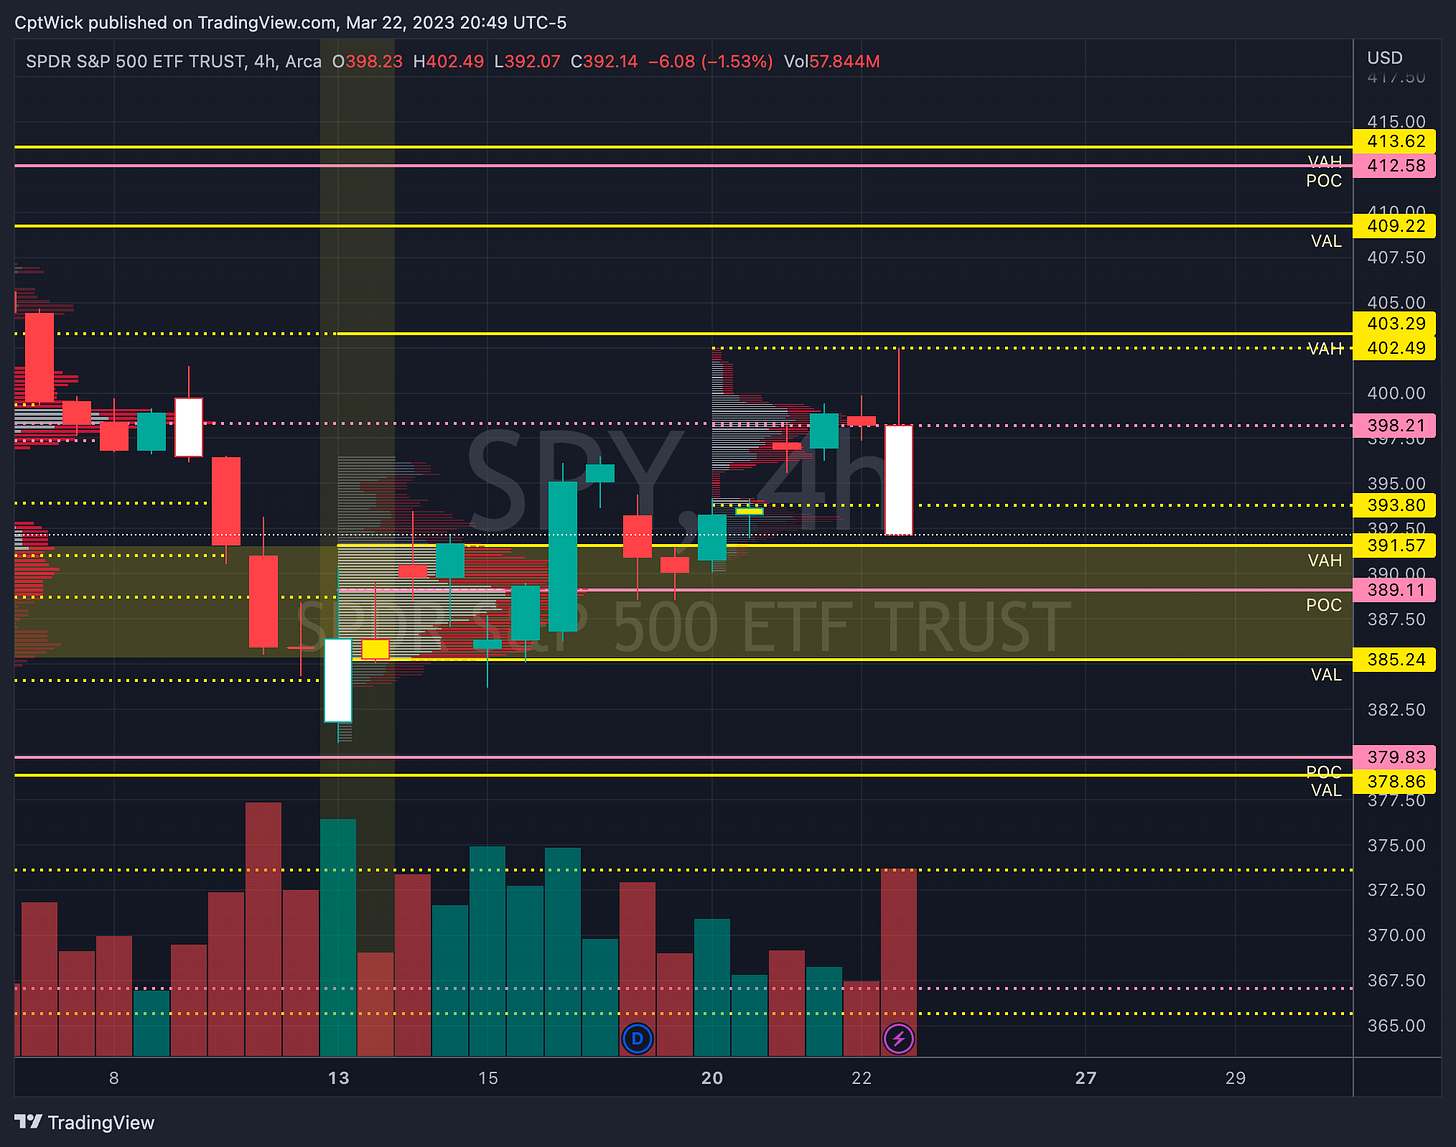
We also said on Sunday that we are paying attention to last weeks value area (391.57 to 385.24). On Monday, we pushed up out of the zone and reached the MMs expected move, we also had FOMC and we got a decent sized selloff. We are now approaching this area again. It is going to be critical for the bulls to defend this or we might see 377.96, the MMs downside expectations.
—3/23 Pre-Plan—
We need to keep our eye on the chart above, I think that ultimately under 390 it could get ugly. Last weeks value area needs to be defended by the bulls if they want to take this higher.
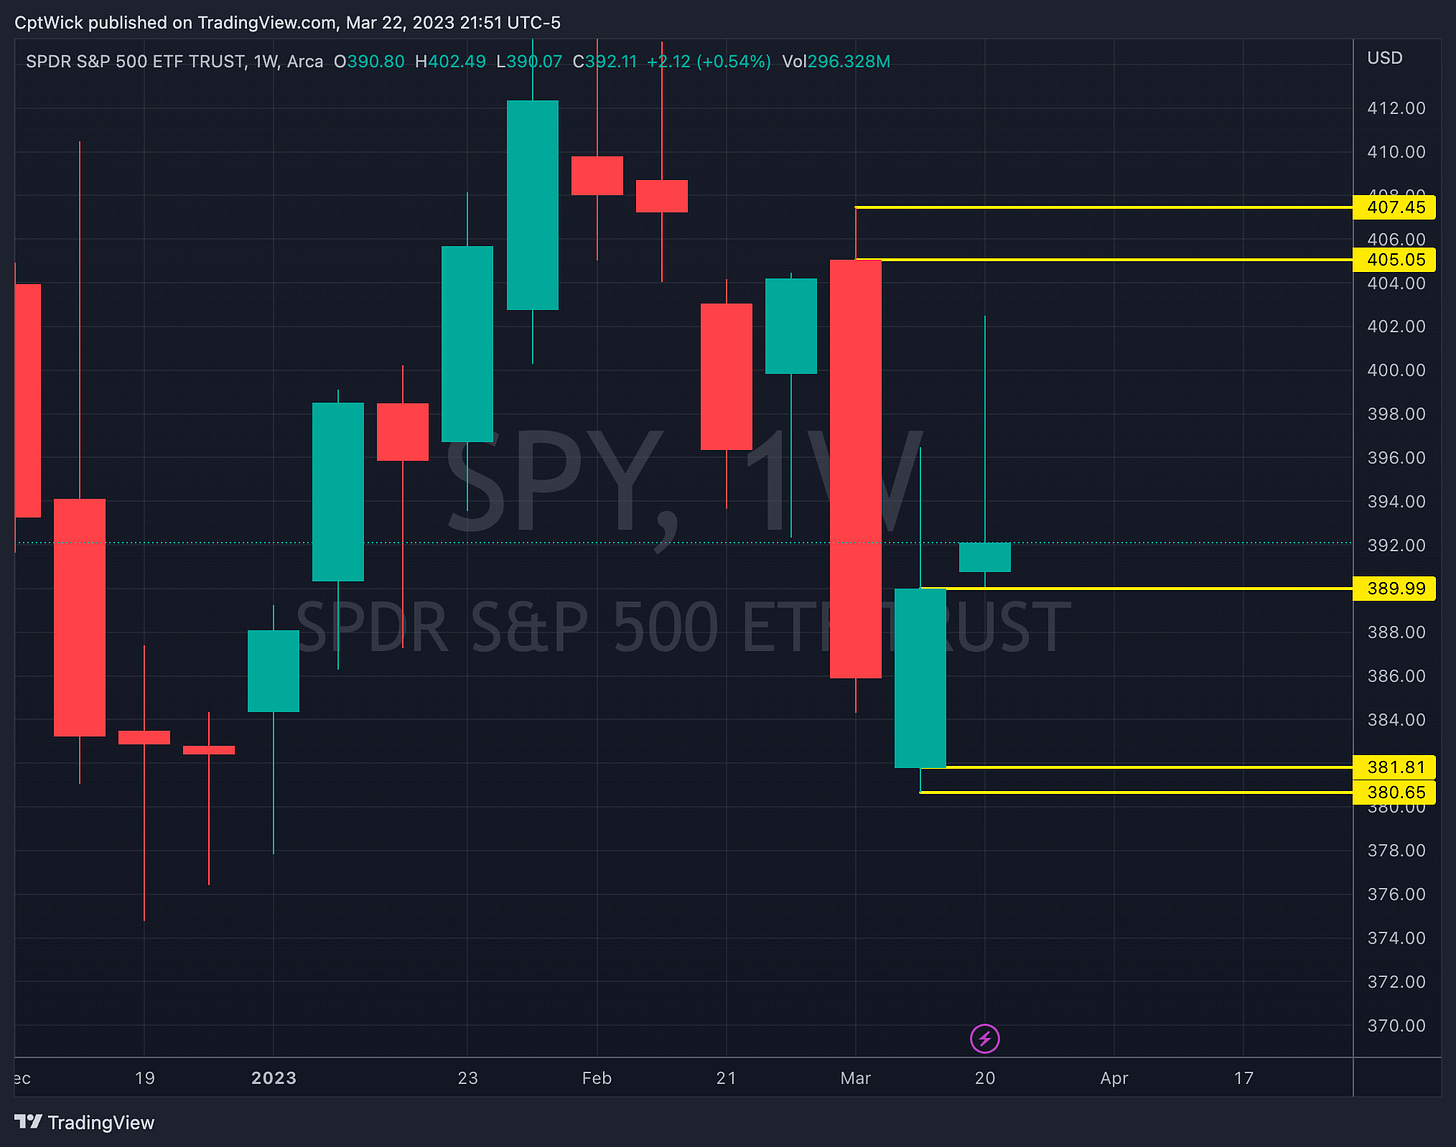
Take a look at this weekly chart. If this candle were to flip red, I think that we could chase last weeks low 380.65. If the bulls can hold this we might try for 405-407.
Notable Vanna levels
Positive
397.50, 393, 390, 387, 385, 380, 377, 375
Negative
407-398 (405, 400, 396, 395), 389, 381, 378, 376
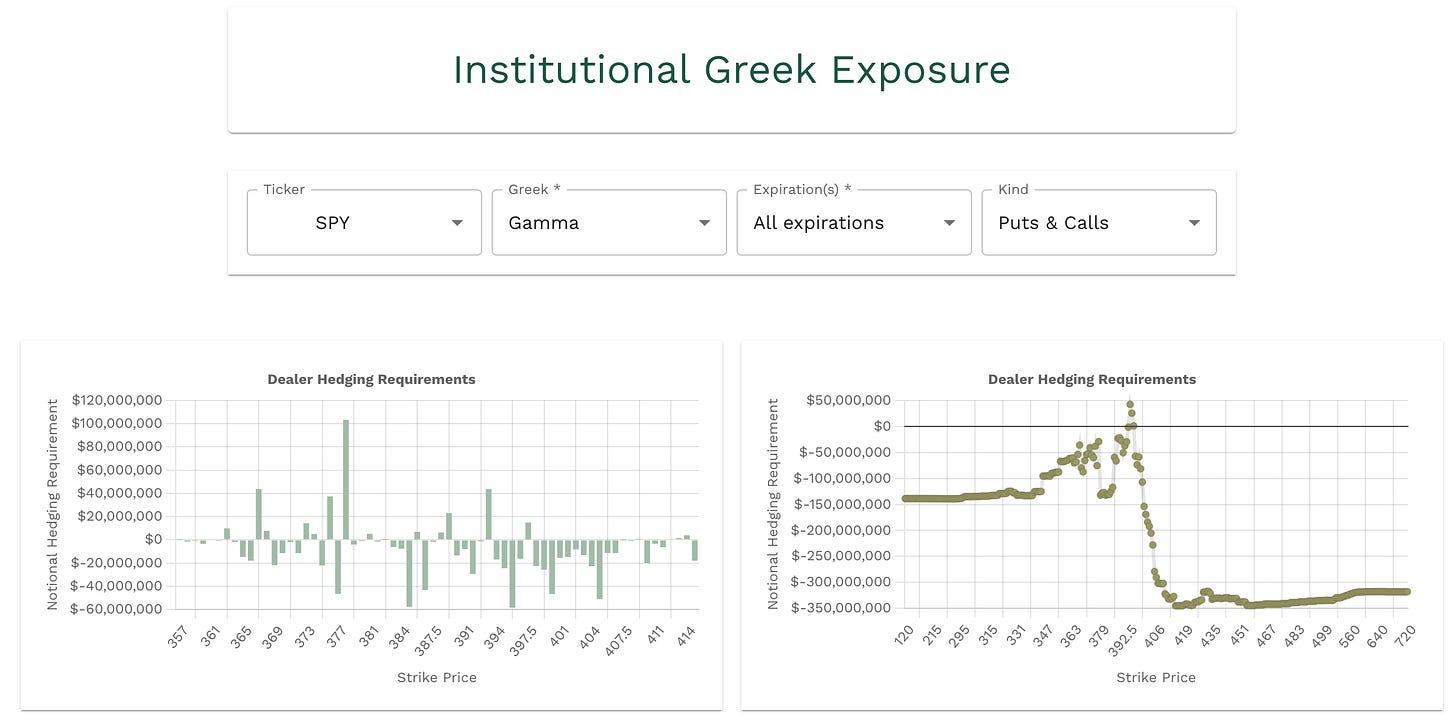
Notable gamma levels
Postive
397.50, 393, 389, 388, 386, 381, 378, 376
—3/23 Trade Plan —
Bullish Scenario
Above 393 target 397.50
393 and 397.50 are positive gamma
395-397 is negative vanna
some levels to watch 394, 394.65, 396.50, 398.20
Above 398.20 target 399.65, 400, 400.50, 401.53, 402, 403.46, 405.66, 406.40, 407.58
Vanna is negative 398 to 407 so if we are going to punch through these levels we are going to need to see VIX down a lot.
Bearish Scenario
Below 393 target 389
390 is positive vanna but 389 is negative vanna and positive gamma, this could be a tough level to crack
Earlier we mentioned the weekly timeframe candle, under 389.99 it will flip red, if this happens we can chase last weeks low 380.65.
389.11 is also last weeks POC for the key value area we are watching. With all of this info we know 389 is a big level and it opens the door for further downside.
Below 389 target 388.62-387.85 then 385.24
388 is positive gamma and 387 is negative vanna (strong support)
386 is also positive gamma
385 positive vanna, could act as a magnet.
Under 385.24 we lose last weeks value area and it could get ugly.
Under 385 target 380.50, 379.80, 378.68, 277.96
384,383,382 is positive vanna
381 is positive gamma/negative vanna (support)
378 is big negative vanna/positive gamma, if this level or around this level were to trade I think this is were a stronger bounce could happen. 376 is also like this.
Happy Trading,
—WICK—
To cover our basis…
Welcome to my Substack where I provide a daily SPY trading plan to help guide my intraday trading. The purpose of this letter is not to advice you on your trading or investment decisions. I am simply documenting my daily trading plan for myself to help with planning and execution. These are simply my opinions and the data sourced from the likes of vol.land, TradingView, Quantdata.us and others. The stock market is risky, gains are not guaranteed. This is not about getting rich quick, but learn to educate yourself and make the necessary financial decisions on your own. This is not financial advice.

