Readers,
Lets Recap!
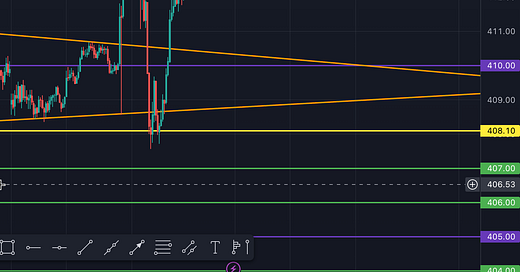
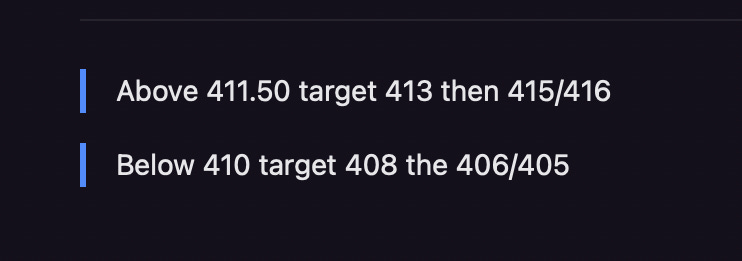
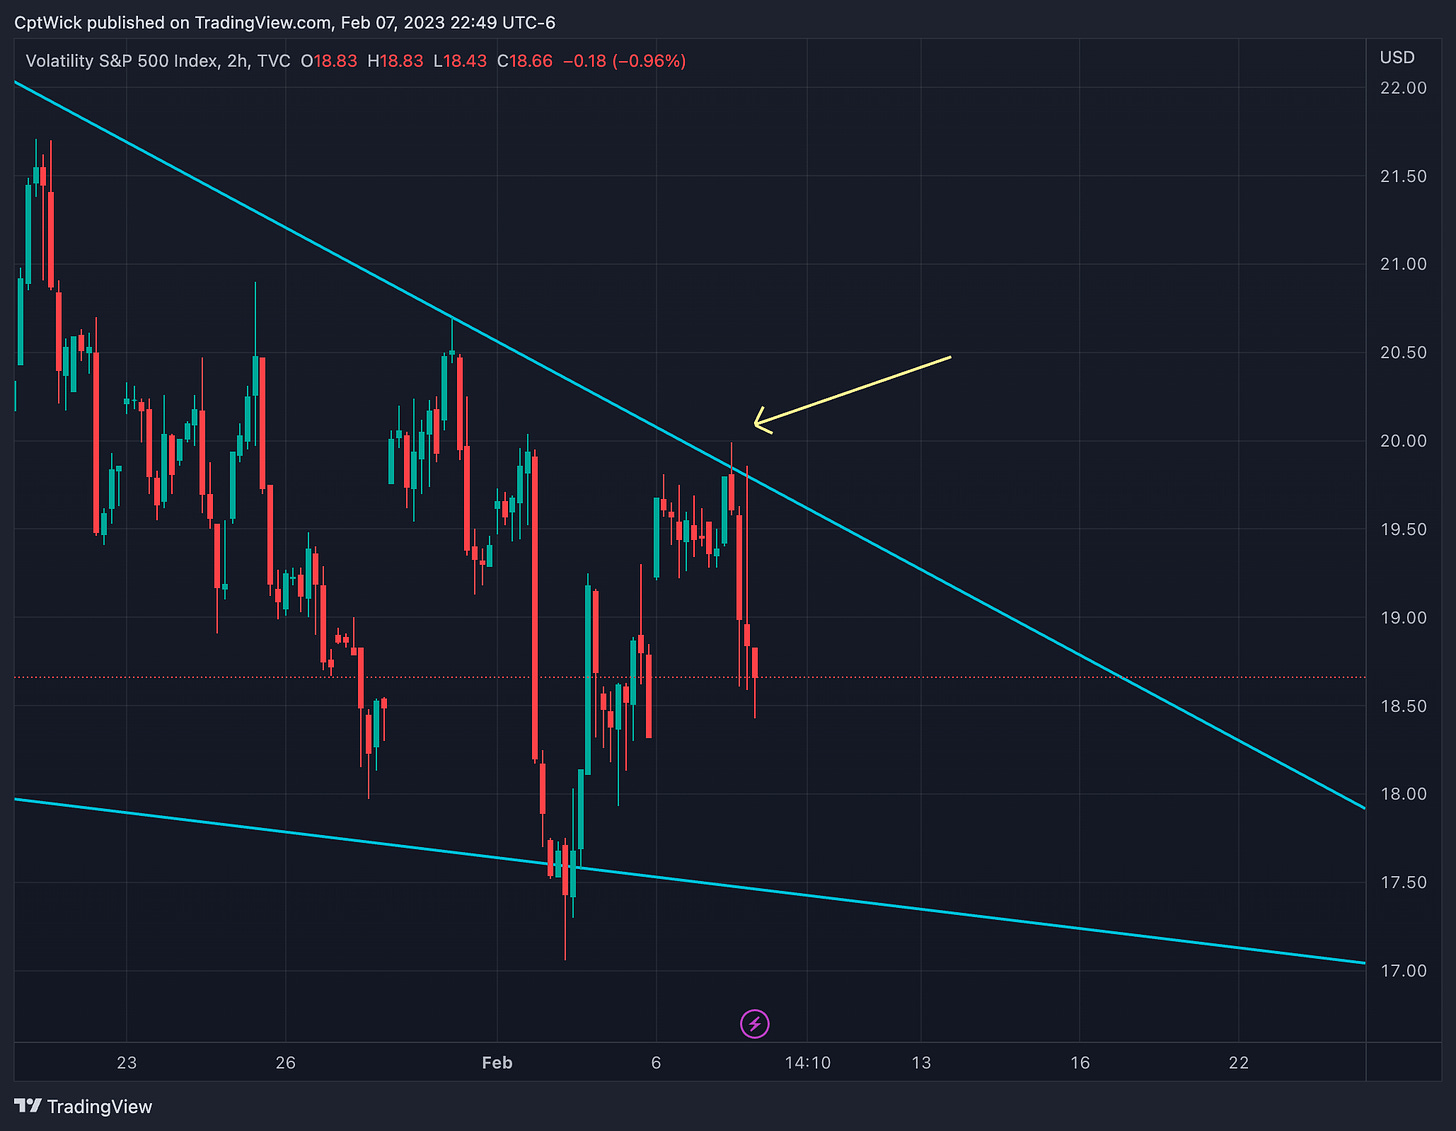
Yesterday's plan proved to be a resounding success! Our levels were precisely calibrated and our execution was flawless. We profited from both calls and puts, showcasing the efficacy of our approach. Key elements of the plan that contributed to our success include opening near 409 and anticipating choppy movements due to Powell's speech. At 11:45 AM CST, when the market popped from 408.50 to 415, I refrained from entering call positions, instead opting to wait for one of my upper levels to be reached for a put entry. This decision paid off as we exceeded 411.50 and 413, leading me to initiate a put position at 415 with a target of 413. I held on until 12:45 PM CST, when we formed a double bottom precisely on the longer-term trend we originally broke out from, and ended up pinned between two positive vanna levels due to the failed breakout and trending lower of VIX. These types of days emphasize the importance of having a well-crafted plan, with clear targets and an understanding of why price is moving to certain levels.
—2/8 Pre-Trade Plan—
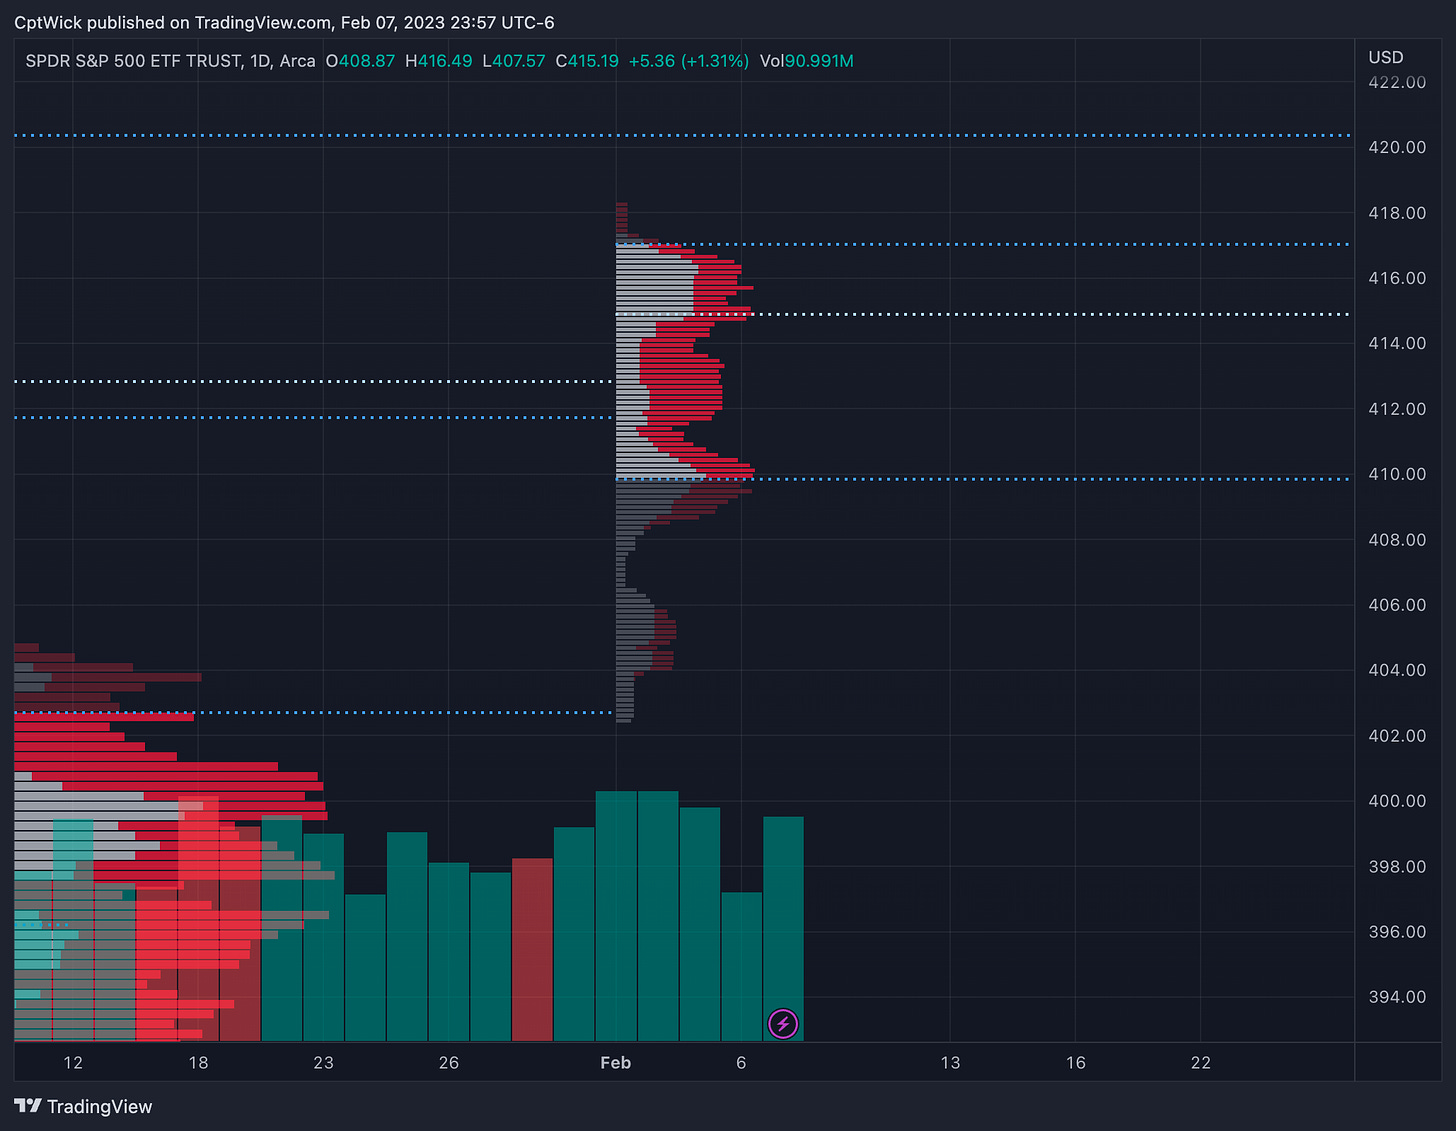
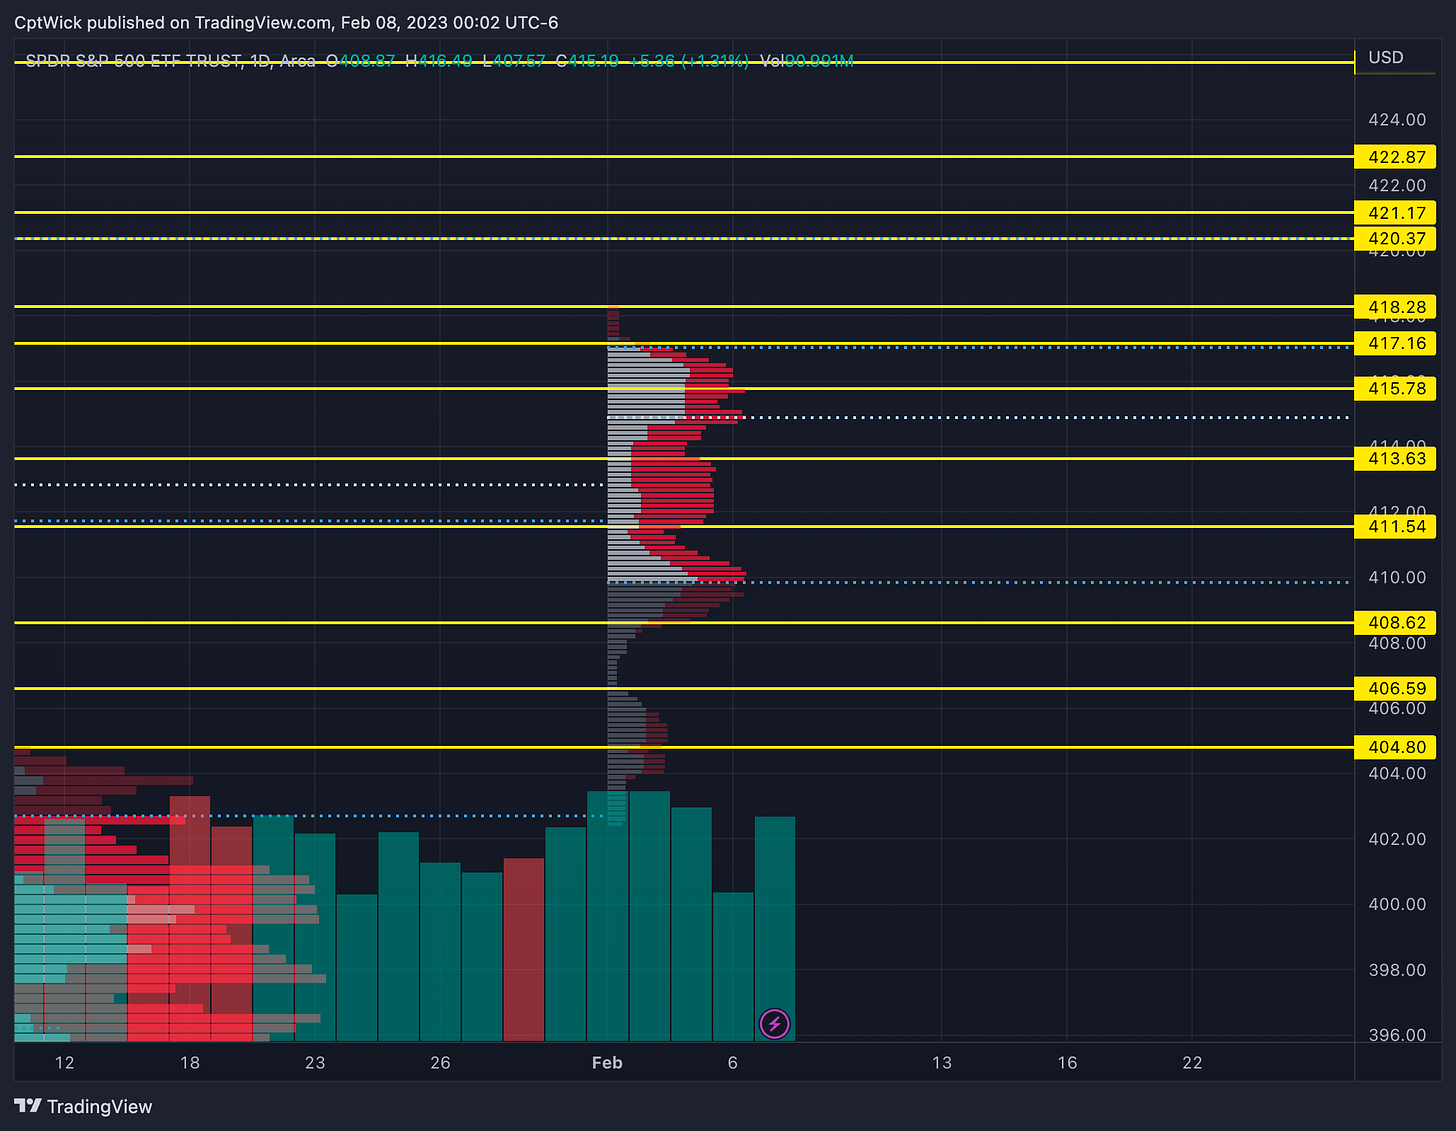
First thing I normally do is review the volume profile. This profile is on the 1D view and it represents all the volume traded for the current month. As you can see we are forming a P shape profile, buyers seem to be in control but don’t rule out the low volume under 408.50.
I like to then note the key areas and for me its the LVN’s.
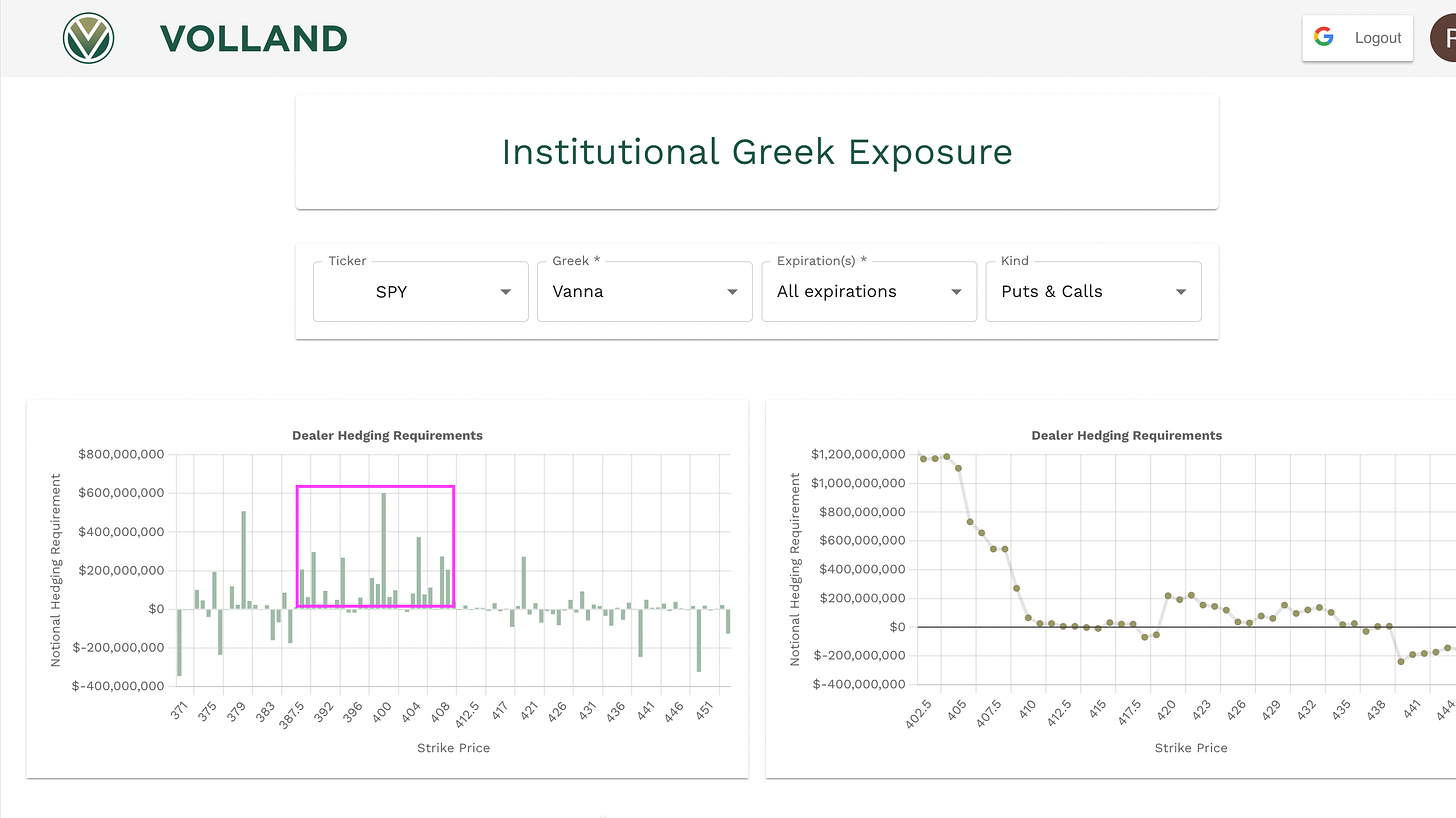
I use these in conjunction with the data from Volland. So now that I have that done I jump into the data. I first check the Aggregate Vanna and note any changes there.
As you can see nothing has really changed we still have the bigger cluster of positive vanna below spot so again, IV playing the big role on getting down to those levels.
Another thing we should note here as we could potentially see our major supply zone that we noted in the WEEKLY PLAN, we have that positive vanna level at 420 with the negative vanna below at 418 and above at 421, 423, with 422 being positive. This is why I have been keeping 418 as a key level here because above that I think we see that supply zone around that 420-421 (both positive vanna).
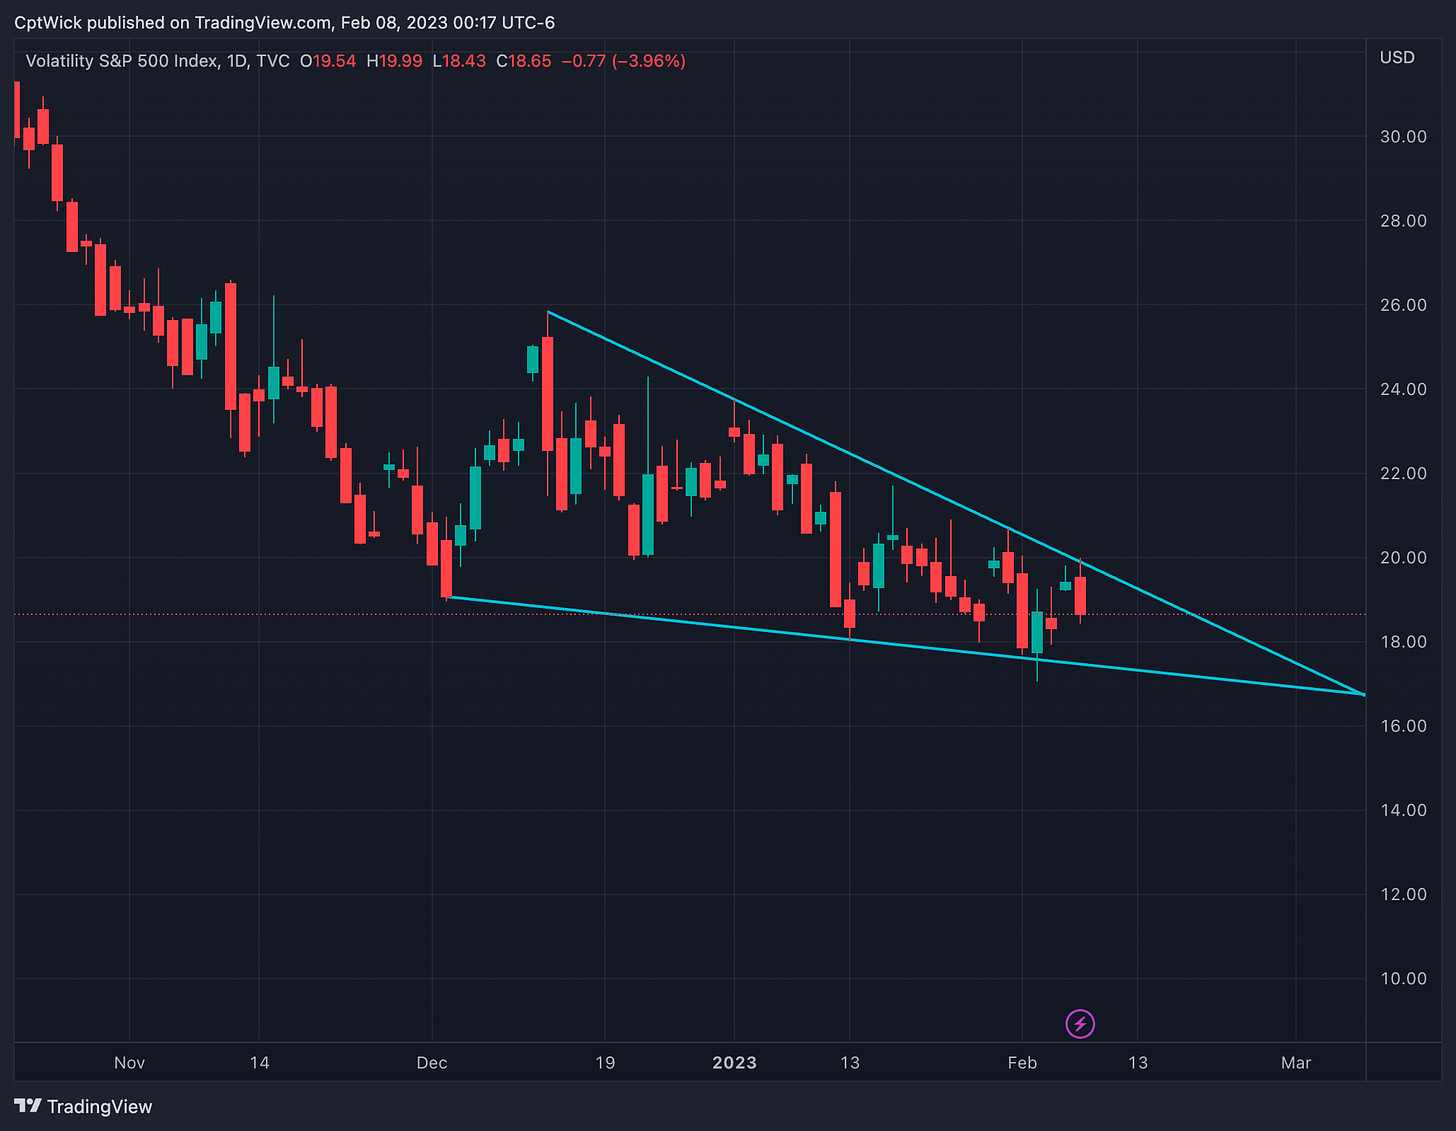
Keep an eye on this, this is very. important. IF we are going to push up over 418 and into that 420 area we probably are going to b still inside this formation or even lower. Don’t loose sight of this. On the flip side if we break out to the upside, well then we want to target the levels below spot in the plan.
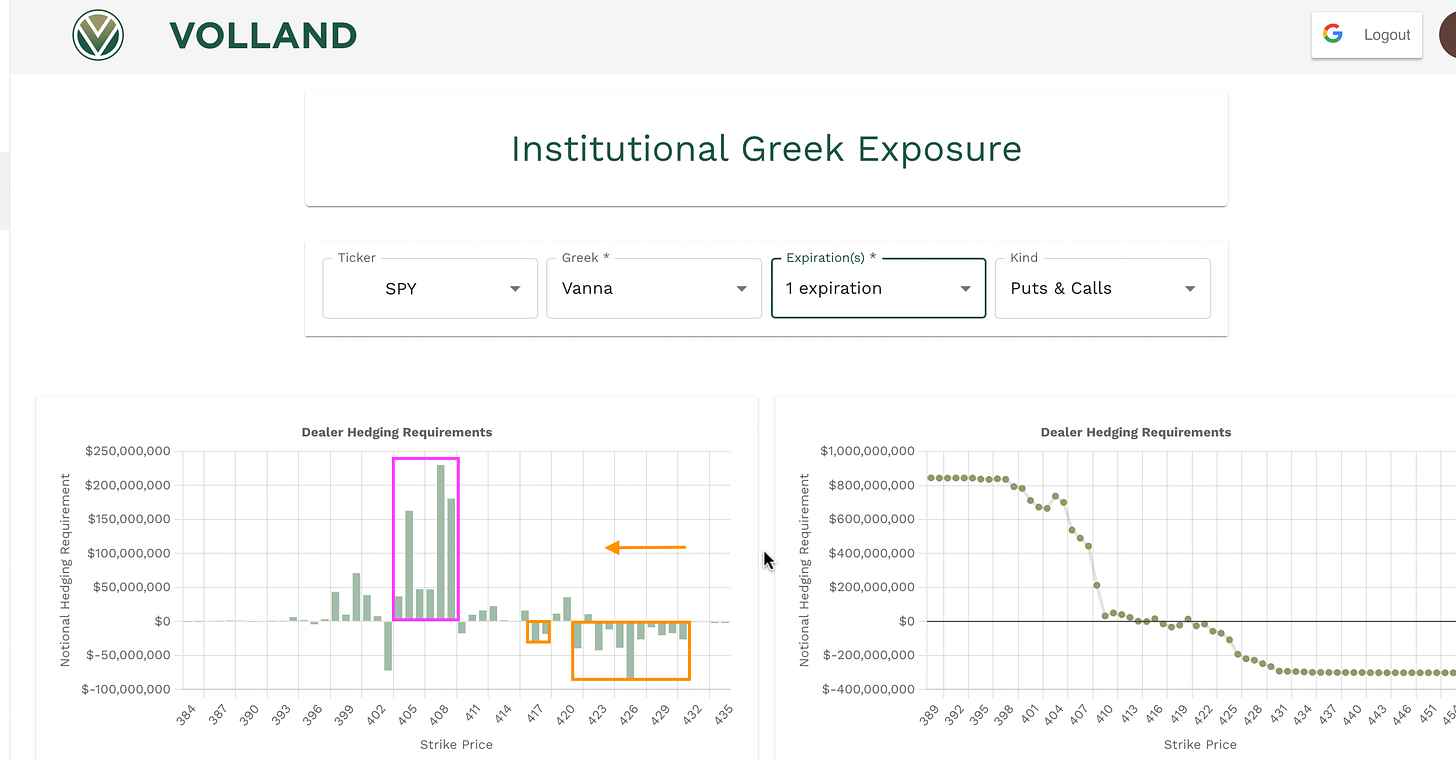
Next thing on the list is the 1DTE Vanna chart. We have that same theme, with most of the positive vanna down below spot, does this mean that’s where we are headed? No, but if the conditions are correct with VIX, I want to target this area below 410.
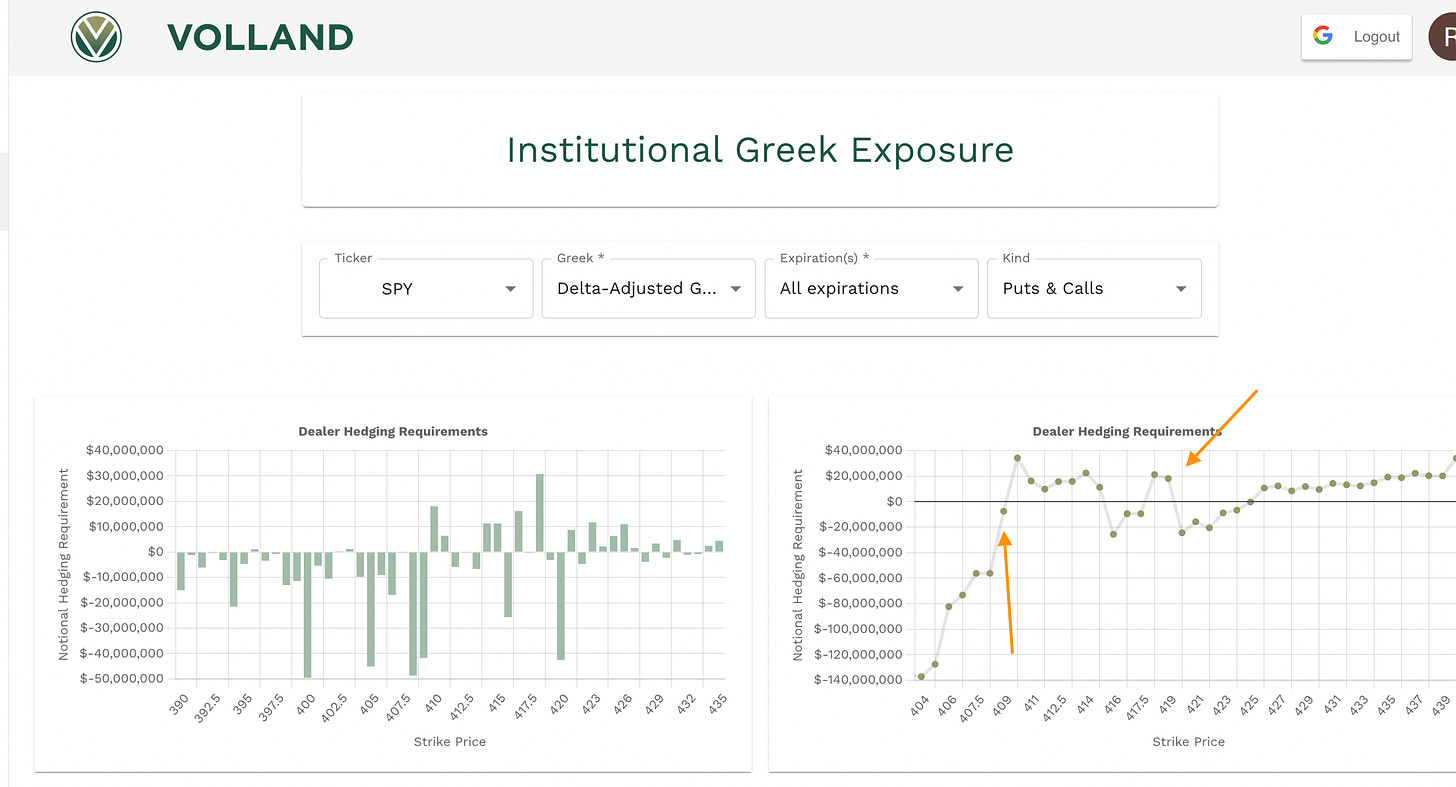
I usually check the DAG on the aggregate as well to see if anything has changed since my weekly post. Its showing that it appears they will try to support price under 409 and if we can push up over 419 they might support a move towards 426.
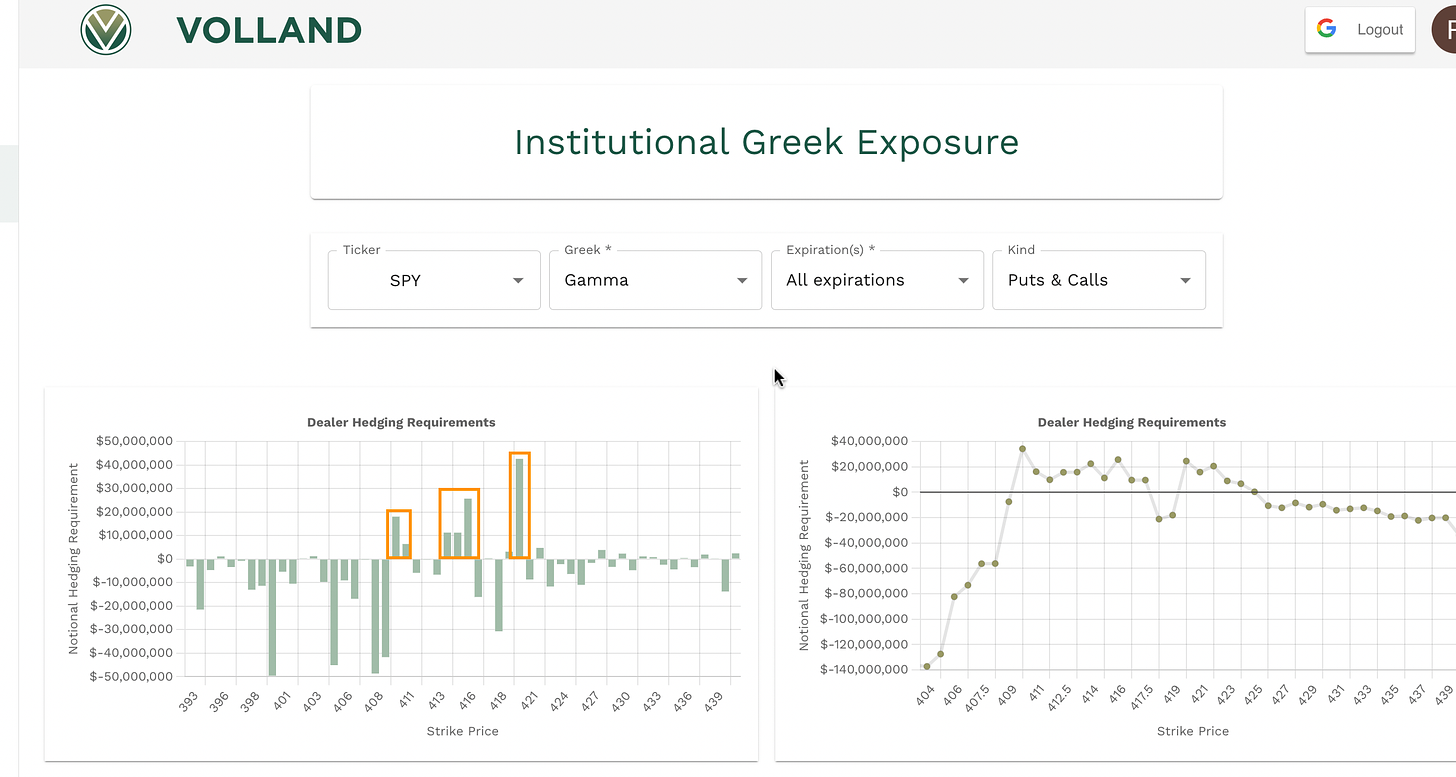
One last chart I want to highlight before my plan is the Gamma chart because it can fill in some missing information on the vanna chart. Positive Gamma is basically support and resistance and we can see that under 410 is potentially bad for the market and a push over 416 we can see 420
—2/8 Trade Plan—
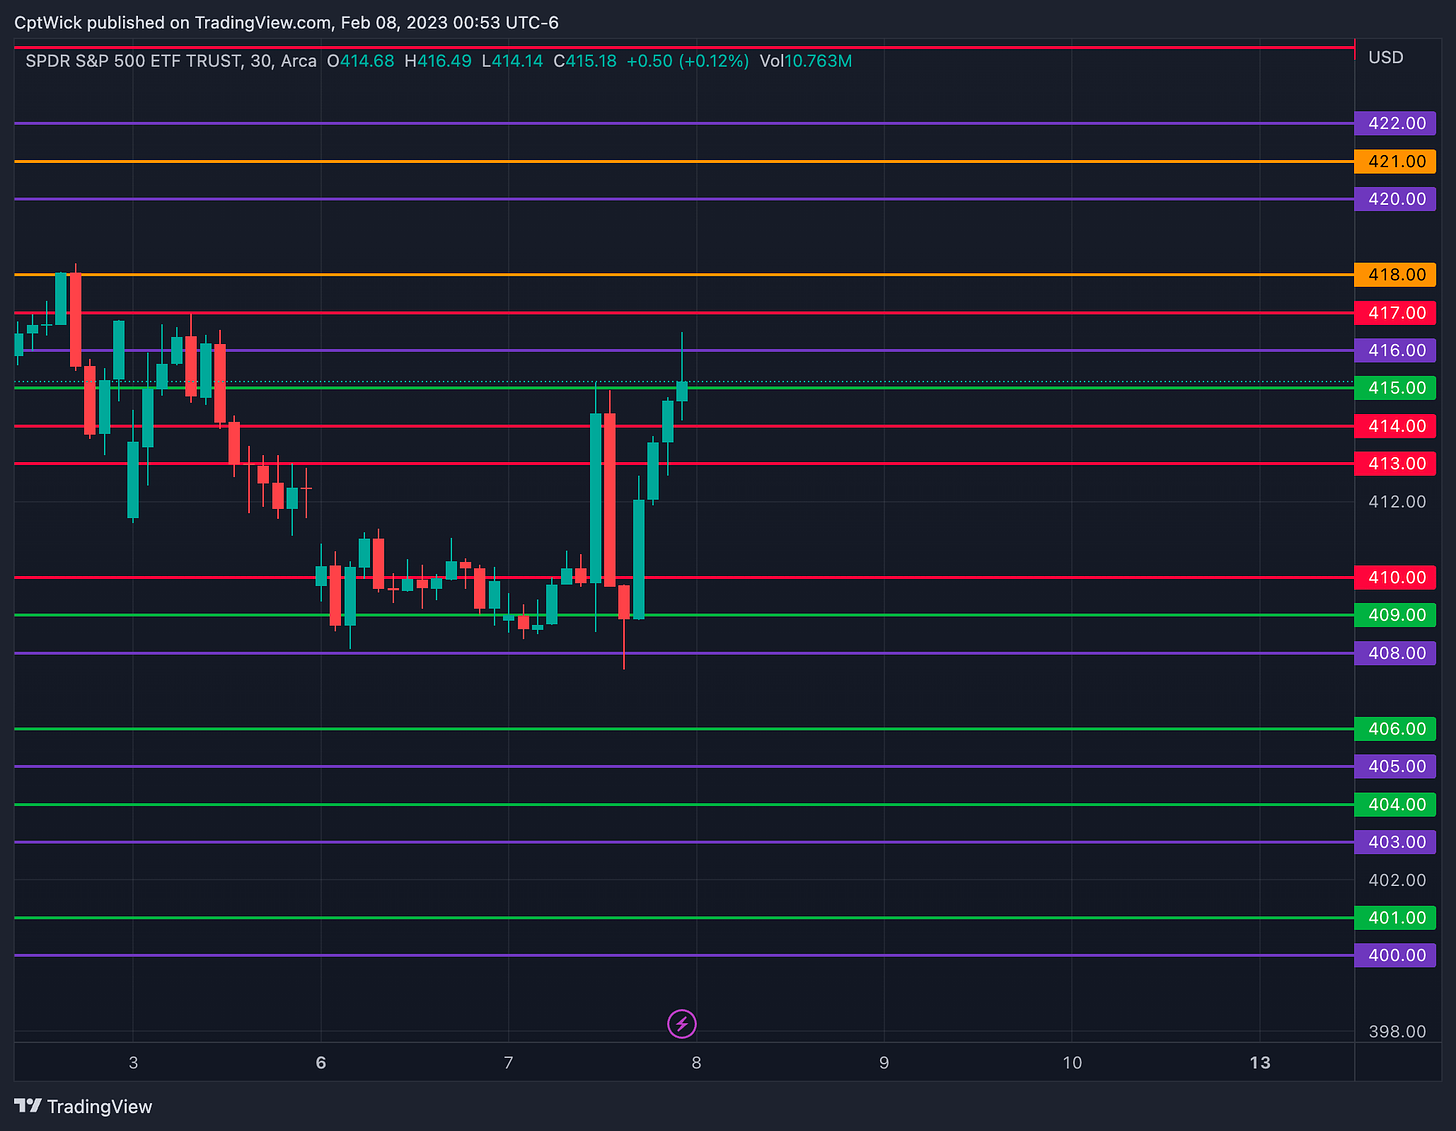
If we take all this info and put it together we can formulate a plan. After I have all my levels marked I like to look at it like this (I understand that it looks congested, but when you are watching a 3min chart its more clear (just wait until we add the LVN’s).
Given the close, my primary focus at the open will be on the level of 414. If 414 holds, I'll be monitoring to see if we can advance above 416 and reach 418. If this occurs, we may encounter a supply zone at 420. However, if 414 fails to hold, I'll be evaluating whether 413 holds as support. If this level also fails, there is a low-volume node at 411.50. If 410 doesn't hold, I anticipate a significant downturn, given the positive vanna below.
ABOVE 414 target 416,418,420BELOW 413 target 410, 408, 406
I understand that this post was lengthy, and I don't plan to make all my posts this extensive in the future. I wanted to share this detailed post with you to demonstrate my research process and how I compile my analysis. Moving forward, my posts will likely be more concise and focused solely on the trade plan.
Thank you for reading!
Happy Trading,
—WICK—
To cover our basis…
Welcome to my Substack where I provide a daily SPY trading plan to help guide my intraday trading. The purpose of this letter is not to advice you on your trading or investment decisions. I am simply documenting my daily trading plan for myself to help with planning and execution. These are simply my opinions and the data sourced from the likes of vol.land, TradingView, Tradytics and others. The stock market is risky, gains are not guaranteed. This is not about getting rich quick, but learn to educate yourself and make the necessary financial decisions on your own. This is not financial advice.

