Nice technical trading on Friday as we saw both sides of the range 4125 and 4175 trade. After nasty ERs from big tech, NFP delighted the bears with a higher reading (although I would say most of that growth is from seasonal adjusted workers).
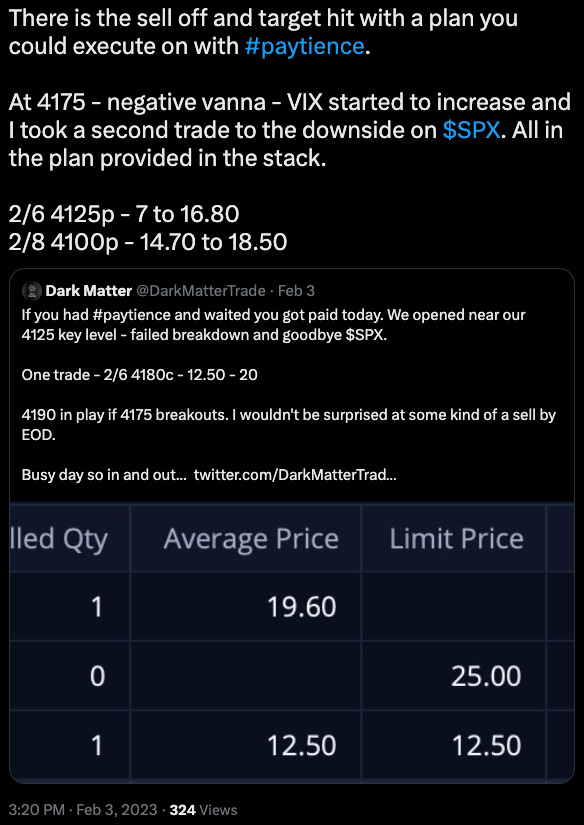
As recapped on Twitter we took two nice trades yielding in another green and profitable day. From the trade plan the two following scenarios played out:
If there is a failed breakdown at 4150 target 4175
If there is a failed breakout at 4175 target 4150 then 4125 then 4110
While we didn’t get that selloff into 4110 it is critical to take your profits and not chase after home runs. Once we get in a 5 pt zone of a target I start to bring my tight loss up. I ended up closing the trade at 4130 instead of waiting much longer for 4125 to trade. More times than not chasing home runs will come back to bite you. My goal is to never take a profitable green trade and have it retrace especially in red. Sell, reset and paytiently wait for another trade or even better walk away happy with green. Compound! Compound!
Trade Plan:
My general lean on the week is any rallies will be faced with selling. The market has rallied quiet a bit and if you follow RSI you can clearly see overbought levels on it.
Based on the data especially looking at Vanna/Gamma/Charm we could see price target 4080 to the downside and potentially 4065. To the upside 4150 and 4175 seem to be our upside targets on the week. Should 4175 be taken out look out for 4190/4200.
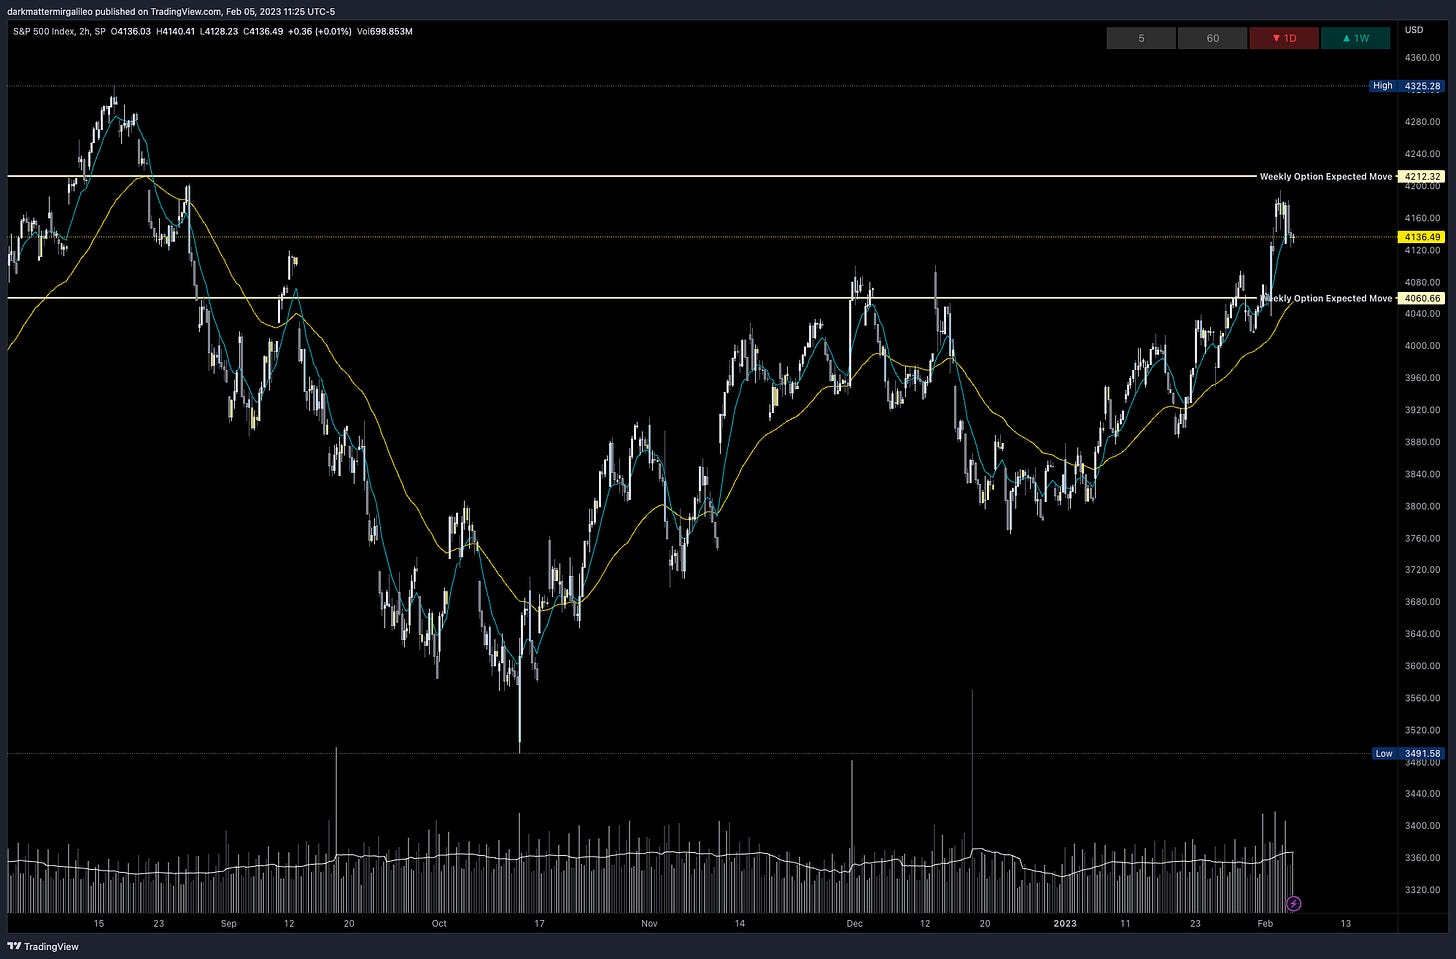
Below is a chart showing the weekly options expected move. More often (~70%) price will close within this range as it did last week.
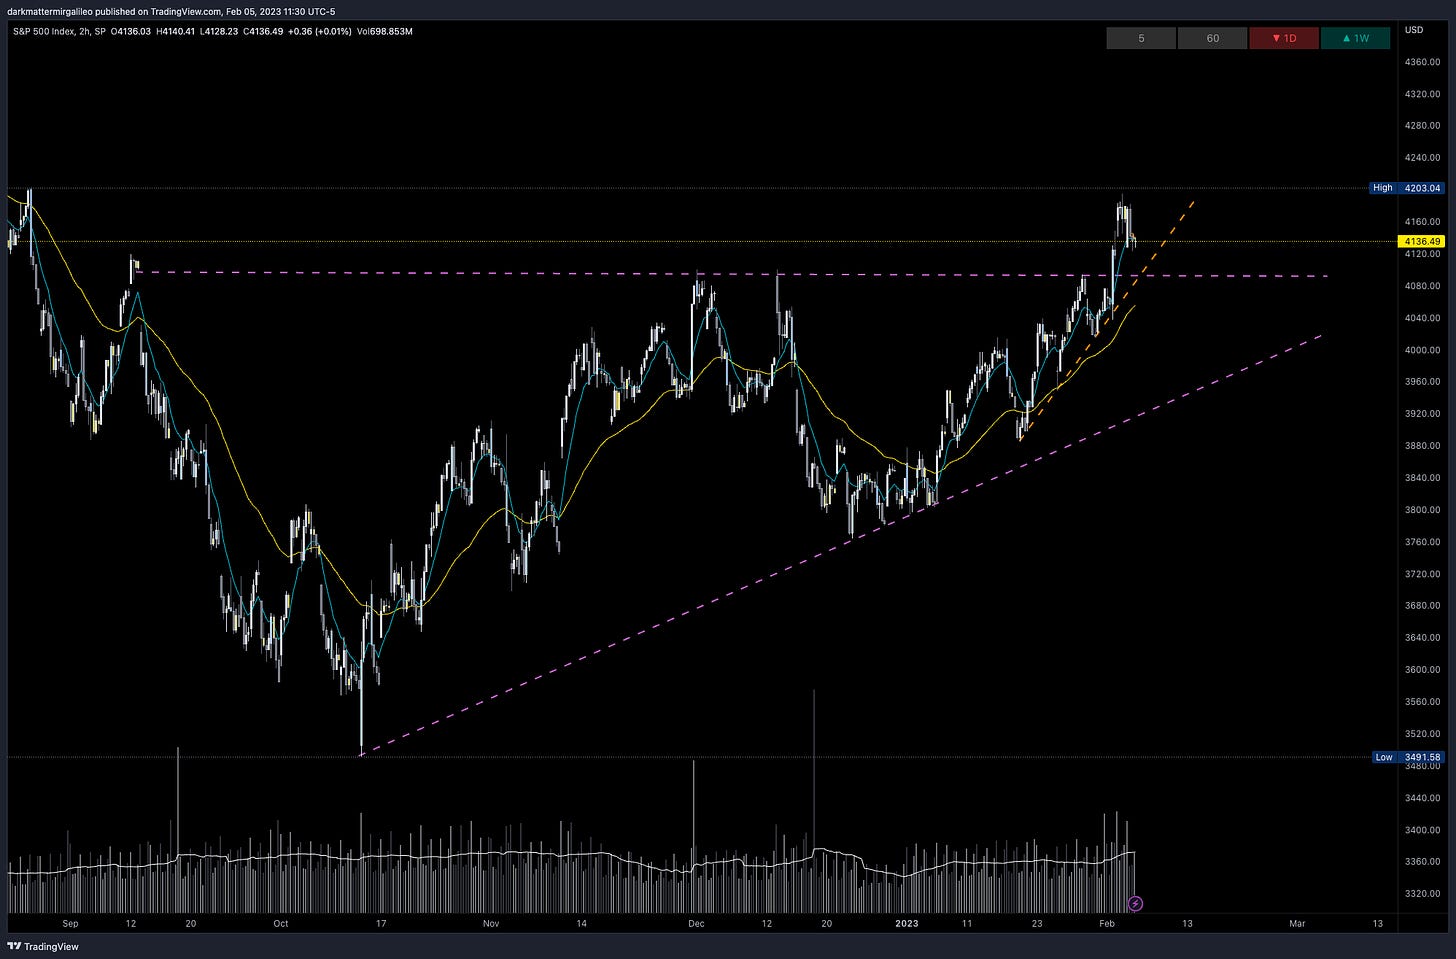
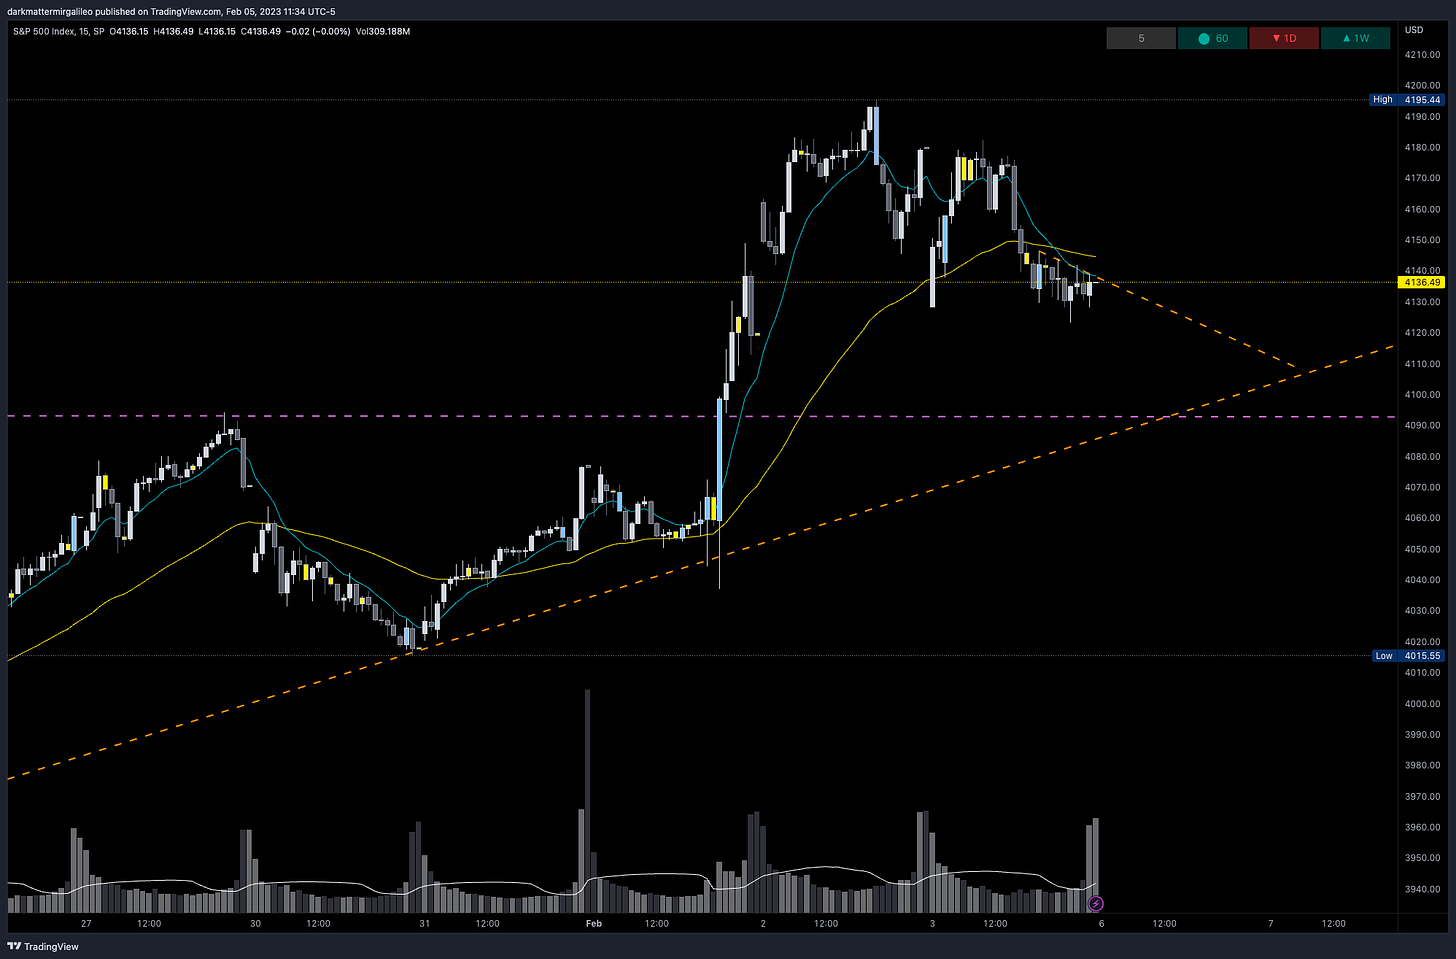
There are a few trendlines I have on my chart.
The first are the two purple lines where we held bottoms and this week blew past resistance - I know want to see this top line act as support if tested - this level is 4093.
The other trendlines I am following correlate to lower timeframes are the orange lines. On Friday we developed a nice down trendline further adding bears have a bit of an edge over the bulls in this zone currently. The other one going a few days further out shows where bulls have stepped in during this impressive run.
Bullish bias:
Above 4150 target 4175 then 4190
If there is a failed breakdown at 4125 target 4150 then 4175 (take profits quick could setup a bull trap)
If there is a breakout of 4175 target 4190
Bearish bias:
Below 4150 target 4125 then 4110
If there is a failed breakout at 4175 target 4150 then 4125 then 4110
If there is a breakdown of 4125 target 4110 then 4100
News Catalyst
No major volatile news events this week like FOMC, but we do have Powell speaking on Tuesday during trading hours and President Biden giving the State of the Union Address Tuesday night.
Some key earnings reports this week as well. No major news events for Monday, but for the full calendar and ER releases see below.
For more information on these events, visit the Economic Calendar
Vol.land Data
For a better understanding of the various greeks below I would suggest you visit the Volland YouTube Page. Volland provides unique data showing where dealers are positioned providing in my opinion a higher degree of conviction to where price may move to.
Vanna - Levels where price may repel or act as magnet
Above Spot:
4200 is a major positive vanna - acting as magnet
4175 is a major negative vanna - acting as repellent
4150 is a major negative vanna - acting as repellent
4145-4190 is a cluster of negative vanna - acting as repellent
4225 is a major negative vanna - acting as repellent
Below Spot:
4125 is a minor positive vanna - acting as magnet
4110 is a minor negative vanna - acting as repellent
4100 is a minor positive vanna - acting as magnet
4080 is a minor negative vanna - acting as repellent
4075 is a minor positive vanna - acting as magnet
4065 is a minor negative vanna - acting as repellent
4060-4045 is a cluster of positive vanna - acting as magnet
4040 is a minor negative vanna - acting as magnet
Vanna levels indicate a pull to the downside - our largest magnet to the upside faces a cluster of negative vanna’s
Our range for 2/6 could be 4115-4150
4125 will be a key level for the bears to break to target 4100
4150 will be a key level to break to target 4175
Gamma and Delta-Adjusted Gamma (DAG)
Above Spot:
4200 is a medium positive Gamma - acting as resistance
4140 is a minor positive Gamma - acting as resistance
Above 4150 will trigger dealer buying pressure targeting 4170
Below Spot:
4125 is a minor positive Gamma - acting as support
4110 is a minor positive Gamma - acting as support
4000 is a major positive Gamma - acting as support
4080 is a minor positive Gamma - acting as support
4065 is a major positive Gamma - acting as support
Below 4125 will trigger dealer selling pressure targeting 4070
Below 4150 support comes in at 4125 then 4110
If we lose 4125 we target 4110 then 4000 then 4080 then 4065
Charm - which direction will dealers be moving price
Negative aggregate charm will push price to the upside - positive aggregate charm will push price to the downside
As we look at the Charm data dealers are hedging more to the downside where we have more positive Charm levels to the upside and the total notional value of Charm is more positive than negative.
Looking at the exposure line graph, below 4150 Charm wants to push price towards 4080.
4125 will be a key level should it want to go further to the downside along with 4100.
If we see the weekly expiry’s Charm is suggesting similar downside pressure with similar key levels as the aggregate data.
Vega - Key levels with highest volatility
Total value of Vega is negative -$35B - which is telling us that dealers need to sell in order to hedge from a Vega standpoint.
4175 minor
4150 major
4140 minor
4125 minor
4110 major
4095 minor
Final Take
While the week might look bearish, bulls are still in control. I wouldn’t rule out that any significant dips into 4080/4060 range won’t be bought up to bring the market back towards 4200.
Stay #paytient and react to the key levels - no predictions! Good luck traders.
To cover our basis…
Welcome to my Substack where I provide a daily SPX trading plan to help guide my intraday trading. The purpose of this letter is not to advice you on your trading or investment decisions. I am simply documenting my daily trading plan for myself to help with planning and execution. These are simply my opinions and the data sourced from the likes of vol.land, TradingView, Tradytics and others. The stock market is risky, gains are not guaranteed. This is not about getting rich quick, but learn to educate yourself and make the necessary financial decisions on your own. This is not financial advice.


