Readers,
-2/3 Recap-
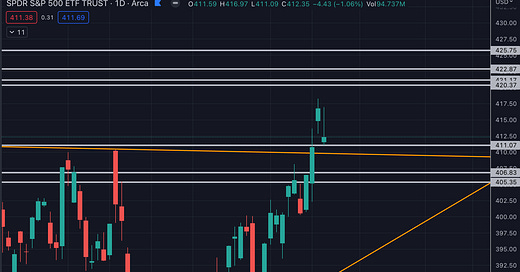
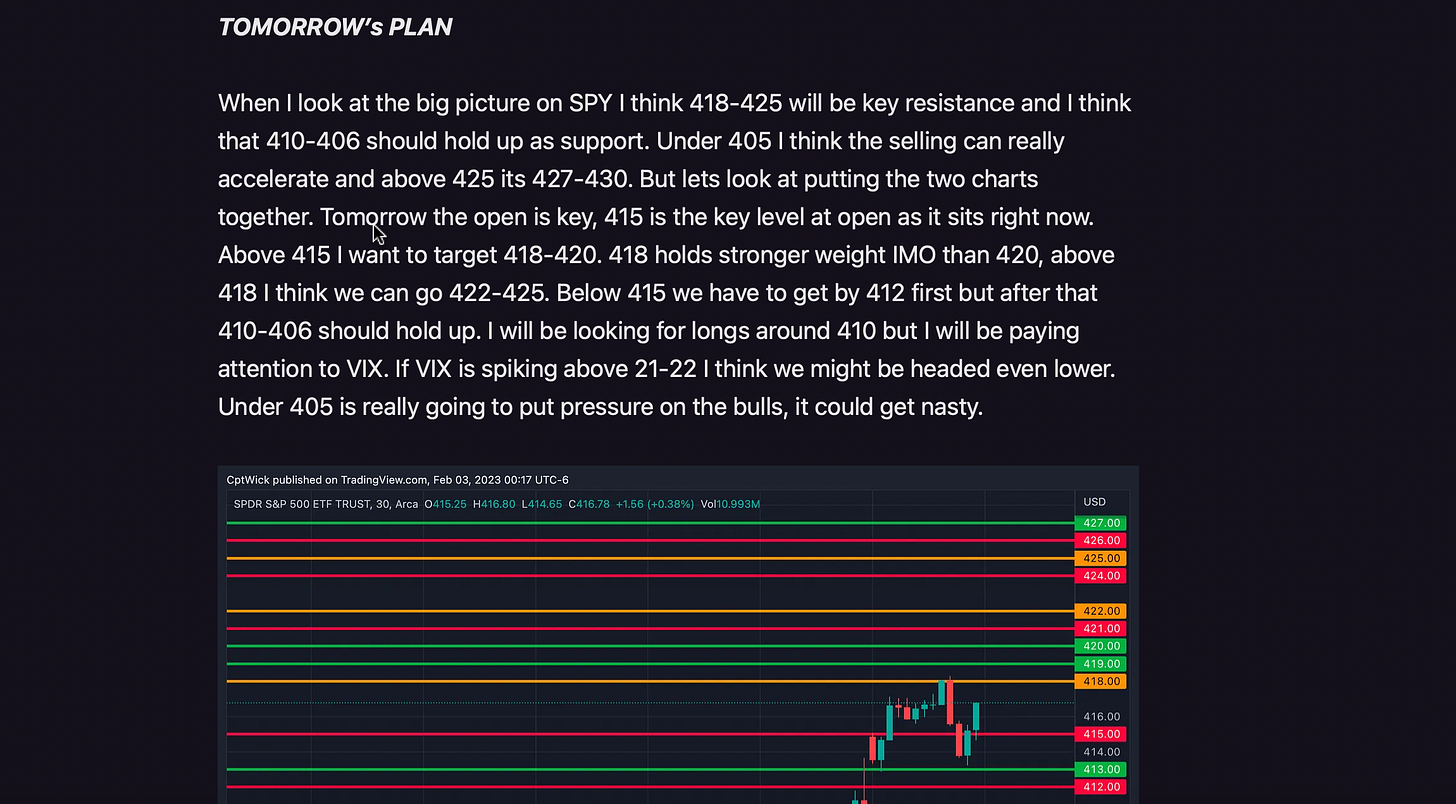
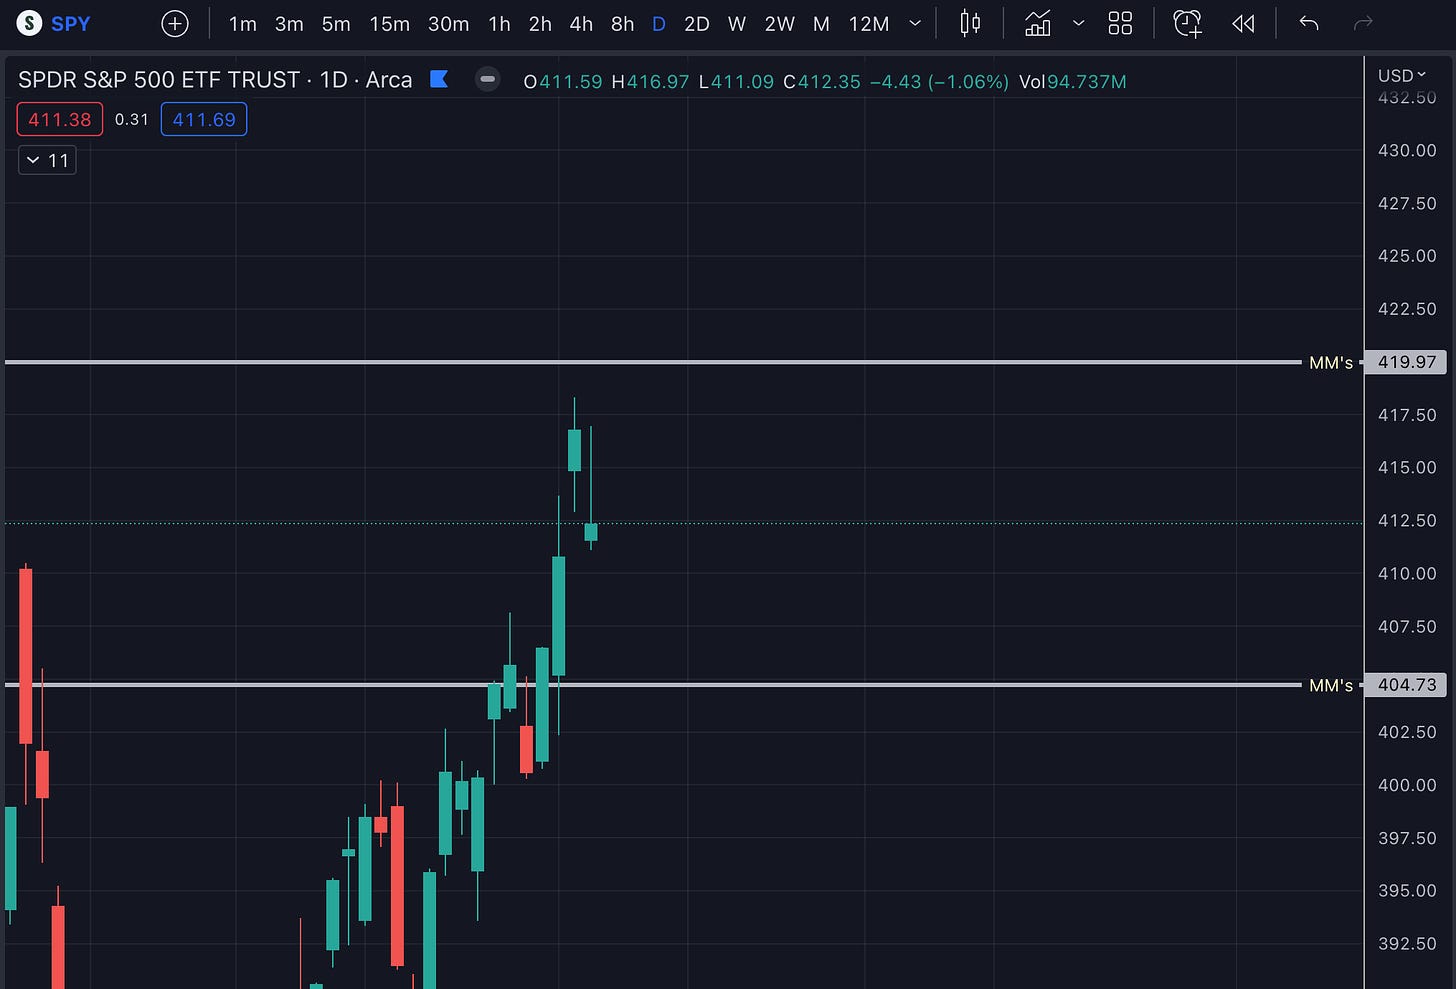
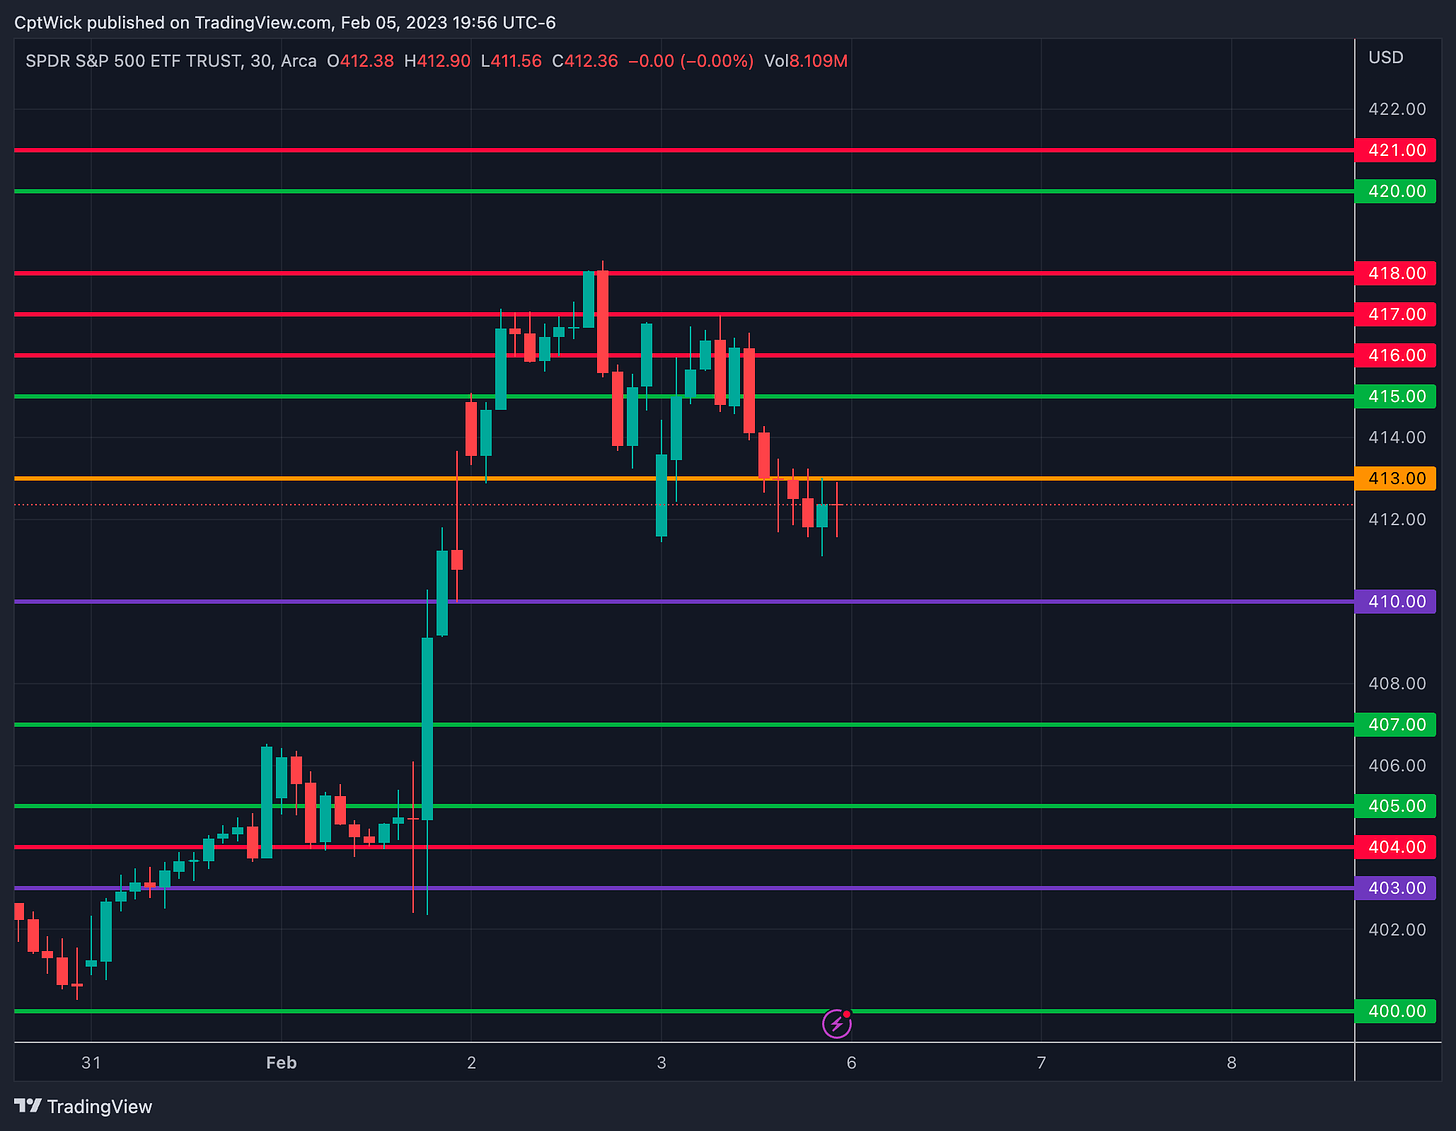
Before we jump into this week I just want to touch base on what happened on Friday 2/3. Our plan worked as intended. We thought we might be trapped between 418 and 410, our trading range was from 416.97 (high) to 411.09 (low). I said that we needed to first get past 412, we gapped down into that 412 zone and rallied strong trying to chase 418, the bulls failed to sustain the rally and we closed at 412.35.
-Weekly Outlook-
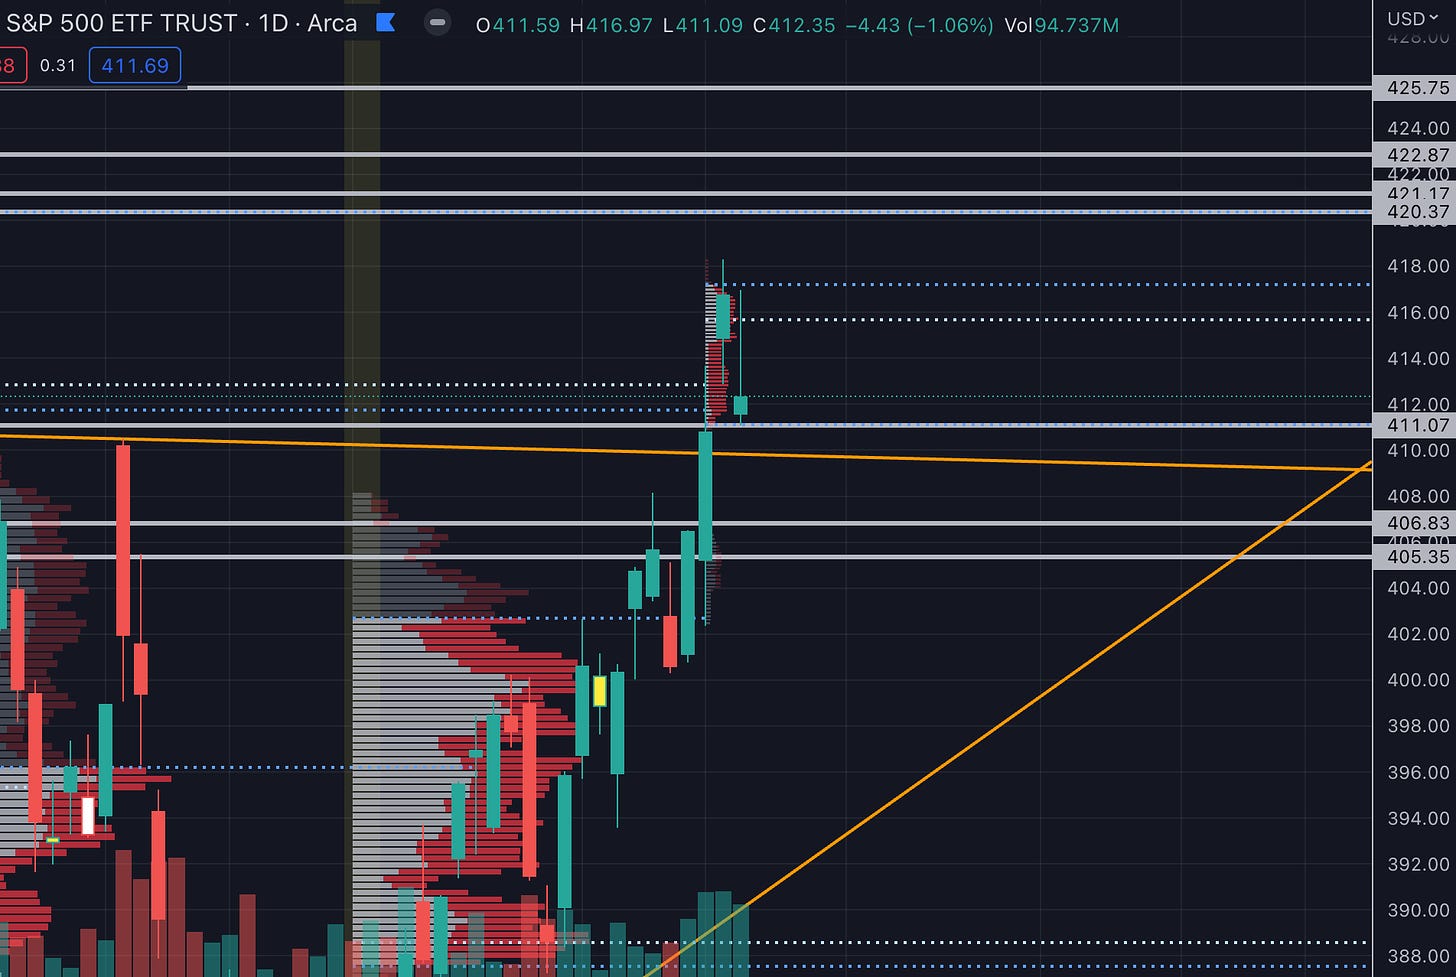
Before we jump into the levels to trade Monday. Here is the 1D SPY chart and my thoughts behind it. As you can see we had a recent bullish breakout of from the 410 area and squeezed higher into the 418 area.
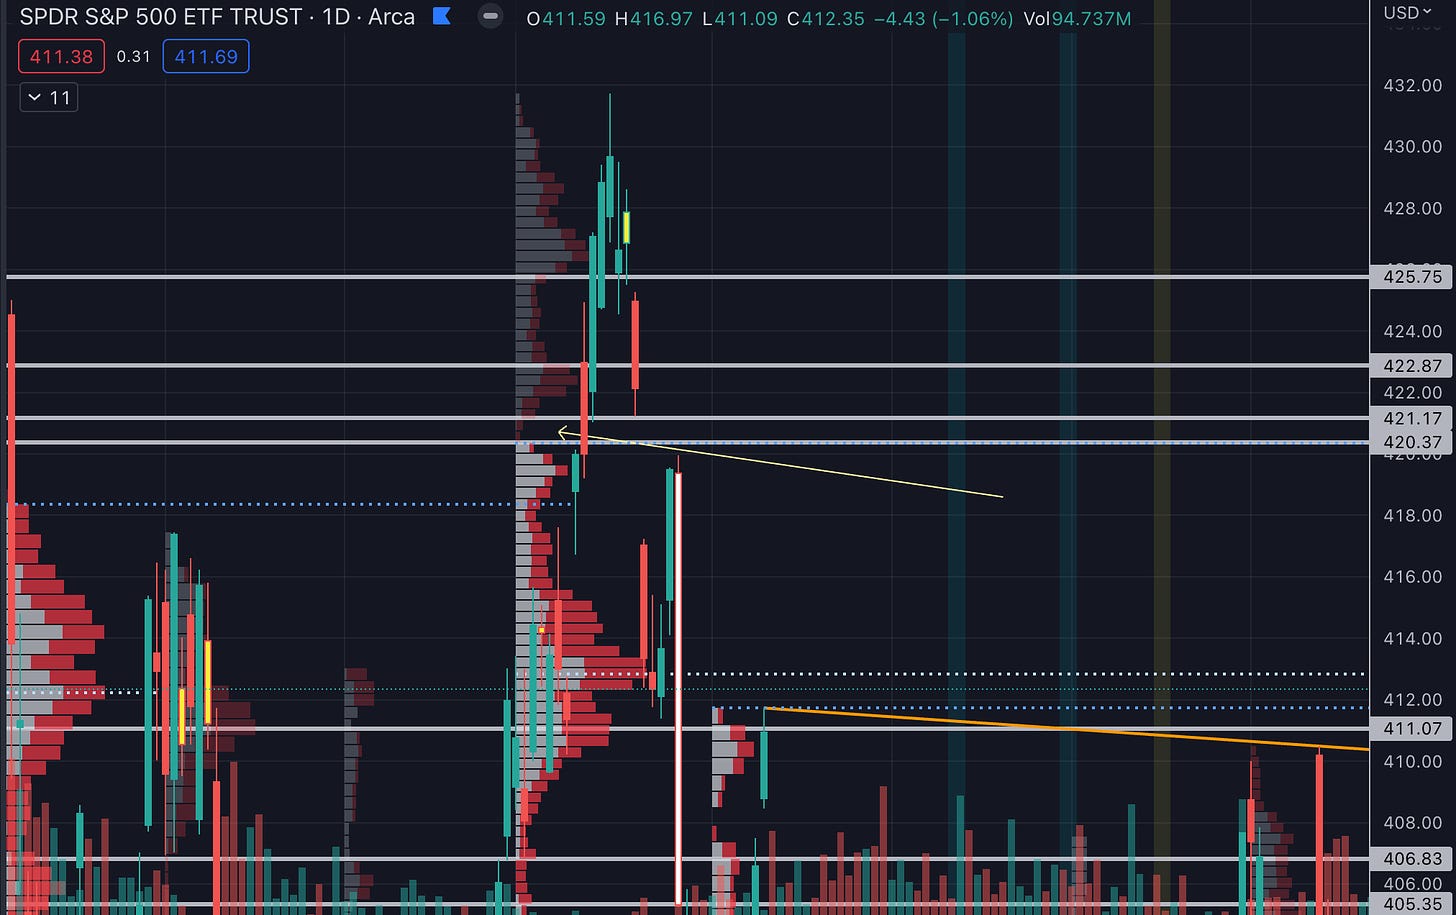
Now where are the key areas above and below spot? Let’s take a look. If we go back to August we can see that we have a gap in volume.
A LVN (low volume node) is important because price didn’t stay in that area long, the price was “unfair” and it creates a imbalance, they typically form in-between two HVN (high volume nodes) or “balanced” areas of the volume profile. Typically price won’t trade long within a LVN, so we like to look for rejections, bounces, or break of the LVN and a retest for a continuation play.
This to me is a quality supply zone. If we open below this area and price comes into it, I would expect some selling pressure. IF bulls are able to push through this area, it would then become support, above 422 the volume thins out again, it could be a straight shot to 425-427.
Below spot we can see the volume is relatively light with some volume starting to build around 406-405. This area is where I would look for price to be supported.
Also we need to note what the market makers expectations are for the week, the way that I do this is I check Thinkorswim around the market close on Friday and I note the expected move for the following Friday, here is what they thought as of market close on 2/3.
They are expecting a close around one of these two values. 419.97 and 404.73.
-Vol.land Data-
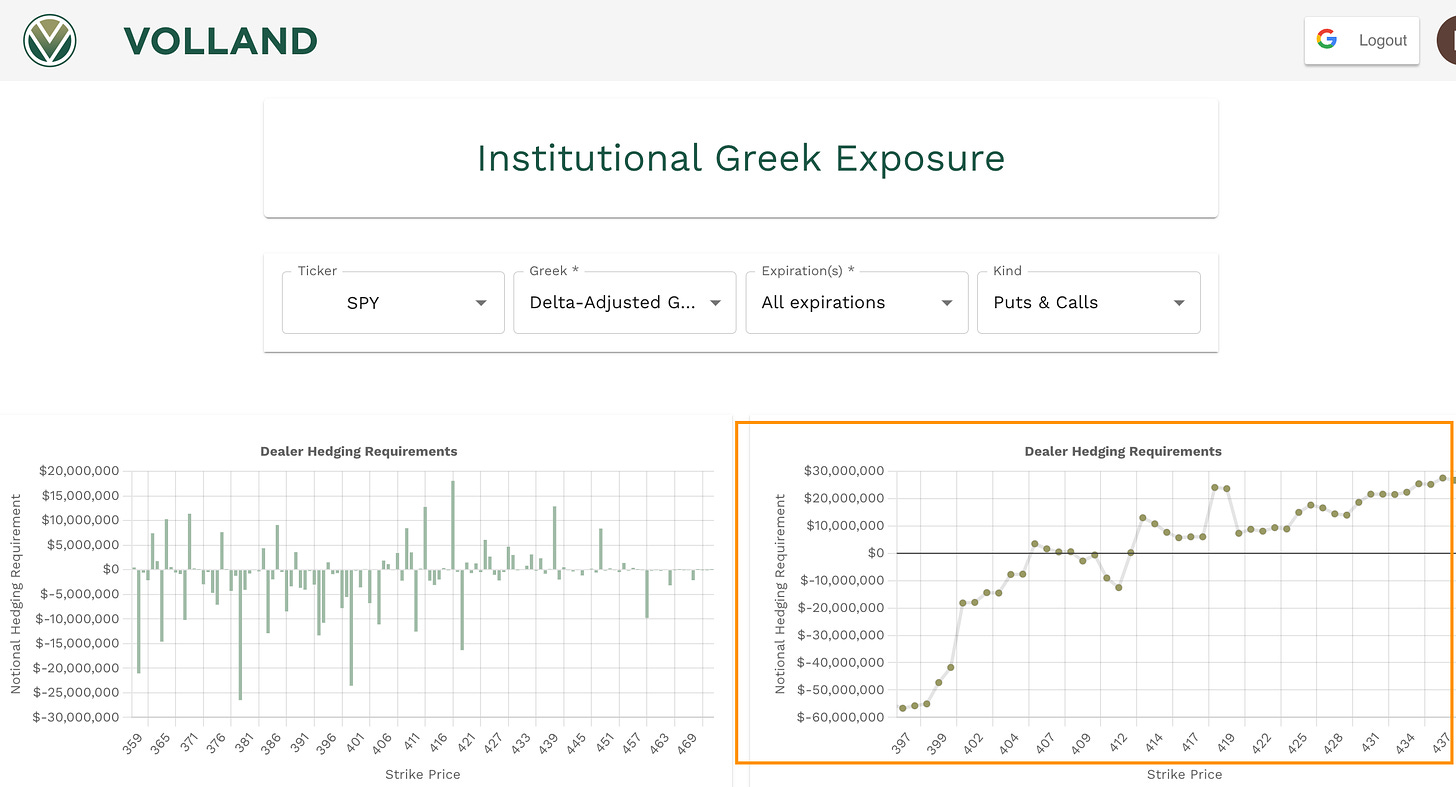
Lets take a look at a few data points that can help us in forming a plan (these values will change day to day so I will update as we go forward), first I want to highlight the DAG or Delta-Adjusted Gamma, and I want to highlight the chart on the right. When we look at this chart, when it’s positive we can expect selling pressure and vice versa.
This chart is supporting what the 1D chart from above, at the upper range it shows the selling pressure and below the buying pressure.
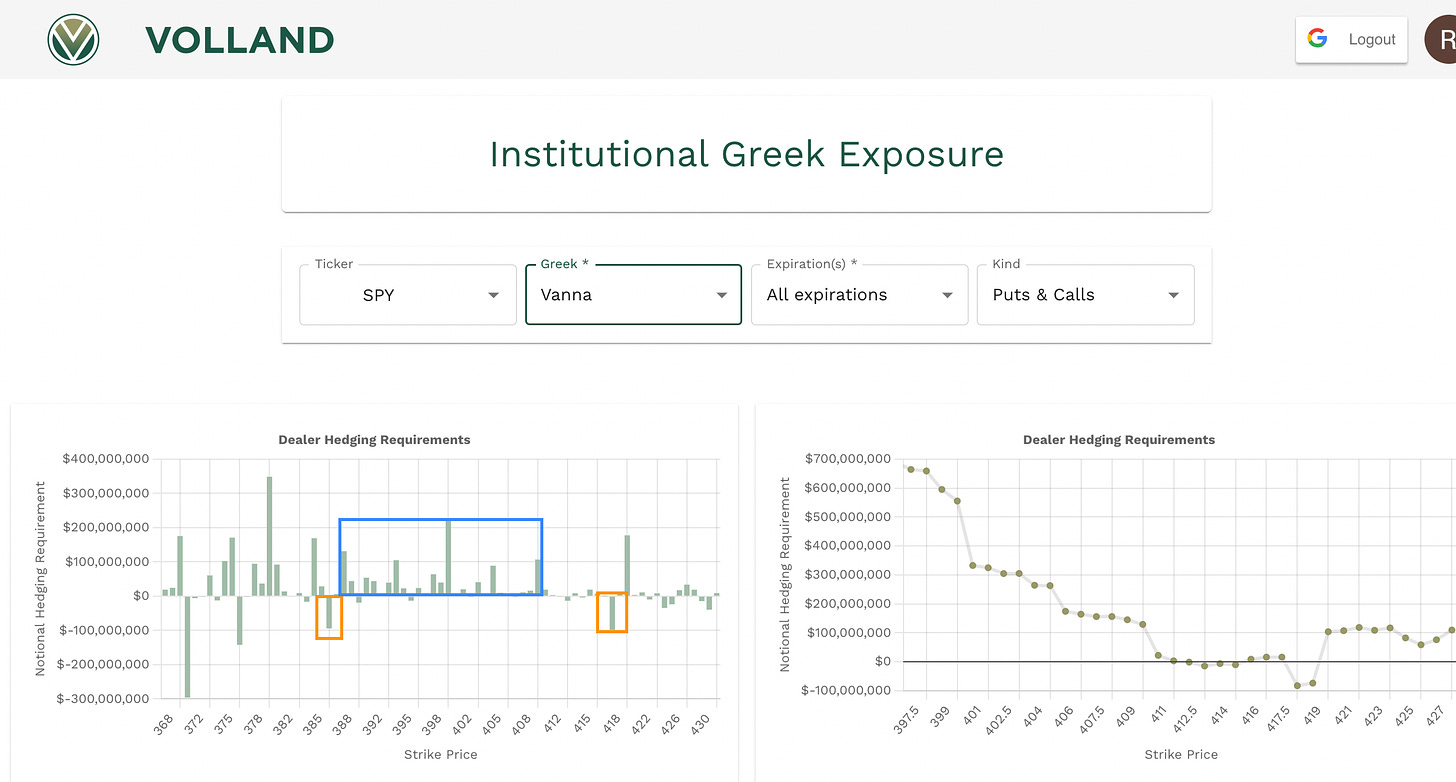
Next let’s look at what vanna is saying, we have two areas of negative vanna at 387 and 418, and positive vanna from 385 and 410. What this is saying is as it sits now they want to try and keep price between these values, with the strong positive pull or magnet is to the downside. This chart is supported by VIX, if those positive values below are going to pull us down we need VIX or IV to increase, if VIX spikes I will look for price to find its way down towards these positive values.
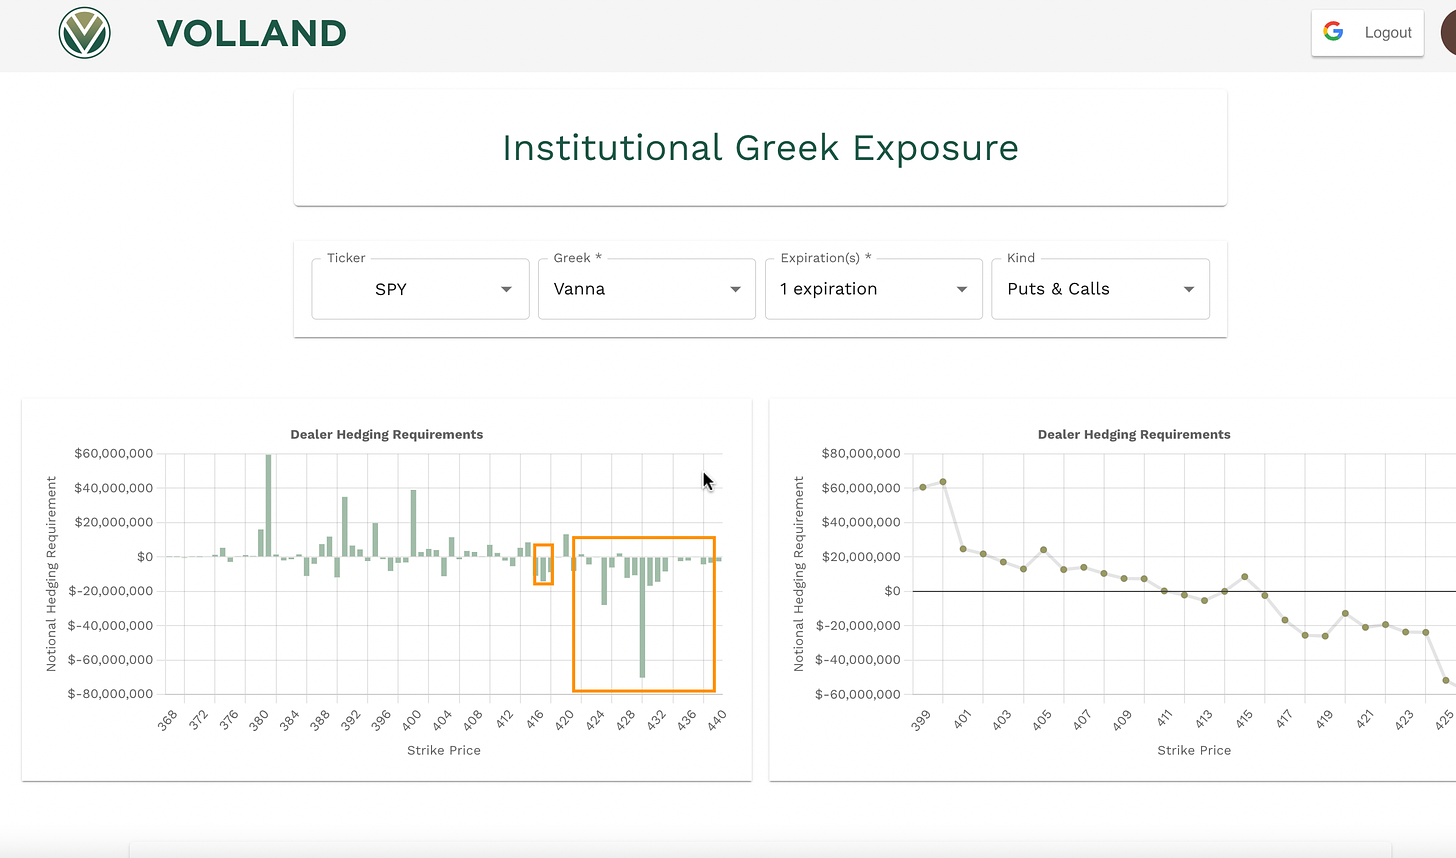
This next image shows the vanna for only 2/6. Im still in the process of studying these 1DTE charts via Volland I have been keeping a log of these over the past two weeks and i’m still collecting data on them but notice all the negative vanna above spot, and the positive is below, I am leaning towards rallies get sold tomorrow based on this Information, but we have to take into consideration all other factors.. and the big one is VIX…
Trade Plan 2/6
I want to see how we open first and foremost, and I want to know if we open below or above 413. 413 tomorrow for me is the key, 413 is both negative vanna on the 1dte and aggregate charts. IF we stay below 413 I think that would take us on a path to test 405 and even sub 400 (not 0dte). Above 413 we might hang out around 415-418 again with 420-422 being potential targets. I don’t want to be in the camp of calling a top or saying that we are headed to 430, I want to just play it day by day.
Key level for tomorrow is 413, bearish below and bullish above.
Below 413 target 411-410, under 410 target 406-405.
Above 413 target 415-418, above 418 target 420-422.
Also, tomorrow is Monday, I typically sit out of the initial balance (first hour) unless it plays out how I anticipate. We gotta be #paytient. If the setup isn’t there, we sit on our hands. Ill try to give an update via Twitter, feel free to DM me on twitter if you have any questions or suggestions!
Happy Trading!
—WICK—
To cover our basis…
Welcome to my Substack where I provide a daily SPY trading plan to help guide my intraday trading. The purpose of this letter is not to advice you on your trading or investment decisions. I am simply documenting my daily trading plan for myself to help with planning and execution. These are simply my opinions and the data sourced from the likes of vol.land, TradingView, Tradytics and others. The stock market is risky, gains are not guaranteed. This is not about getting rich quick, but learn to educate yourself and make the necessary financial decisions on your own. This is not financial advice.




Combining volume profile and option greeks to come up with levels is brilliant. I think those are only two things that matter for price movement these days