INTRO (if you want to skip to just the plan for 2/3, scroll down to (TOMORROW’s PLAN))
Before we get started here I will go ahead and give a little back story. I have been trading/investing and studying the markets going on 10 years now. I used to work at a Fortune 500 insurance agency and one of my co-workers (my cubicle buddy), he was big into stocks and more specifically options. He would always spend his breaks and free time at work looking at charts/news and I eventually started asking questions, it blew my mind. I didn’t even know options were a thing, I always thought that you had to have tons and tons of money to be a “day trader” because of PDT rules. Boy was I wrong. So anyway, I left the insurance scene and found my self working for a massive investment/trading company that most of you use to place your trades. The financial markets have humbled me time and time again throughout my 10 year journey but there was one thing I didn’t do, quit. I never gave up, I was determined to make it work. I have tried everything you can think of in terms of the holy grail trading system and really there only has been one that has stuck with me sense the day I fell in love with it… supply and demand, and the concept of supply and demand never really fully clicked until I discovered the volume profile. So my main “strategy” when it comes to finding a entry and a exit for a trade is volume and price, its that simple. Ive tried this guru and that furu and all the other noise, but I am telling you, the big component to all of it was you have to have volume/or lack of volume(we will cover this in a future post), and you need to have an idea or a plan if you will, or what price is going to do once it gets to a key level(we will cover this as well). That’s all you need but are there other factors involved? Absolutely! The market has many moving parts and its going to take you awhile to understand how it all works and why it works the way it does but I am going to help you along the way, or I hope you can gain some value from the content I am going to put out. Why am I making these post public? Well, I already keep daily logs of all of my trading. I have a daily plan that I type to myself (and a few others i’ve met along the way), so I figured hey, if I already take the time to write this all down for myself, I might as well share it. I make these plans because 1) When I write out my thoughts it helps me understand it even more and 2) if I need to reference any levels or key events coming up, its all in one place.
THE MISSING LINK
This might be the most important piece of the puzzle I am telling you this right here will take your trading/market knowledge to the next level, FIND A TRADING PARTNER! Find someone, a friend, someone in a discord or a slack group, find someone on social media, but find someone or a small group of people that you can bounce your ideas off. I would try and talk to friends and family about trading and id say 97% of the time no one had a clue what I was talking about. I had a family friend that hit big on GME calls (I don’t wanna talk about it lol) but I was invited into a small “group chat” with about 10 or so guys and they all traded crypto. Not my cup of tea, I was like what am I doing in here? But I got to talking and going over how I trade, short term option contracts and one of the guys in the group really stood out to me…
MY MAIN GOAL
I am going to keep these short and to the point. I want these trade plans to be easy to follow. I will leave notes here on key events but if you want to know what is REALLY going on I suggest read daily post, he will go into more details. He is also going to cover SPX and I am going to cover SPY, just note that the overall plan on both ends is more than likely going to be the same, the levels are just going to be different. SO if you are more comfortable trading SPY, you will find the key levels here on my posts! I will go into further detail on a future post on how I get the levels but lets get into what I am looking at for 2/3.
FORMAT
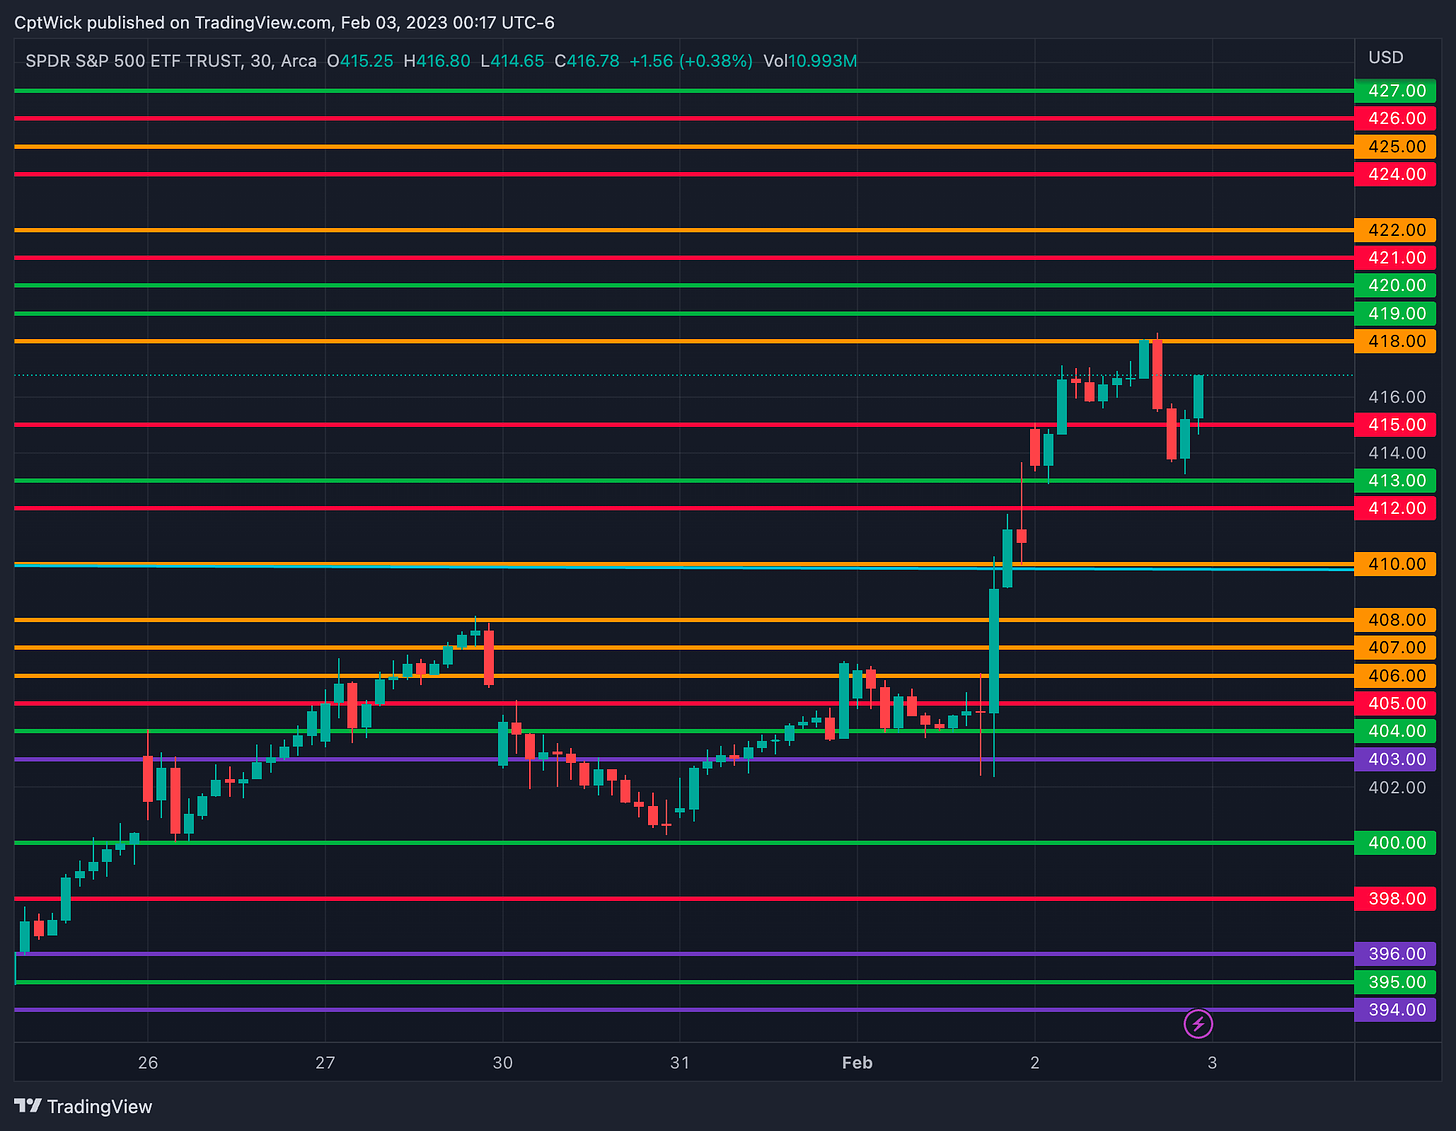
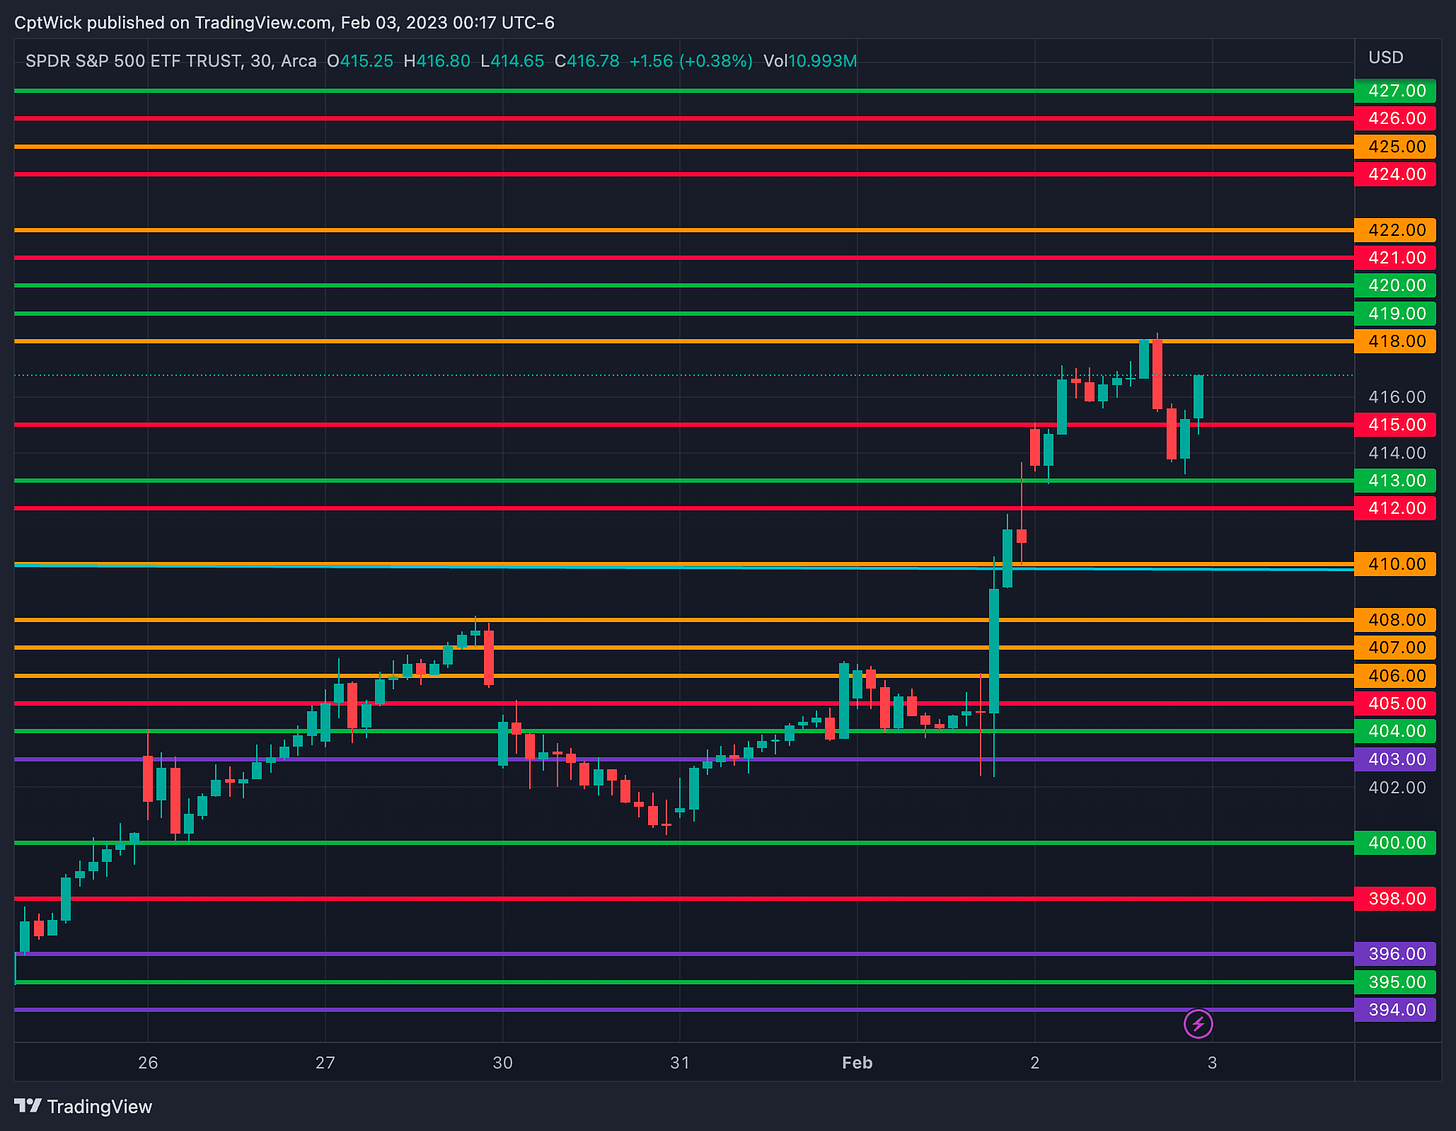
I am going to share a couple charts with you. These charts are going to have some of the same levels but I will break it down for you.
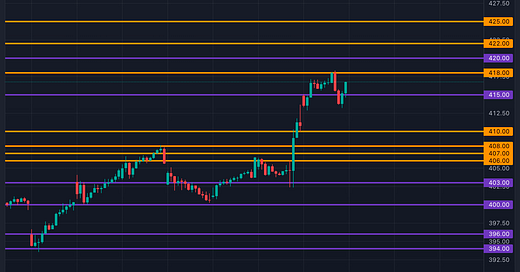
This first chart highlights my key levels for the trading based on a larger timeframe or in terms of aggregate data, this is the BIG PICTURE. The orange levels are going to be stronger areas of overall support and resistance, and the blue levels are magnets, so looking at this chart, if we were to break 418, price should hit 420, and 422+ would serve as resistance or a spot that I would be looking to short (or long puts). If price falls to the 410 area I would expect that to be supported because of the “strength” of the levels (we will cover this later don’t you worry). Under 406 I would expect price to head towards the next orange level, but we might make some spots along the way.
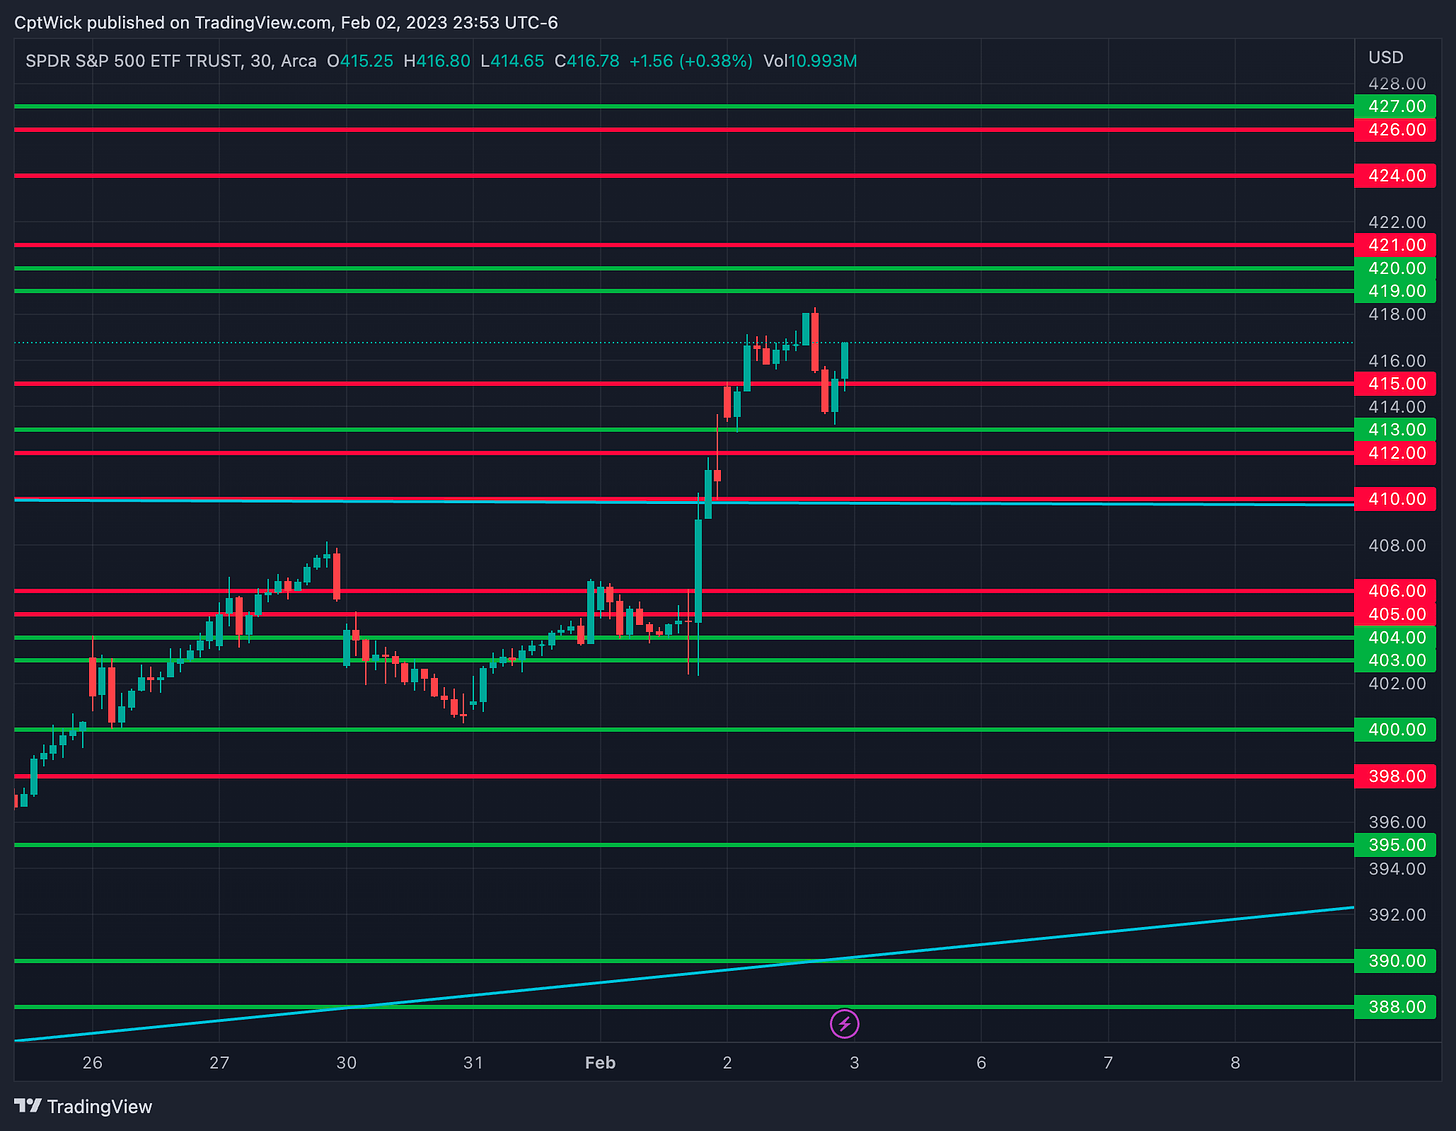
This next chart, these are the levels/data for 0DTE contracts. I use both charts when planning my trading day. you can see that some of the levels jive with each other. But its the same drill as the chart above just with different colors. The red ones are strong support/resistance, and the green are magnets or levels I think we can pass through.
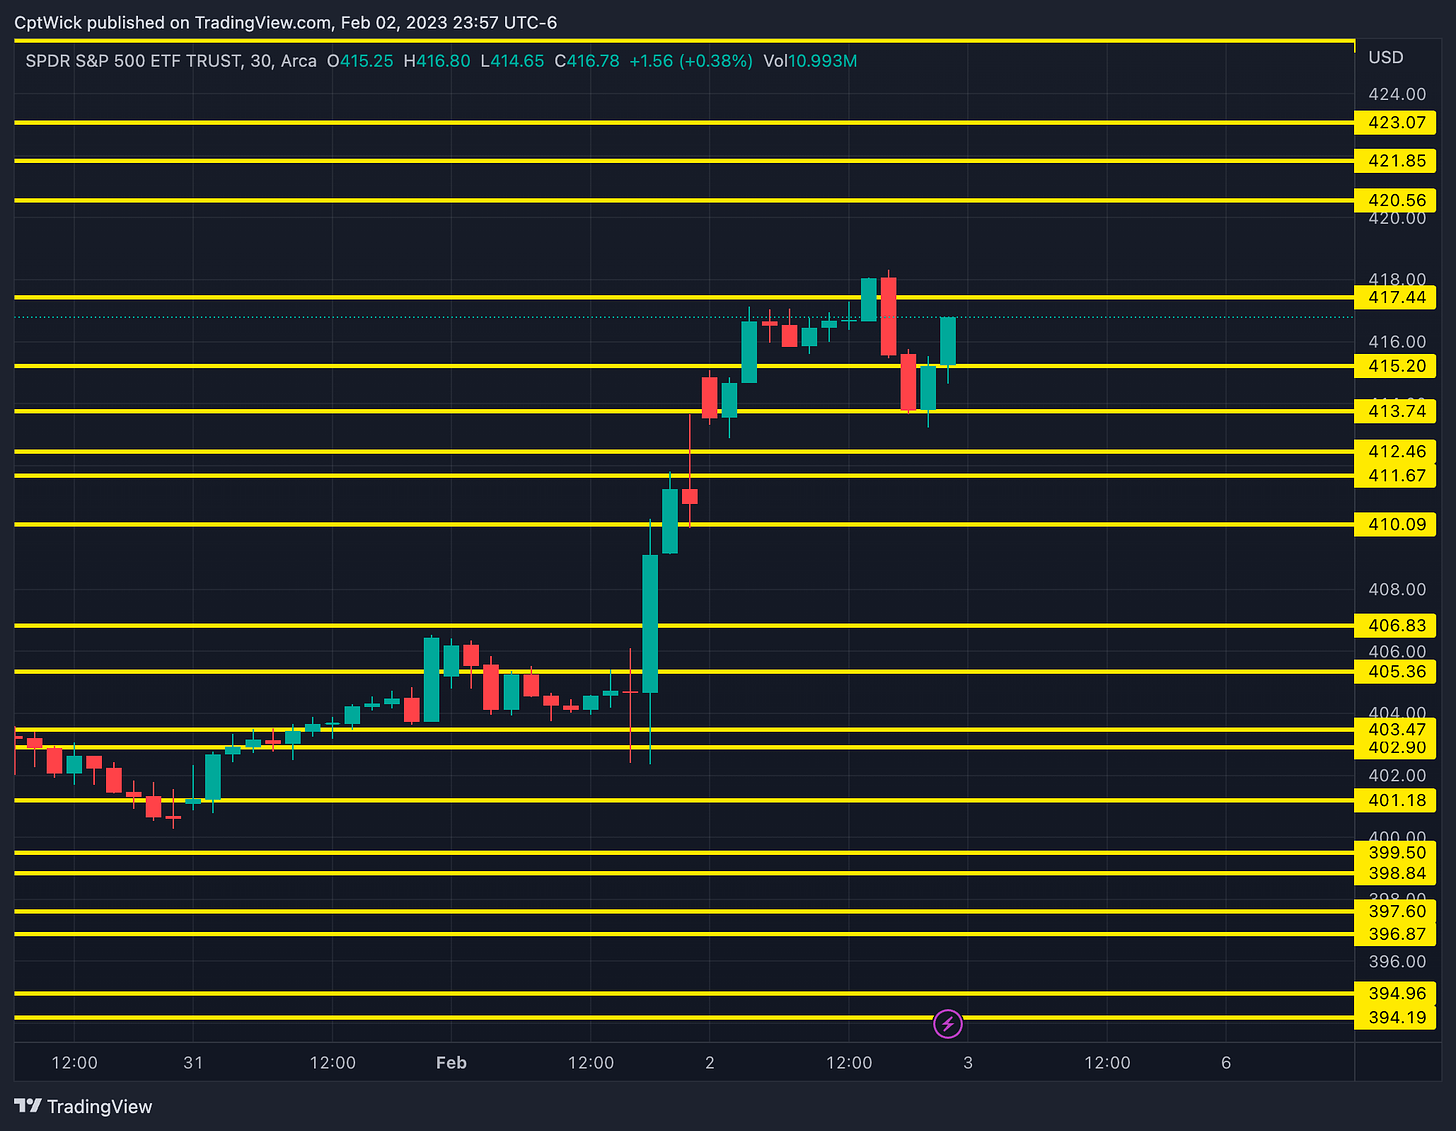
You might also see yellow levels on my charts. These are LVN (low volume nodes), these are areas that I see on the volume profile that are low volume. I like these areas as quality supply and demand. You will see of the course of these how many times they work! I will also teach you, what I believe is the best method (or how I go about finding these).
TOMORROW’s PLAN
When I look at the big picture on SPY I think 418-425 will be key resistance and I think that 410-406 should hold up as support. Under 405 I think the selling can really accelerate and above 425 its 427-430. But lets look at putting the two charts together. Tomorrow the open is key, 415 is the key level at open as it sits right now. Above 415 I want to target 418-420. 418 holds stronger weight IMO than 420, above 418 I think we can go 422-425. Below 415 we have to get by 412 first but after that 410-406 should hold up. I will be looking for longs around 410 but I will be paying attention to VIX. If VIX is spiking above 21-22 I think we might be headed even lower. Under 405 is really going to put pressure on the bulls, it could get nasty.
I am not saying sell 418 and buy 410. I will say tho that according to what I see, we could be pinned between 410 and 418. Once we start breaking away from those levels is when we need to be aware of what else is happening. I will try and share some commentary here Twitter
—- Feel free to DM me on twitter if you have any questions or any suggestions that you might have—-
I have never done this type of thing publicly, I have only done this for me and a select few. This is not financial advice, these are simply my opinions and notes for what I am looking at for the up and coming trading session. I also do not have a professional English degree and have never published anything ever, I will make mistakes but I will be fine tuning these posts so we can all benefit and learn something new. I hope you are understanding along the way. Thank you for taking the time to read this. Let me know what you think!
—WICK—
All writers' opinions are their own and do not constitute financial advice in any way whatsoever. Nothing published by Captain Wick constitutes an investment recommendation, nor should any data orContent published by Captain Wick be relied upon for any investment activities. Captain Wick strongly recommends that you perform your own independent research and/or speak with a qualified investment professional before making any financial decisions.

