Readers,
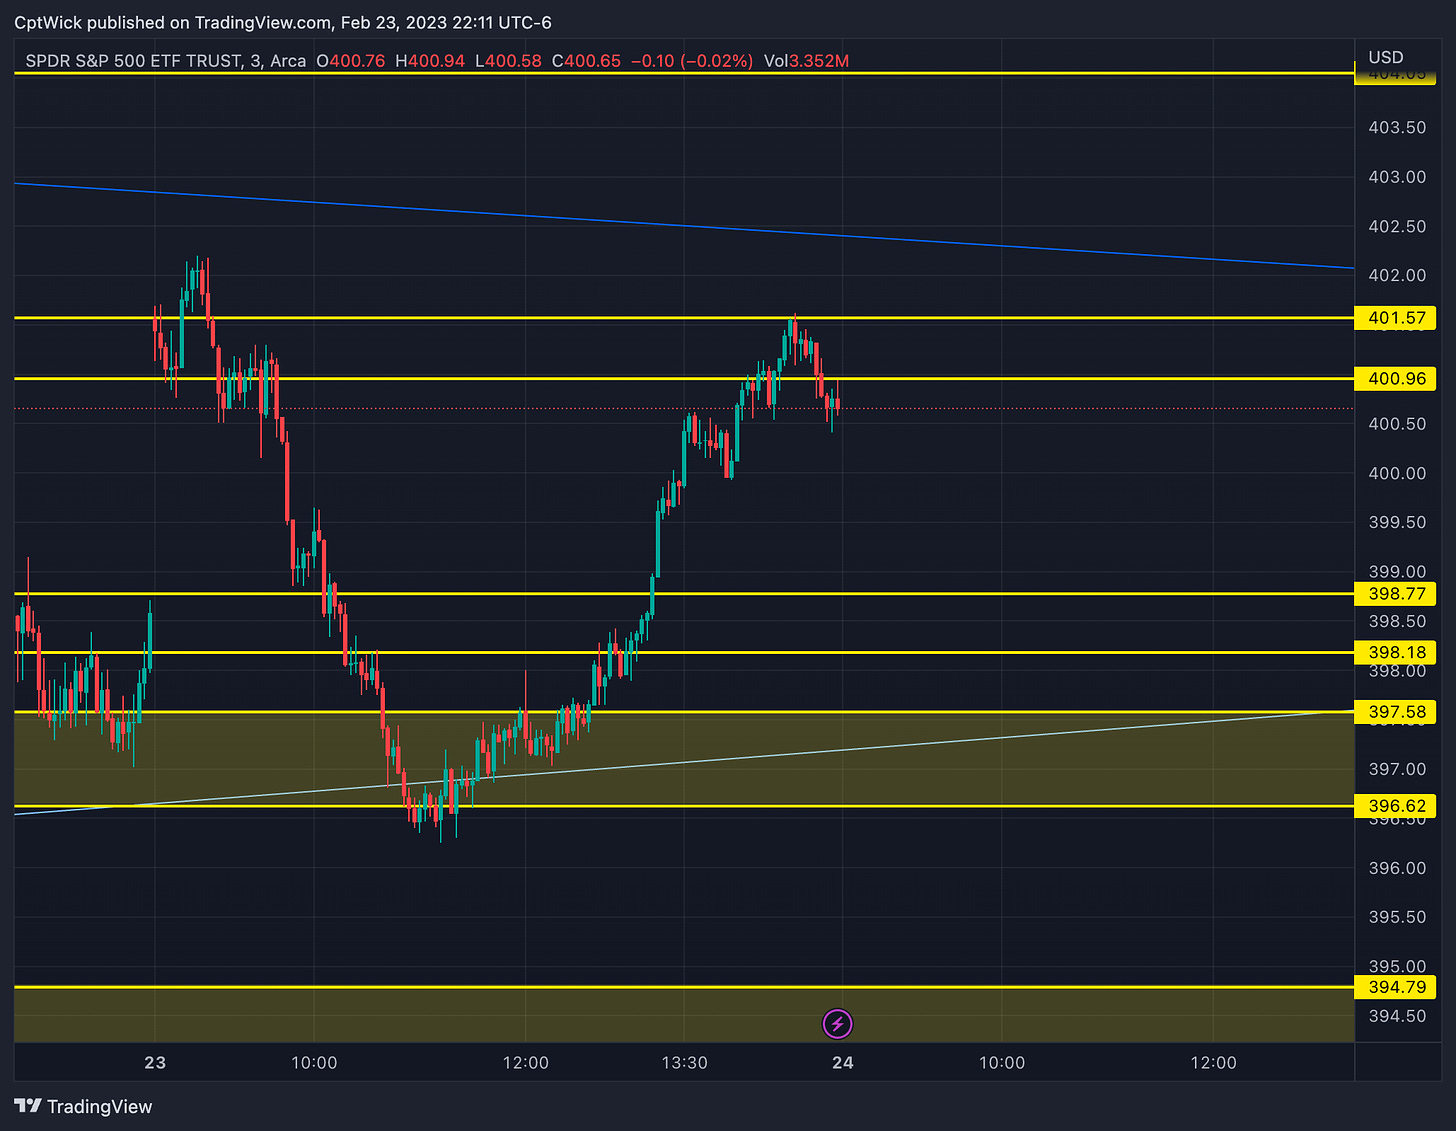
I apologize for not having a trade plan prepared last night, I was on call for work and it got the best of me, I did send a tweet out on twitter here. Key level was 400, we gapped up right into my first bullish target at open but the bulls could not hold, and it was a pretty easy read for a put position on the bear flag at 401. We then sold off down to my highlighted demand zone that we pinpointed with the volume profile analysis. I don’t just make up these levels/zones, there is a rhyme to the reason. We rallied strong out of this demand zone right back to my first bullish target. Insane day, congrats if you made money today! If not, shoot me a DM on twitter, I would be happy to help! Lets get into tomorrow!
—2/24 Pre Plan—
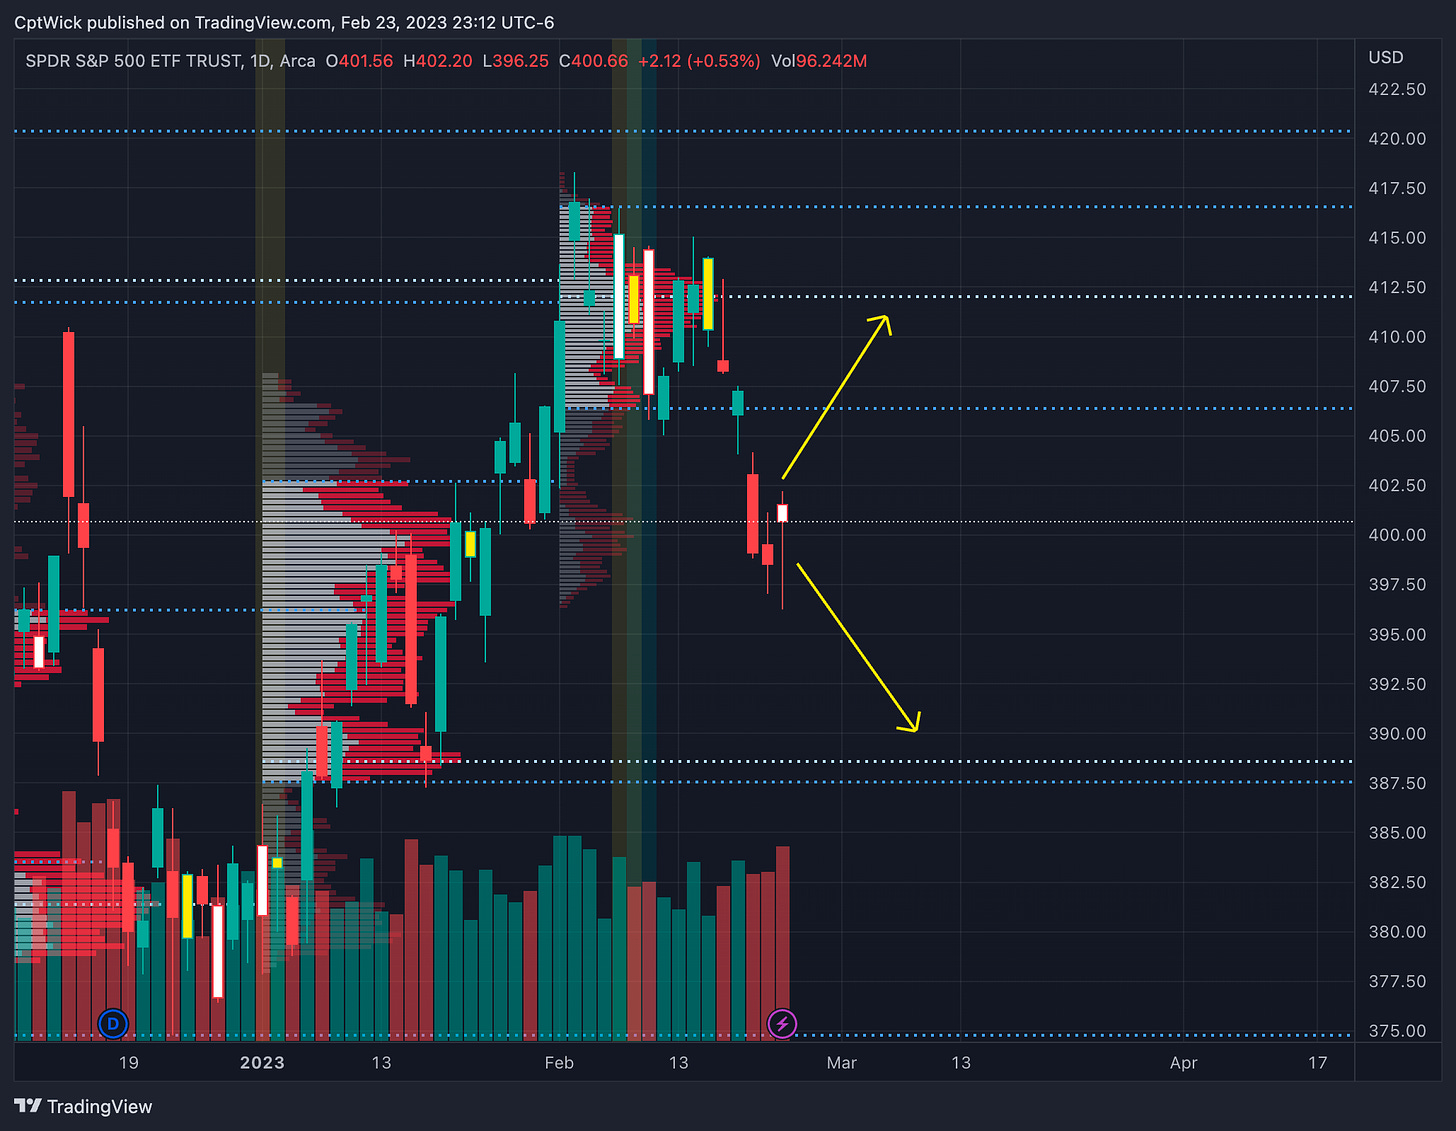
When we look at the volume profile on a larger timeframe, I will show you what I am looking in terms of future targets.
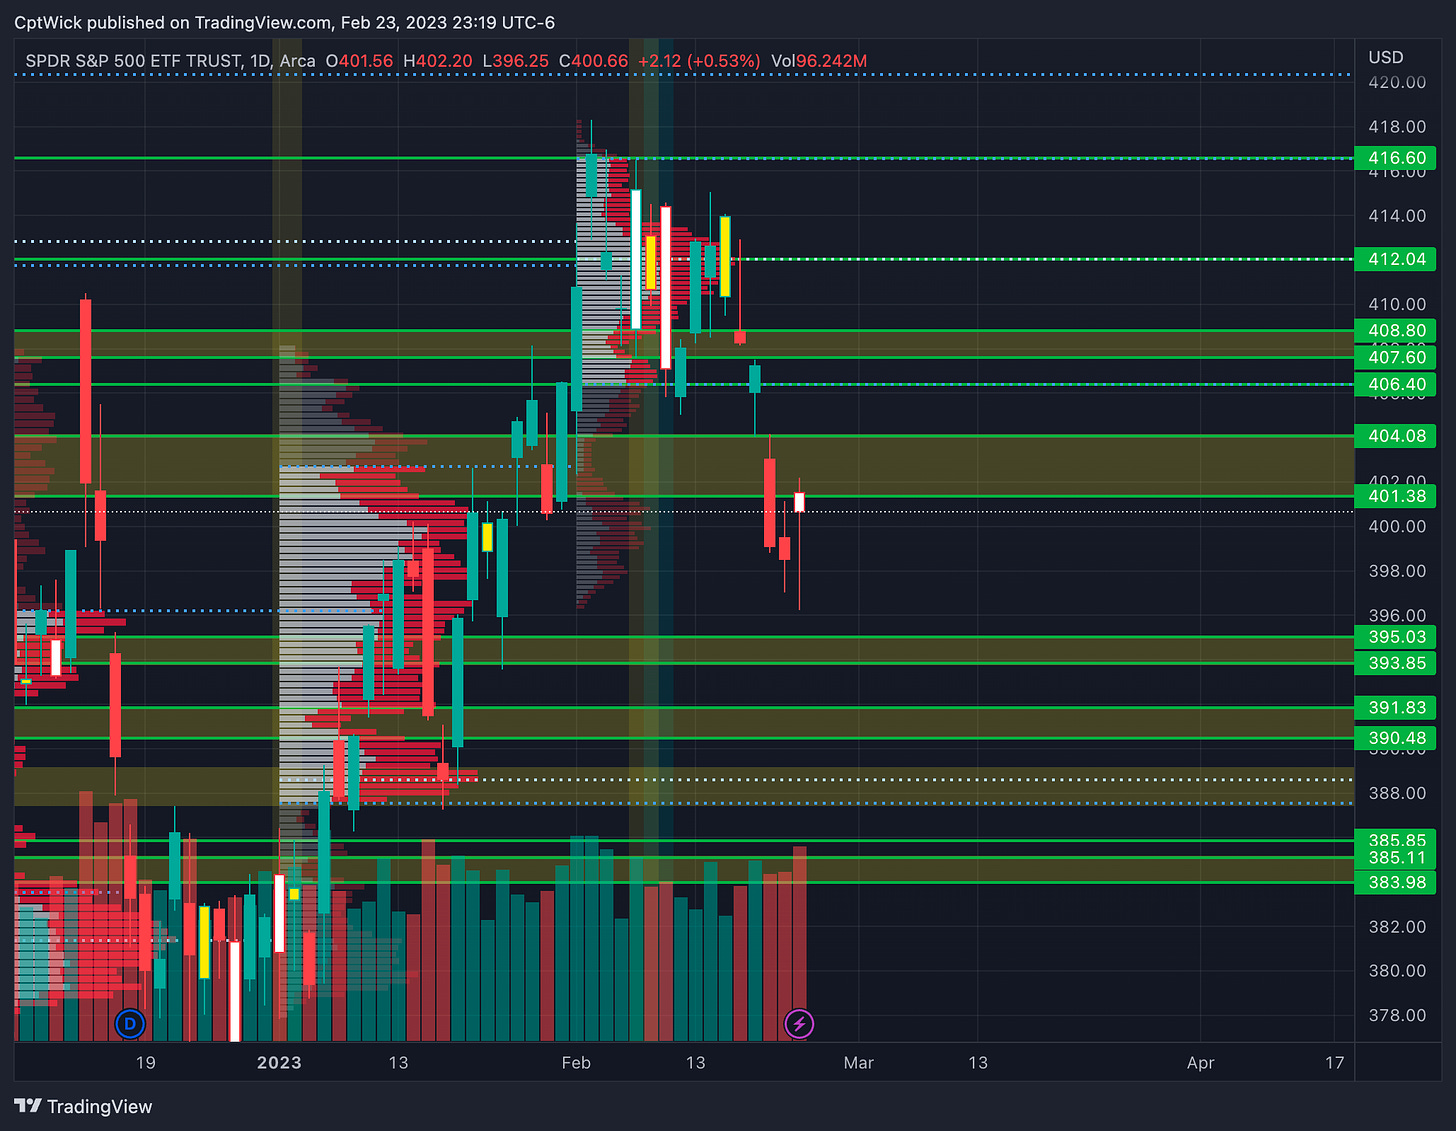
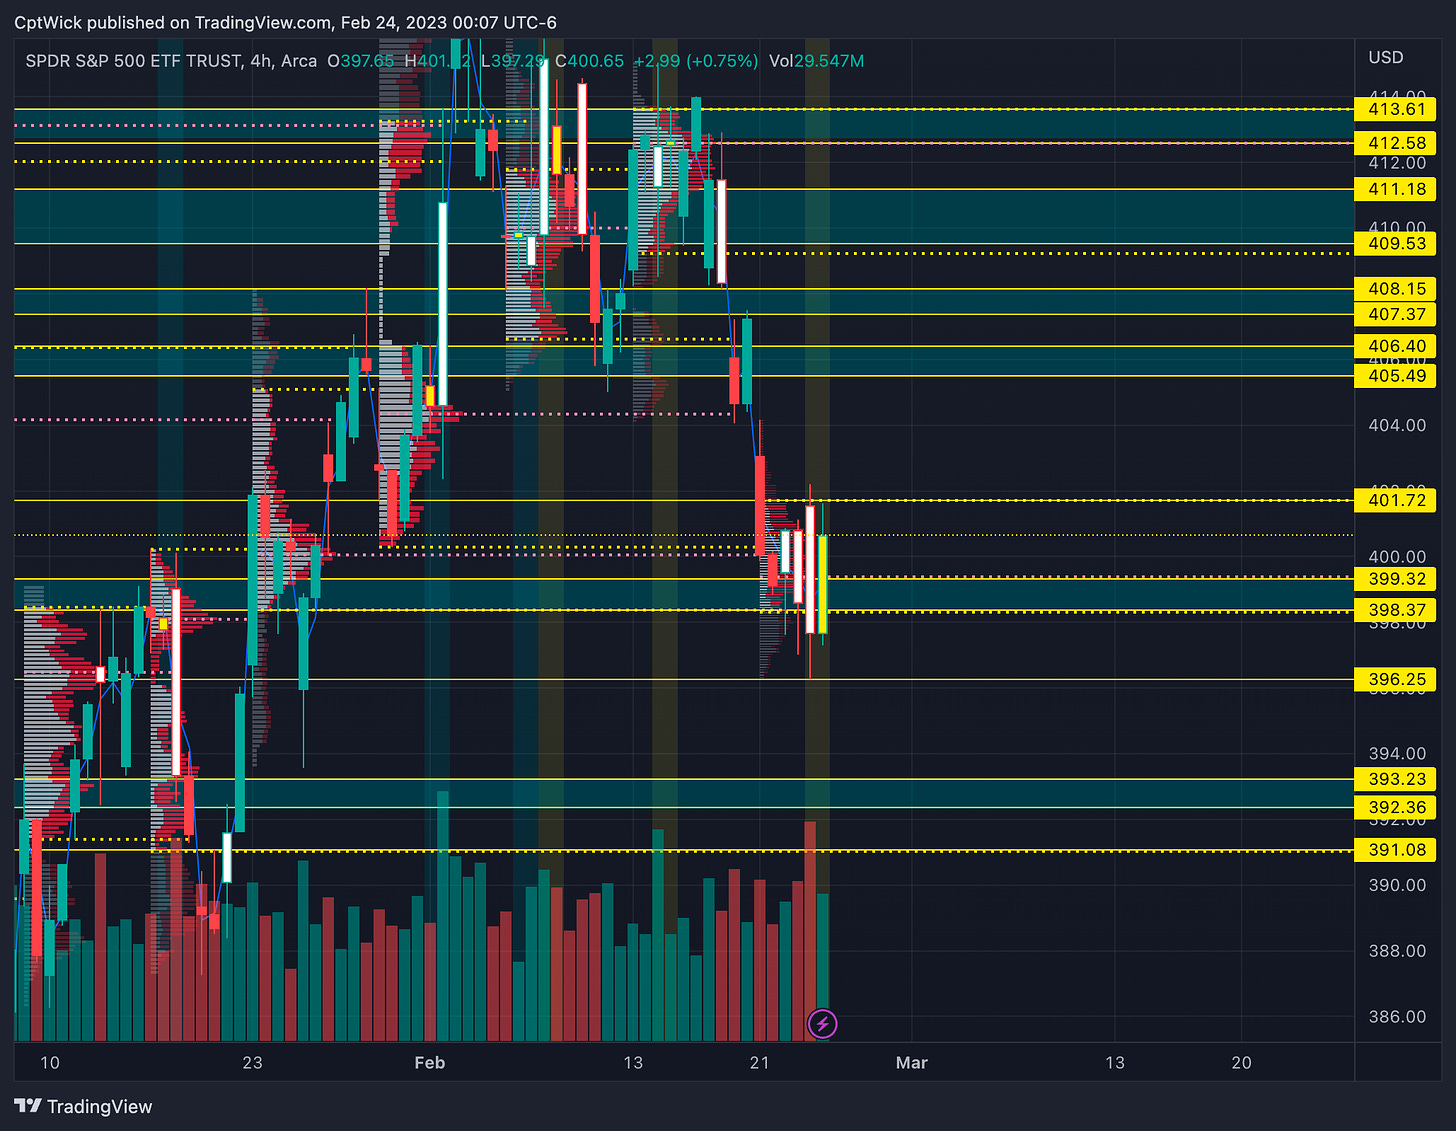
Currently we are at a monthly imbalance down, we are trading within January’s range but we are below the current months value area low (VAL). I am looking to see if the bulls can bring price back up over February’s VAL for a possible retest of 412 the (POC) or point of control. Or is price going to head for January’s POC around 388. I went ahead and highlighted what I think are the key supply and demand areas based on this chart.
The bulls need to try and fill the volume gap from 401.38 to 404.08, I think that would cause the VAL to shift down strengthening their case and putting them in control. If the bulls cannot reclaim this area I think we will trade 388 sooner than we trade 412.
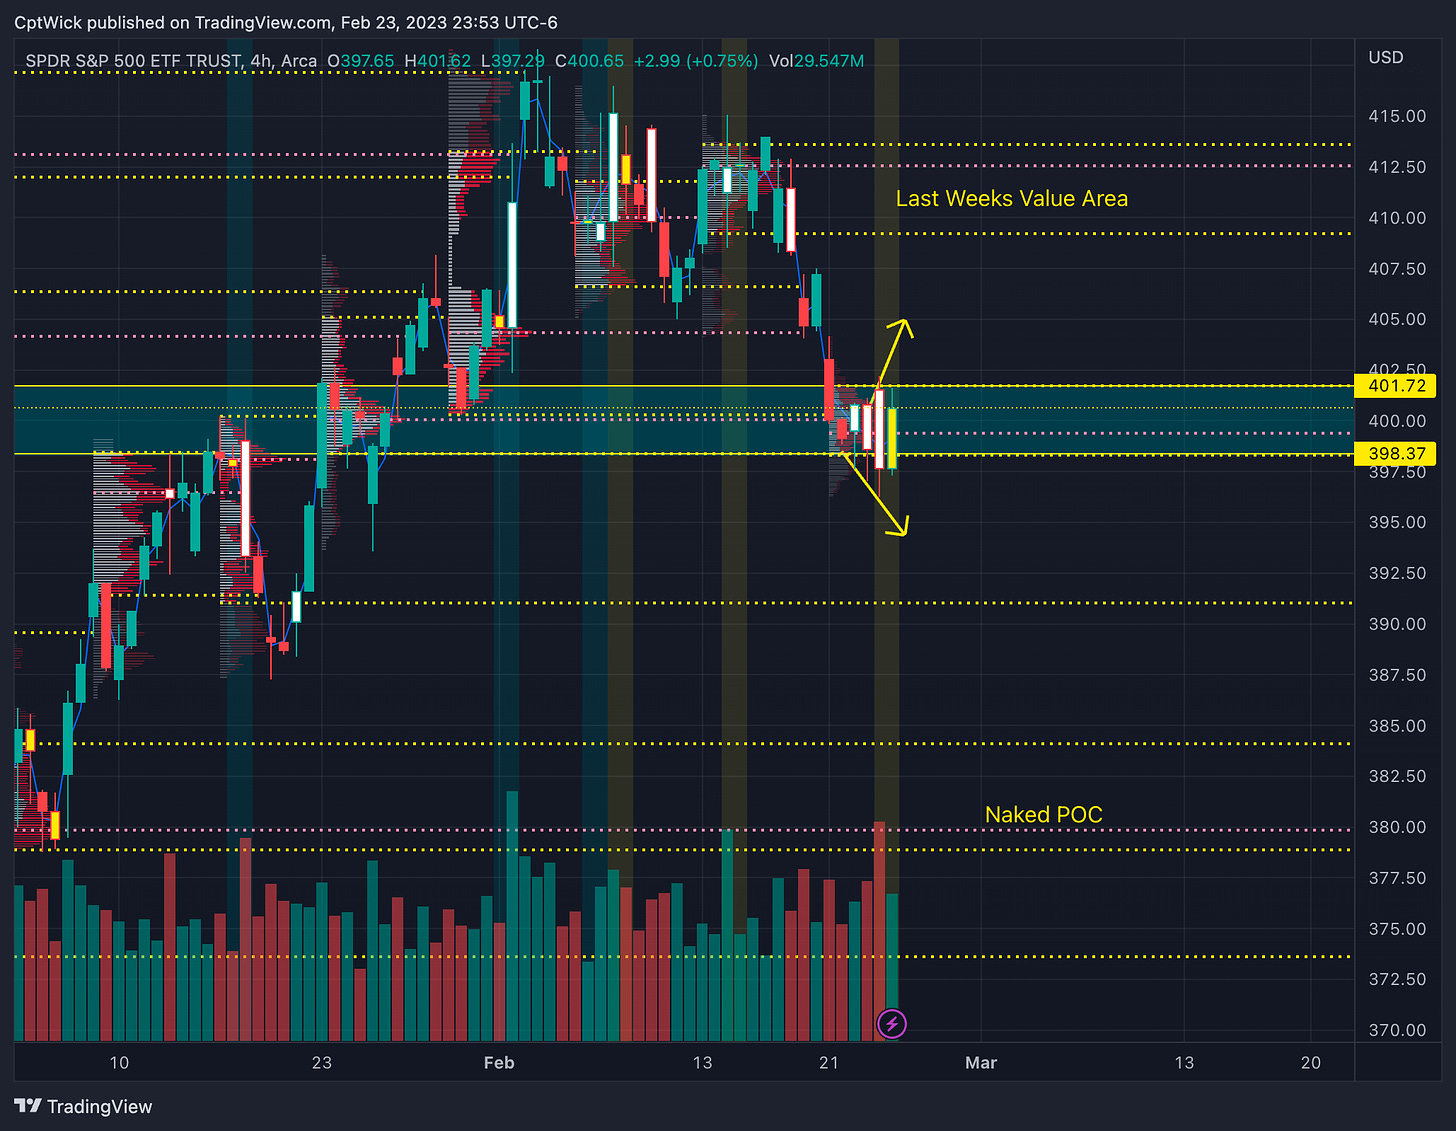
If we do the same process for the weekly profile we can see similar levels. We are just balancing this week here around 400, something that we called out earlier in the week as a likely scenario given how the profile was developing. Bulls need to push up over 401.72 and the bears need 398.37, mark these two levels and watch how price reacts.
I did the same thing on this chart that I did with the 1D/monthly profile. Here is what it looks like.
Think of these highlighted zones as bus stops. If price comes into the zone and bases (meaning it picks up more passengers), watch to see which way it wants to go, does it want to go back from where it came? Or does it want to keep going to the next stop? Sometimes we only pick up a few passengers (this would signal a fast reaction usually forming a wick on a candle), reversing back to a previous zone. Sometimes we pick up a lot of passengers (consolidation) and then push away picking a direction, and sometimes we don’t stop and we miss the stop, if this happens we can usually get a retest or a u-turn back to the stop to pick up more passengers. (DONT CHASE THE BUS)
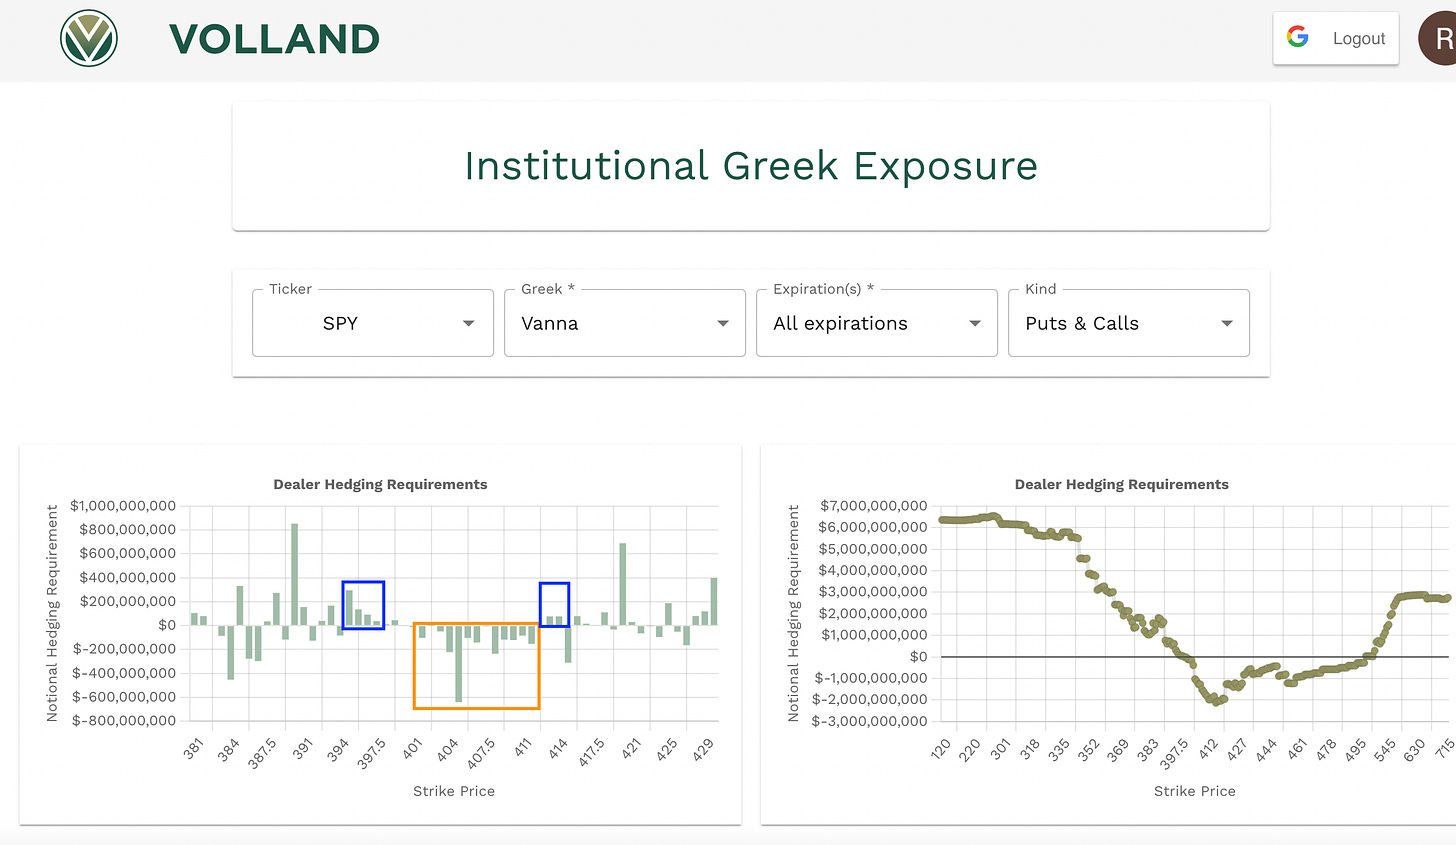
Once we have all of this down we then head over to Volland and grab the data from there. Starting with aggregate vanna we can see that above 400 we have negative vanna all the way to 412 with the larger cluster of positive vanna below us to 395. We can assume that the negative vanna above us is going to be harder to get through at current IV ranks, which is why we need to watch the VIX for helping us decide what price is going to do. The positive vanna magnet down will be stronger if IV increases, with a chance at 390 which is the strike with the most exposure.
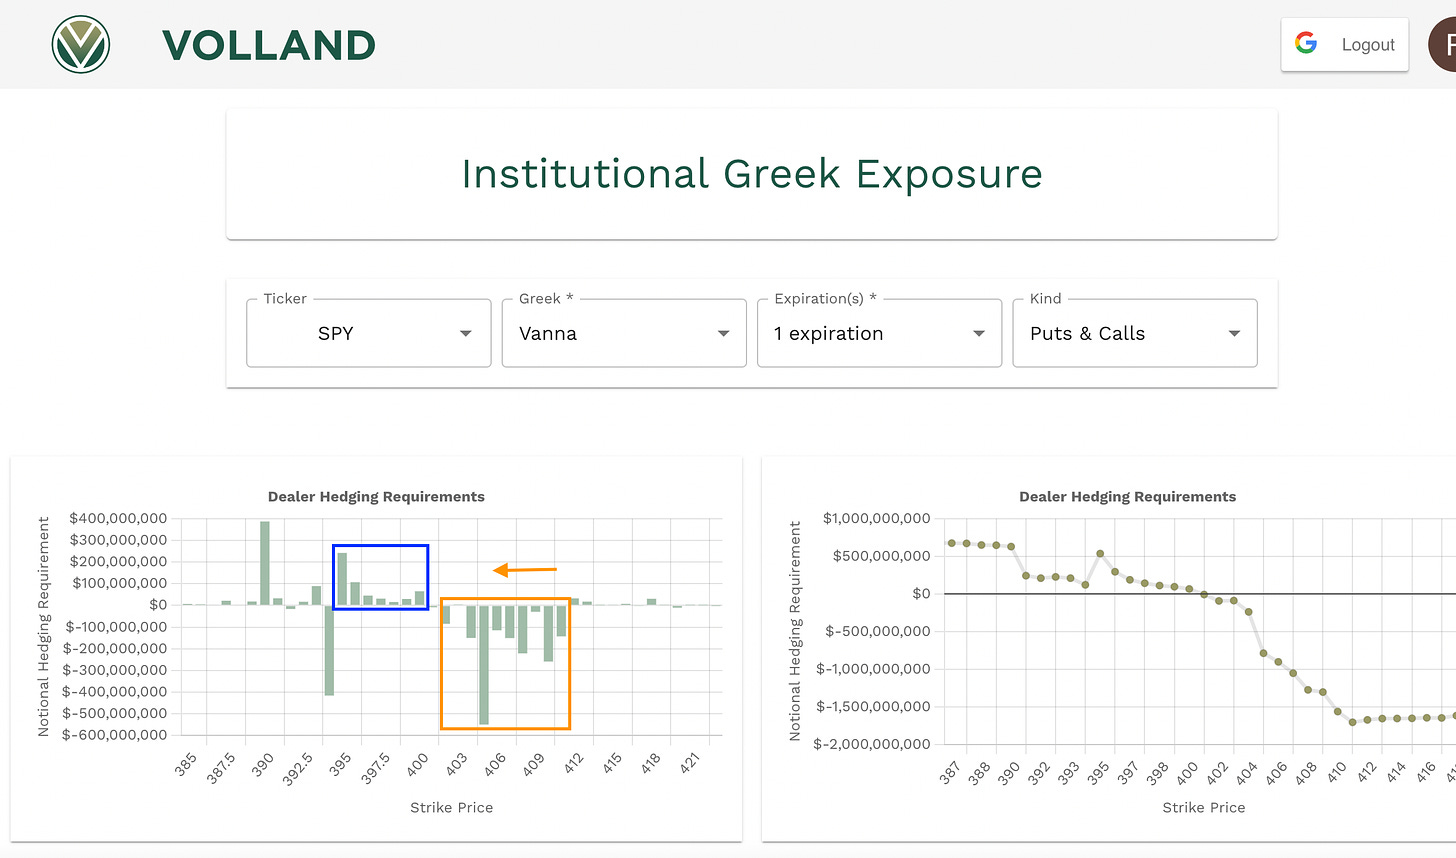
Looking at the vanna for tomorrow we see very similar Information, the negative vanna above spot should act as a repellent pushing price down with current levels in IV, and if price falls, the 395 magnet should pull price down. We also have a larger negative value down at 394, this could be a spot where we would maybe look for a bounce in the underlying.
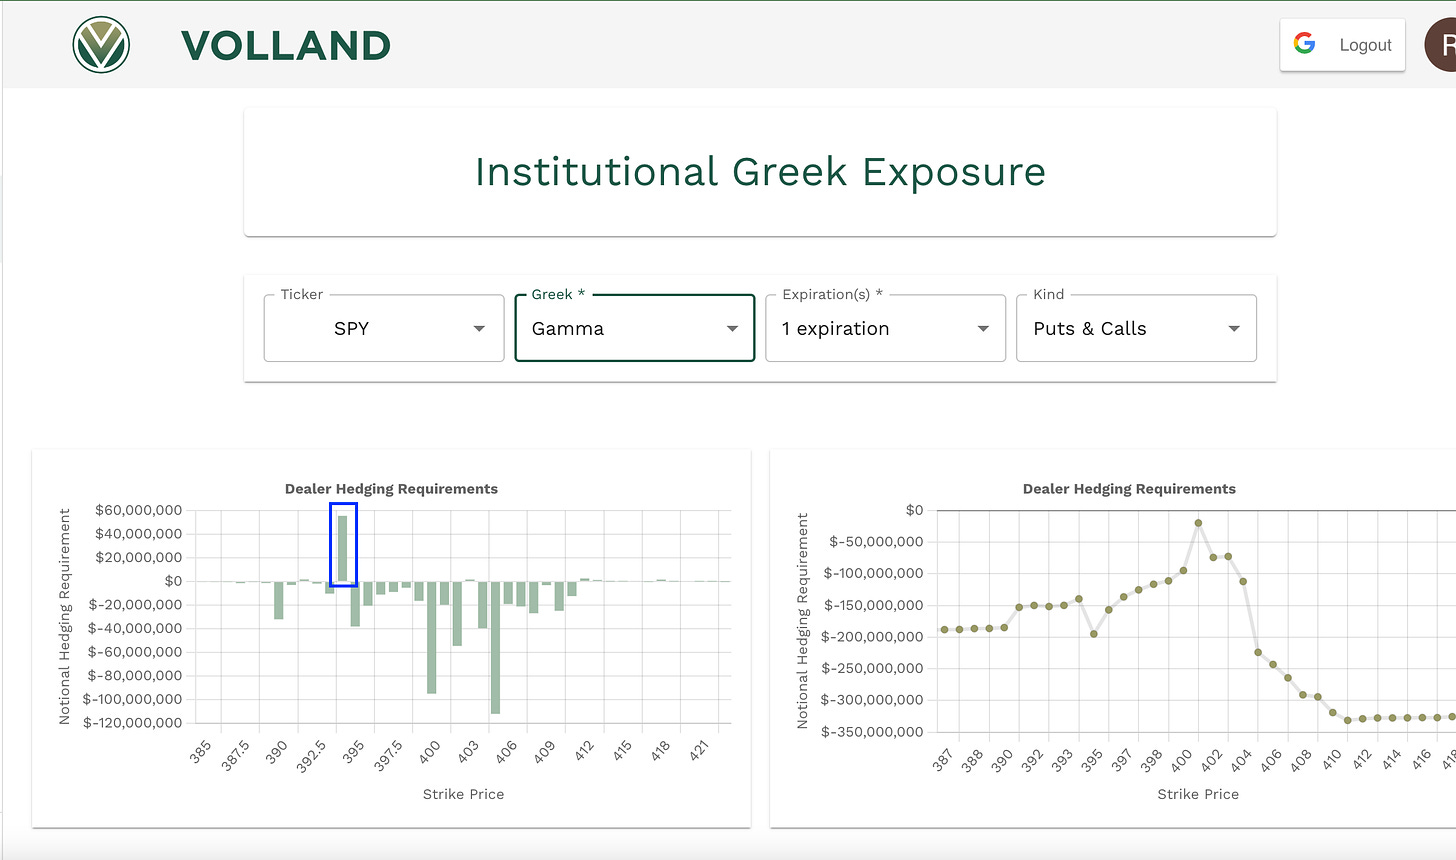
The gamma for tomorrow is also mostly negative with a positive value at 394, this would make a 394-395 bounce a likely scenario, or something that would look for a potential trade idea.
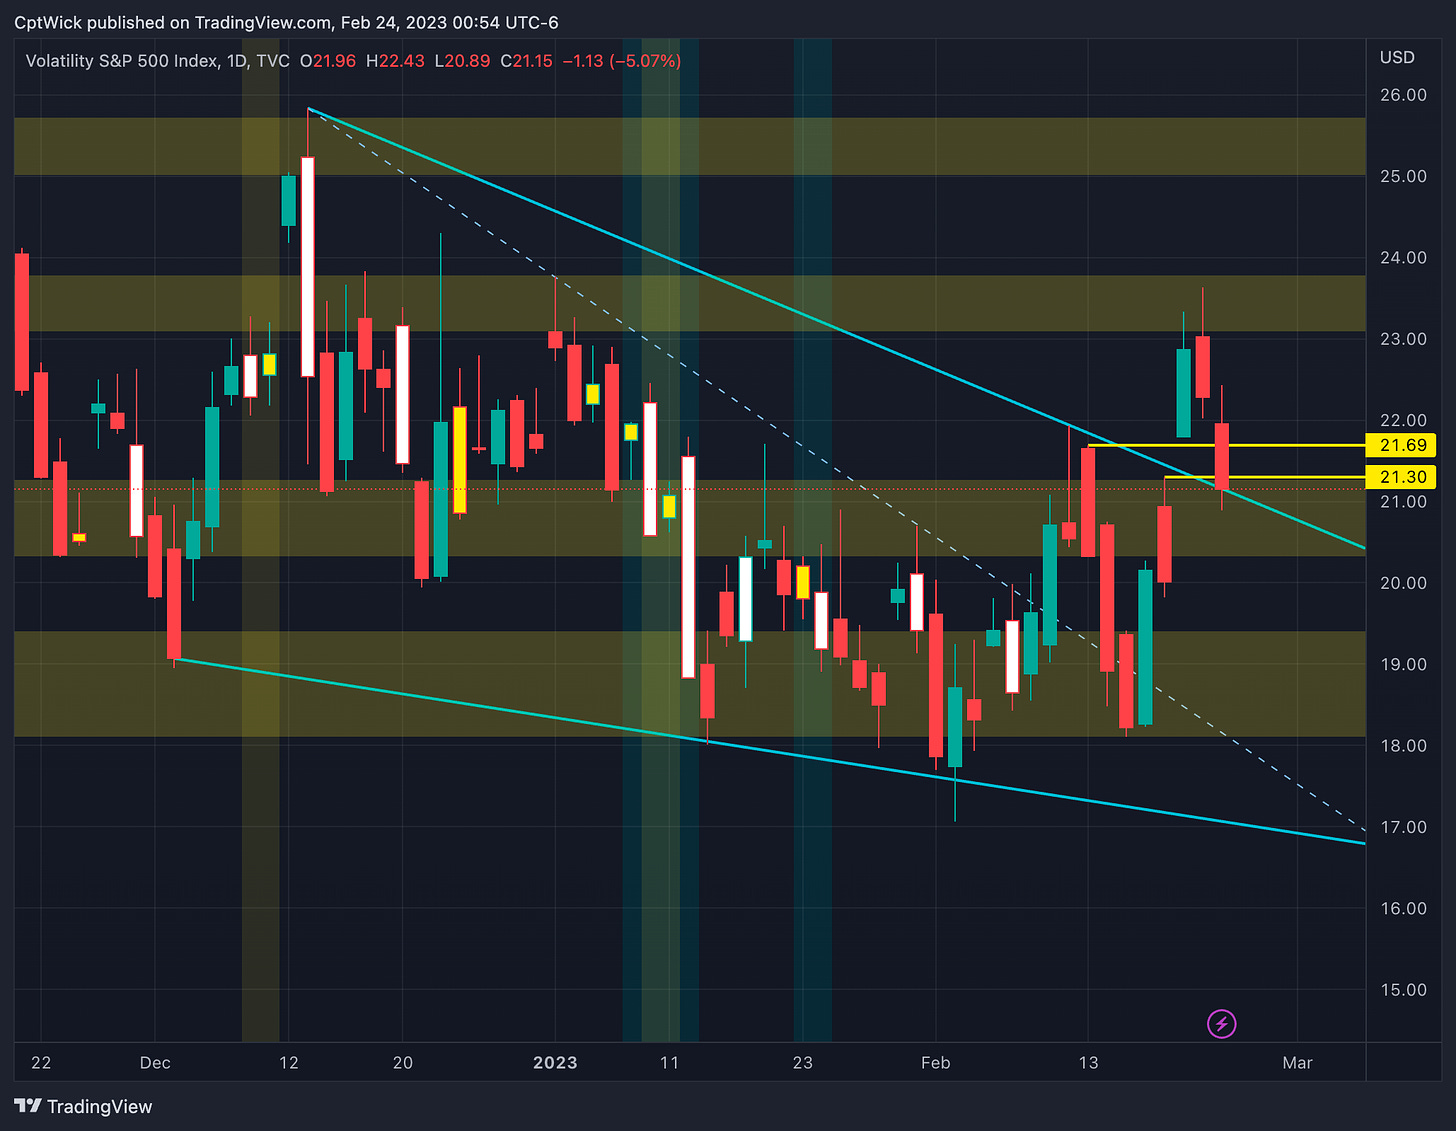
Here is what the current VIX chart looks like, we got the gap fill down that we were looking for and we are also retesting a key level. Do we rally from here on the VIX causing downward movement on SPY? Or do we fall back inside and fall back under $20?
—2/24 Trade Plan—
It’s hard to be a bull right now considering everything that we have looked at, but I am not going to say that we need to trade puts and puts only. We can still rally from here the longer we stick around 400. What I want to see is this, if the bulls can put the pressure on and over take 401.72 and hold I think they can maybe try for 404-405. If price fails at 401.72 (assuming we trade this level) I want to look for a move down towards 395-392. I have to keep the key level for tomorrow at 400, its just massive in the grand scheme of things, If we lose 400 I want to see the bears push past 398.37, under here I think we can go 395-393.85 with a chance at 392-390.
With the positive vanna at 395 and negative vanna at 394, if we trade at these levels I want to look for a bounce play off these levels for a trip back up. Under 393.85 if the bears can keep the pressure on I would look for 392-390.
Above 400 target 401.72, 402.20, 403.15, 404, 405.50
Below 400 target 398.37, 397.30, 396.35, 395, 393.85 (392-390)
Happy Trading,
—WICK—
To cover our basis…
Welcome to my Substack where I provide a daily SPY trading plan to help guide my intraday trading. The purpose of this letter is not to advice you on your trading or investment decisions. I am simply documenting my daily trading plan for myself to help with planning and execution. These are simply my opinions and the data sourced from the likes of vol.land, TradingView, Tradytics and others. The stock market is risky, gains are not guaranteed. This is not about getting rich quick, but learn to educate yourself and make the necessary financial decisions on your own. This is not financial advice.


Excellent as always