Here we are coming to the end of another successful week of trades. Thank you to those who have reached out and shared their own successes trading with our trade plan. Continue to learn and grow as a trader. Reach out with any questions. It is so important you find a partner or partners in your trading journey. They will only help you grow and understand how to navigate these crazy markets.
As I mentioned in yesterday’s trade plan even if we opened green/rallied above 4015-20 I wasn’t going to have a bullish mindset and that I would actually look for a failed breakdown. You can see the trades I took today yielding $2,400 in profit.
From the trade plan:
AND
Now this wasn’t just a guess this was backed with data - factual and no hiding behind the curtain using Volland, OB’s/FVGs, and a trading plan to determine where dealers are positioned and need to hedge and where price may react. This data is not easy to learn and it has taken me many different strategies and methods to finally get to where I am. We will make it together and continue to reach out with any questions.
I enjoy interacting and learning from other traders so continue to share your trades, ideas, and how you use this trade plan by messaging me on Twitter @DarkMatterTrade.
News Catalyst
Lots of news catalysts and speakers for tomorrow…Note that Biden is meeting with the G7 for further Russian sanctions - something beyond economic news data to be aware of.
8:30am est - Core PCE
10am est - New Home Sales
10am est - Revised UoM Consumer Sentiment
10:15am est - Fed Gov Jefferson Speaks - speaking on "managing disinflation"
10:15am est - Cleveland Fed's Loretta Mester speaks
11:30am est - St. Louis Fed's James Bullard speaks
1:30pm est - Boston Fed's Susan Collins speaks
1:30pm est - Fed Gov. Christopher Waller speaks
For more information on these news events, visit the Economic Calendar
SPX Notes:
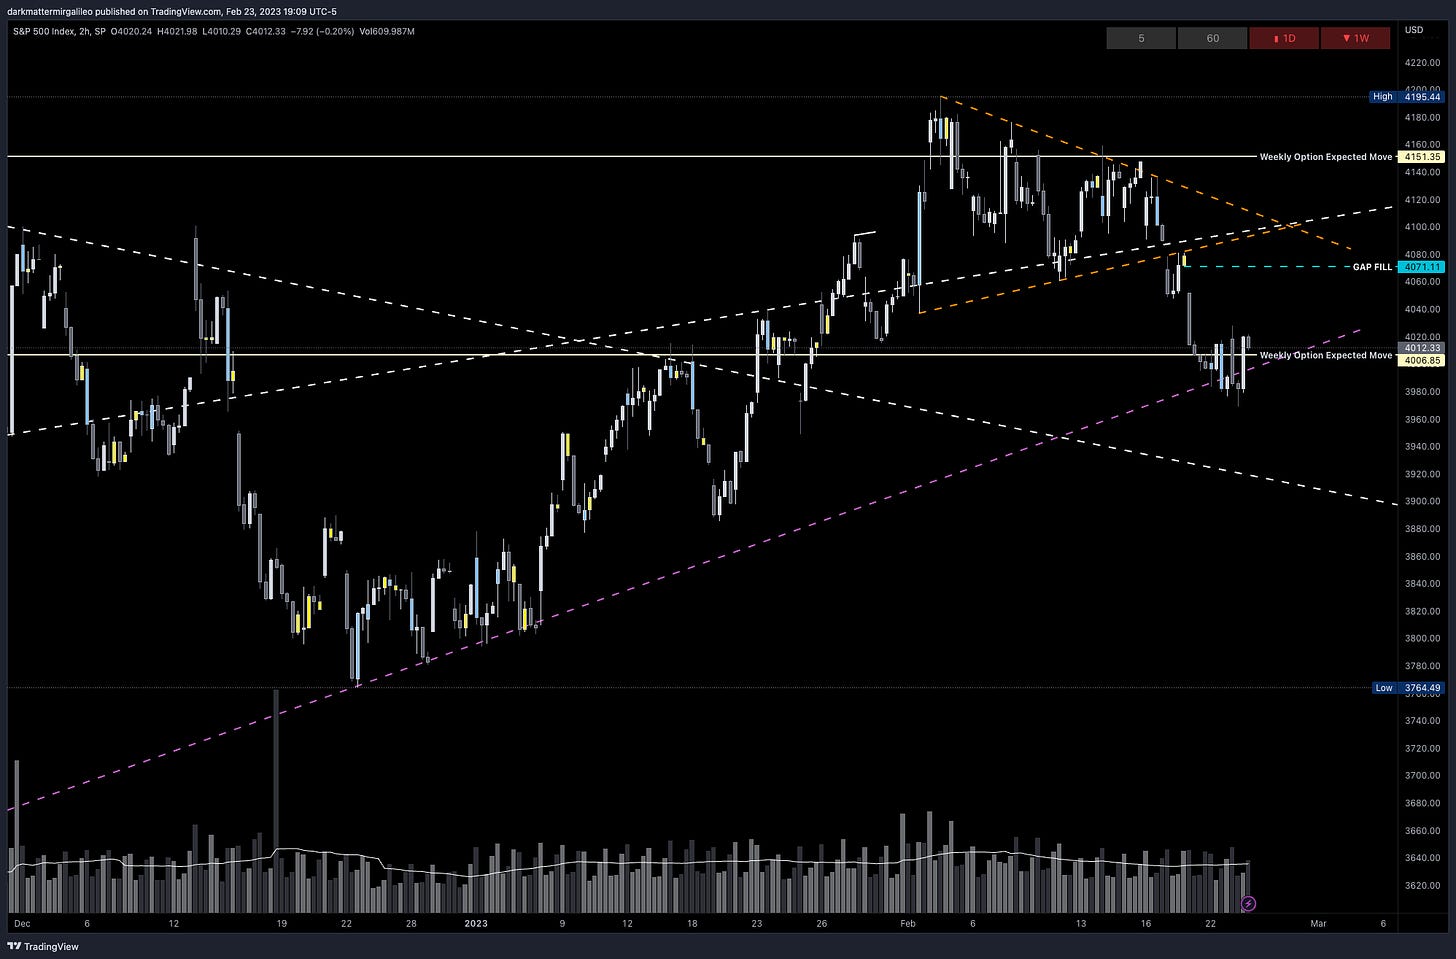
No major updates to our trendline besides breaking below the October 2022 low trendline and then rallying back above it. This is the trendline on watch now…See item 3 below
Orange - We had a failed breakout of the wedge and then a breakdown below with a test of this wedge come at the close of Friday’s (2/17) session
Blue - This trendline was broken at FOMC around 4093/95, but have now broken below it. Will this act as a key resistance line?
Purple - This trendline is from our October 2022 lows - We broke down from this trend, but closed above it. This is the trendline to watch.
White - this is our trendline from the Covid 2020 low - currently price is below it and could be another key area of interest for the bears
White - this other white line I am going to bring back which is the down trendline from the ATH’s in January 2022 that we broke in this recent rally
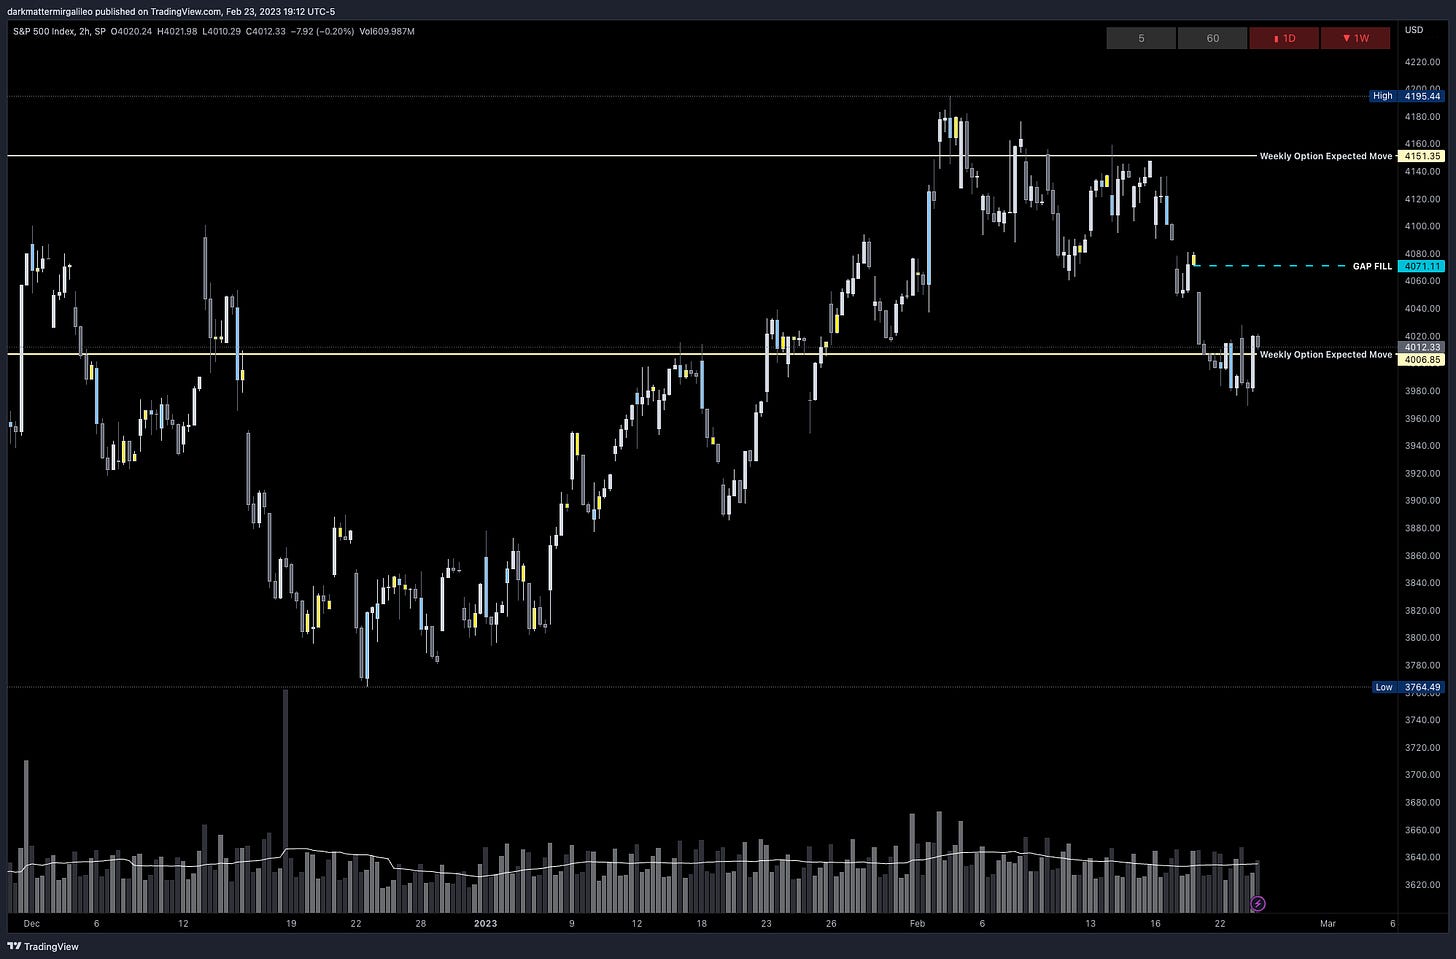
We do have a gap to fill to the upside in that 4071 level
Weekly Option Expected Move
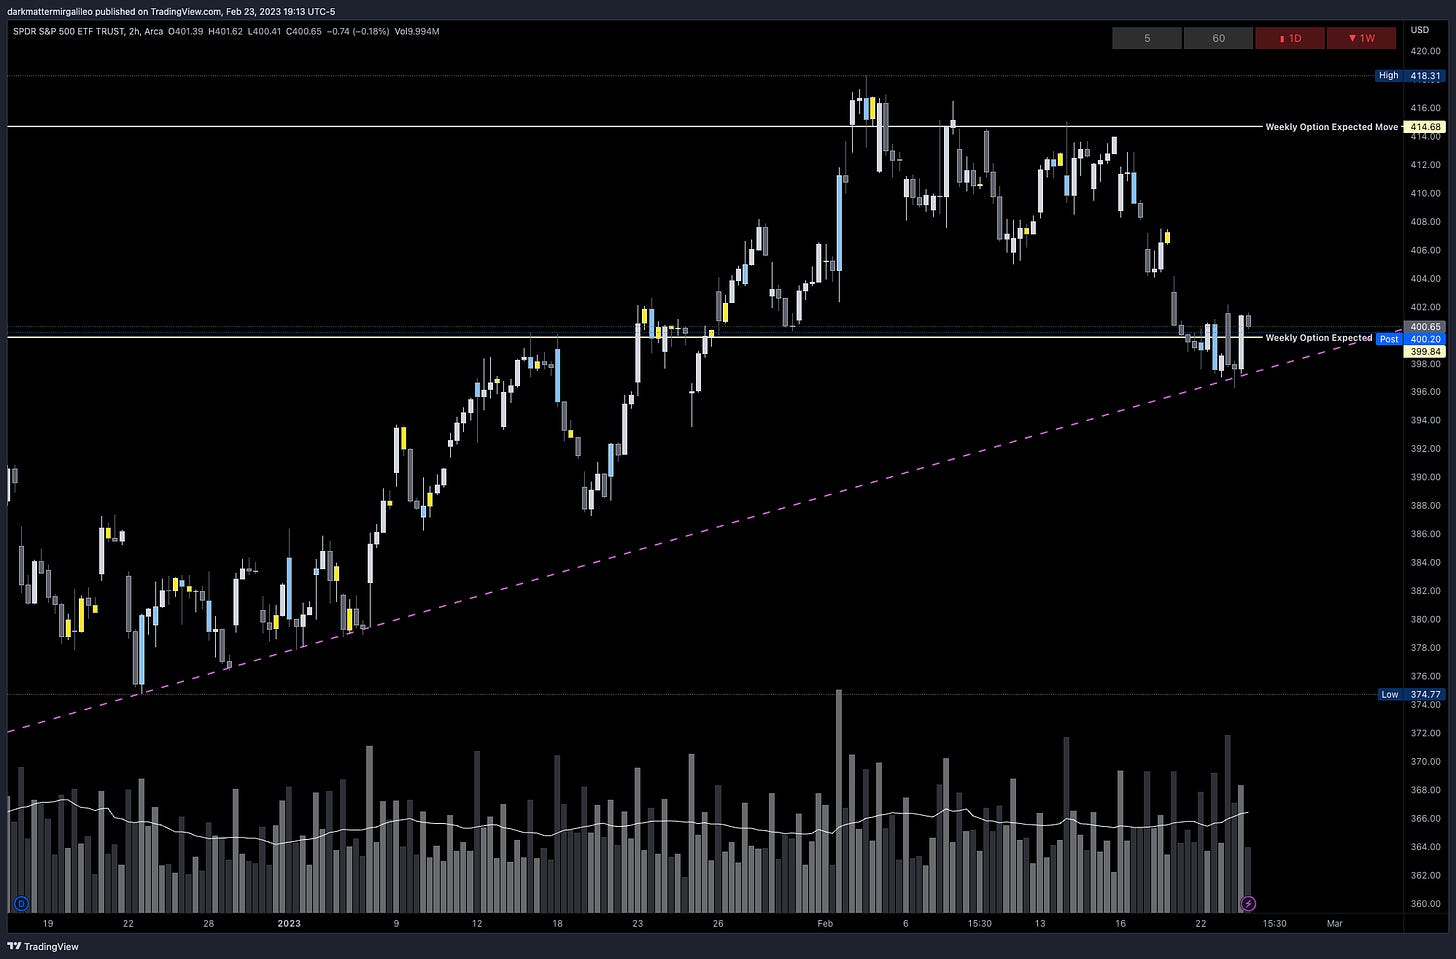
We dipped below this level again only for the bulls to come back and push us back within the range. I am really intrigued to see where we close within this expected move.
SPX’s weekly option expected move is ~72.25 points. SPY’s expected move is ~7.42. Remember over 68% of the time price will resolve it self in this range by weeks end.
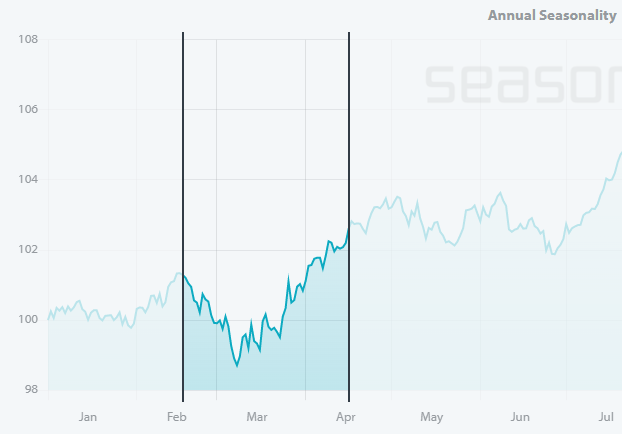
The other item I wish to draw your attention to is the seasonality flow of the market. Typically - as we see in the below chart - the 2nd half of February and leading into the first half of March tend to be more bearish than bullish. While I think tomorrow we could see more downside, don’t be surprised with a rally. I wouldn’t be shocked if we gap down tomorrow if that sparks a rally.
Again, let’s not predict, let’s jump into the data and build a trading plan reacting level to level.
SPX/ES/SPY Trade Plan:
Remember you can use this SPX trade plan to trade ES or SPY.
Bullish bias:
If there is a failed breakdown at 3985 target 4000
If there is a failed breakdown at 3965 target 3980 then 4000
If there is a failed breakdown at 3945-40 target 3960 then 3975
I would be cautious of any longs above 4015, max 4030 - IF we were to even get there - the R/R is high risk and not worth it
Below 4005 target 3985
If there is a failed breakout above 4005 or 4015-20 target 3985
I would only take this trade if it were to happen in the first hour of trading
If there is a breakdown of 3980 target 3965 then 3945
Vol.land Data
For a better understanding of the various greeks below I would suggest you visit the Volland YouTube Page. Volland provides unique data showing where dealers are positioned providing in my opinion a higher degree of conviction to where price may move to.
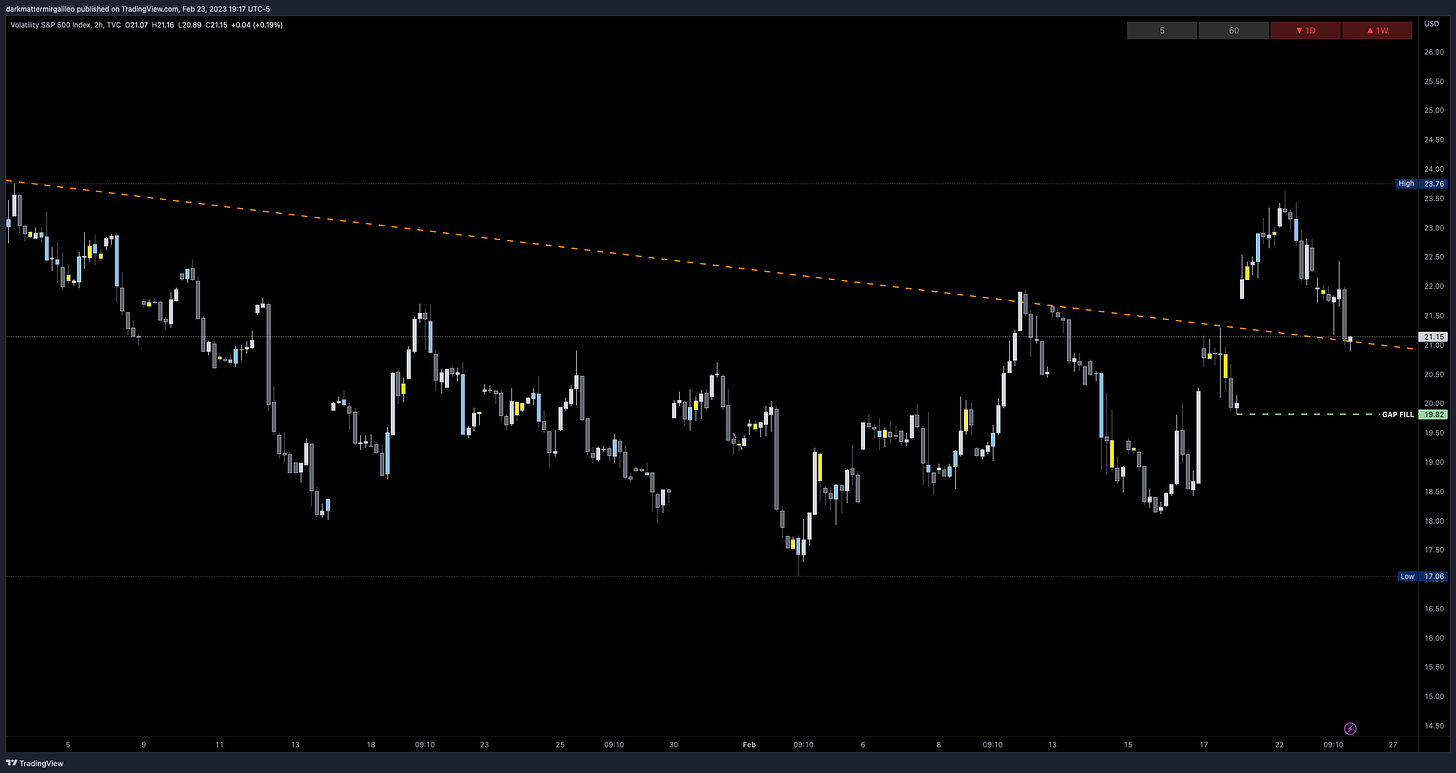
Here is our VIX update. We got exactly as we wanted with VIX closing the daily gap. We did rally from this even breaking below the trendline, but closing above it. What I am interested in seeing is VIX can continue to go up or will it seek to close the gap left behind as seen on the 2HR chart below. If it chases that gap fill expect the market to go up then.
Vanna - Levels where price may repel or act as magnet
Remember for price to go above spot through a magnet or repellent VIX and IV must decrease or stay flat. For price to go below spot through a magnet or repellent VIX and IV must increase.
Above Spot:
4015-4030 is a cluster of negative vanna - acting as a repellent
4030 is our largest negative vanna in this cluster - similar to today
4035 is a minor positive vanna - acting as a magnet
4040-4060 is a cluster of negative vanna - acting as a repellent
4050 and 4060 are the largest negative vanna’s in this cluster
4065 is a major positive vanna - acting as a magnet
4075 is a major negative vanna - acting as a repellent
Below Spot:
4000 is a major positive vanna - acting as a magnet
3985 is a minor negative vanna - acting as a repellent
3975-65 is a cluster of positive vanna - acting as a magnet
3960 is a minor negative vanna - acting as a repellent
3950 is a minor negative vanna - acting as a repellent
3945 is a minor positive vanna - acting as magnet
3940 is a minor negative vanna - acting as a repellent
Our range could be 3965-4030
Vanna shows us that we have a higher pull to the downside than the upside with 4000 being a critical level
Hard to see how Vanna takes the bulls above 4030
Gamma and Delta-Adjusted Gamma (DAG)
Above Spot:
4035 is positive Gamma - acting as resistance
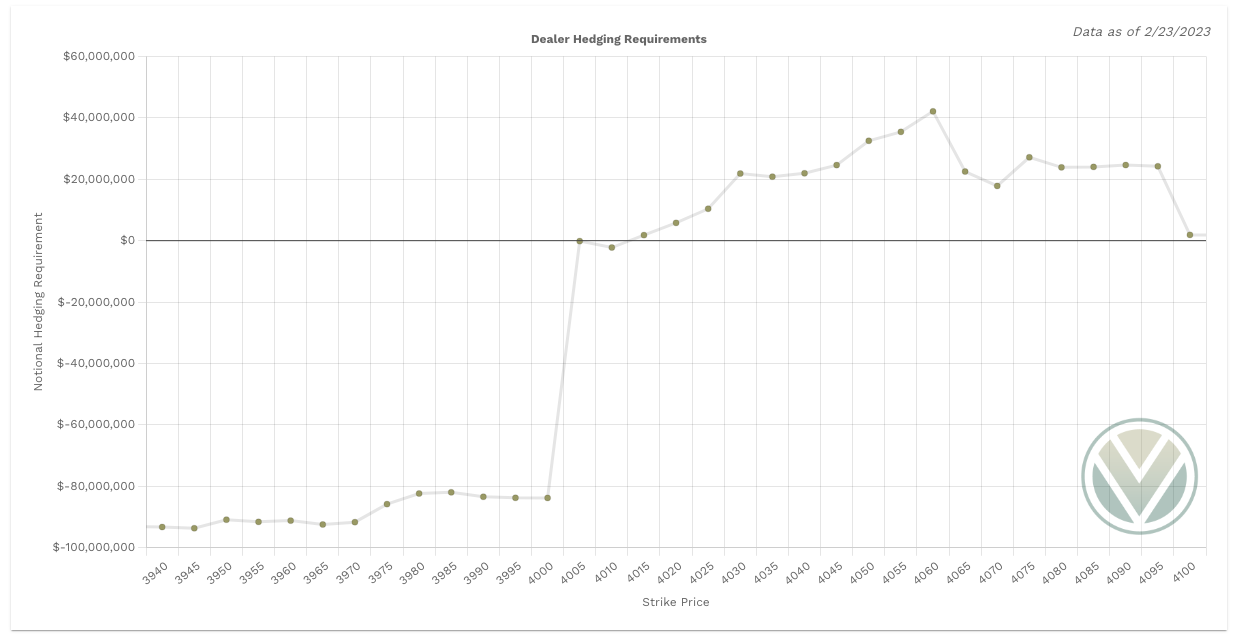
4015-4030 is a cluster of negative Gamma - should price float through these levels consider a snapback or rubberband affect taking it back to the largest negative Gamma sitting at 4000
Price above 4015 will increase dealer buying pressure to allow the dealers to hedge - again it is not a large amount so won’t have a major impact if it were to happen
Below Spot:
4005 is positive Gamma - acting as support
3985 is positive Gamma - acting as support
3960 is positive Gamma - acting as support
3950 is positive Gamma - acting as support
3925-10 is a cluster of positive Gamma - acting as support
Price below 4000 will increase dealer selling pressure
4035 will be a major barrier to get past for bulls
3985 is a major level and if lost takes us towards 3965
There isn’t anything significant besides the negative 4000 gamma that continues to whip price up and below it
Final Take
I think we could have another kangaroo like trading day where price floats one direction, reverses for 30pts and then reverses. So one thing I want to be mindful is a reversal of today’s action - should we gap down and continue to sell in the first hour, potentially see if 3985 or 3965 levels come to play and if price reverses from it.
Stay #paytient and react to the key levels - no predictions! Good luck traders.
I am going to share my key rules to intraday trading in the end of the plan moving forward to build better habits and allowing you to grow as a better trader.
My Intraday Trading Rules
I do not trade within the first half hour UNLESS I am in a trade from the prior session and looking to close the trade or we have a major gap or a key level already broken
I let the initial balance do its thing - I am just a small fish in a large ocean of traders so let's let them fight it out
I then wait for key levels targeting one level to the next and taking profits at each one.
If there are key levels that are 10pts apart that is when I have scalping mindset and anything above 10pts I want to give it the room to hit the price target with a 5 pt buffer to take profits once we reach within 5 pts of a target - I also tighten my stop loss once at 10-20% profit with the goal of never allowing trades to go red when I have a nice profit)
I supply options greeks with OB (order blocks) and FVG (fair value gaps) otherwise known as Smart Money Concepts
When I am scalping - ie targeting 10pt trade levels I will take profits and never go more than 10% red. Simple as that, know your trade plan strategy and the risk. When you are wrong you are wrong and reset
For 20pt trade level targets I will increase my stop losses to 20% and allow more of the trade to play in the event I entered too early
I try - key word try ha - avoid trading lunch hours defined as 12pm to 2 pm est. Money for the most part unless you are scalping - is made in the first 2 hours of the trading day and the last 2 hours
I always stick to two EMA’s on my chart and that’s the 10/50 EMA’s
When the 10ema is above 50ema we are bullish
When the 10ema is below the 50ema we are bearish
Go put these on your charts and when you view them on timeframes less than the daily timeframe you will see the power they provide
For scalpers out there the smaller timeframes provide great opportunities to scalp 5-10pt moves
There are more we could discuss including volume profile, low volume nodes that I think are great strategies to compliment option greeks. Maybe in the future we can include more details.
Trading is not for the unprepared. It is critical you abide to a strategy and checklist and walk into every trade with a plan. Without a plan you are simply gambling and have a better chance at the slot machines. There are more nuances to my weekly and daily checklists, but I think this provides a good read for now and we will/can continue adding to it.
To cover our basis…
Welcome to my Substack where I provide a daily SPX trading plan to help guide my intraday trading. The purpose of this letter is not to advice you on your trading or investment decisions. I am simply documenting my daily trading plan for myself to help with planning and execution. These are simply my opinions and the data sourced from the likes of vol.land, TradingView, Tradytics and others. The stock market is risky, gains are not guaranteed. This is not about getting rich quick, but learn to educate yourself and make the necessary financial decisions on your own. This is not financial advice.


