2/21 - 2/24 SPY Weekly Plan
Short week! (2/21 Plan is at the end)
Readers,
I hope you all had a pleasant and stress-free three-day weekend. As we begin this shortened trading week, I'd like to share with you what I'll be focusing on, and conclude by outlining my plan for tomorrow. So without further ado, let's dive in!
— Weekly Pre Plan—
To start off, let's take a closer look at the volume profile on a larger timeframe. It's evident that we wrapped up the previous week with a monthly downside imbalance, located beneath the current month's Point of Control (POC) at 408.30. This holds a significant interest for me because recapturing this level could empower the bulls to push the price back up to the 412-415 range and even revisit August 2022's Value Area High (VAH), situated just above 420. However, failure to remain above the Value Area Low (VAL) could result in a drop towards January's VAH around 402.50. This area is a key level as it has been tested before and maintained. Furthermore, January's POC and VAL are situated at 388.50 and 387.50, respectively, and could act as significant support if the price continues to fall.
This is an excellent illustration of why these levels can be effective. As we can observe, a naked Point of Control (POC) was present at 404 from a prior week, and when the price broke through the Value Area Low (VAL) situated at 406.60, it immediately headed towards that POC. Furthermore, we can see that there was a reaction at that level, and the price bounced back up to the VAL. This highlights the significance of these levels as areas of potential support and resistance.
We can use this information to help build a plan going into the week. If the bulls can push back into that VAL, we can then ride up towards the POC and VAH. If we come into the VAL and we see that price gets rejected, we can then target the downside levels under 404. I will go more into detail later on in this post. This is just here to show you why I look at these levels.
Before I jump into the Volland data I want to highlight two more levels. 414.68 and 399.84. These represent the expected market makers move on the week, according to Thinkorswim the move for SPY 2/24 weeklys is +- 7.42 and based off the close on Friday of 407.26 we are looking at these two levels. Notice how they line up with potential volume areas. Can we close outside what the market makers think? Of course we can but I like to know these levels because they say that 70% of the time we close within this range.
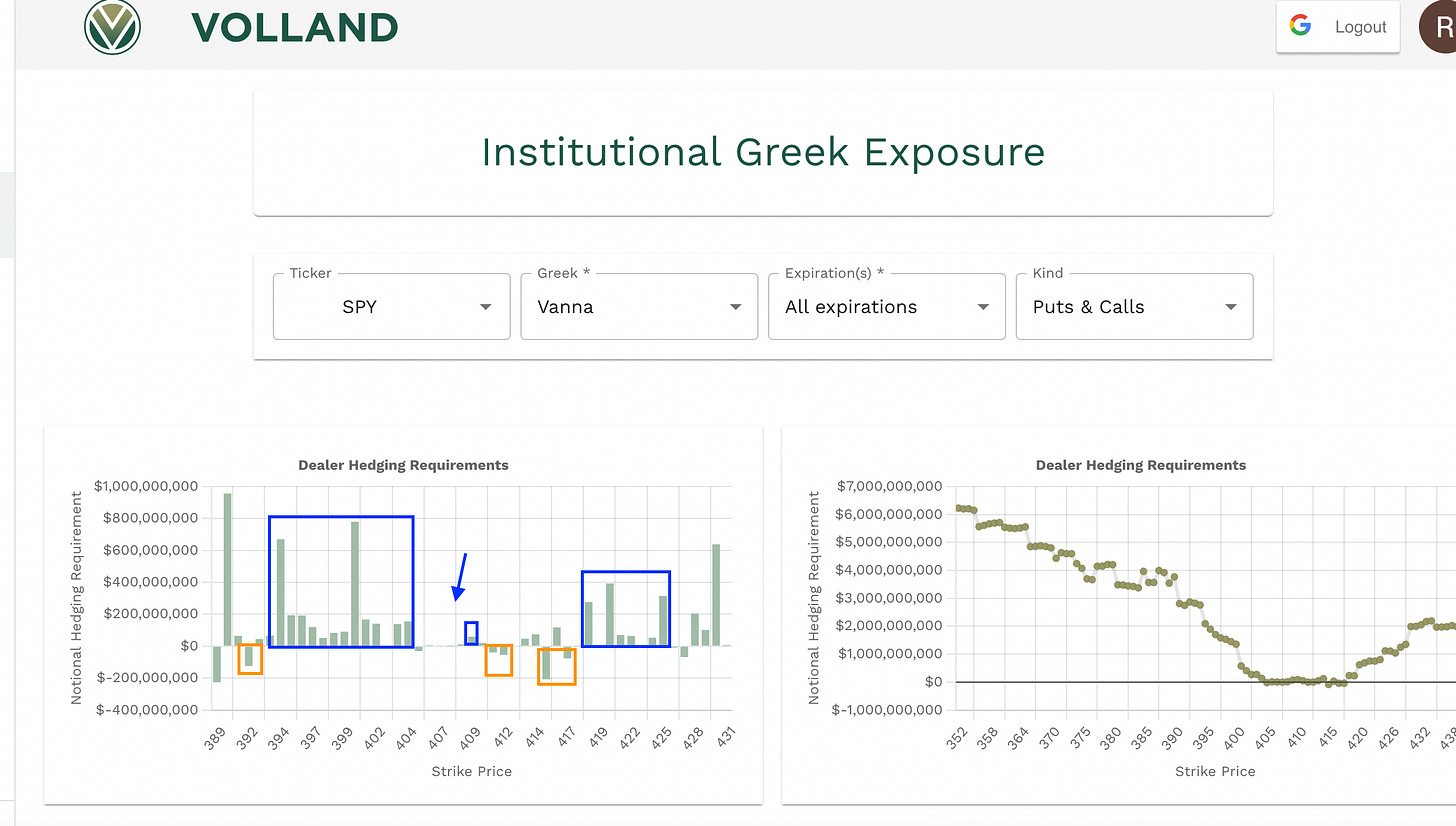
Now lets get into the Volland data so we can try and paint a better picture. First lets look at the aggregate vanna. The blue arrow shows where spot closed on Friday. There is a small amount of negative vanna at 405 and a big cluster of positive below and above 409 we have small amounts of negative vanna with a bigger cluster of positive vanna above 417. Looking at this we can start to think that if the bulls can’t push back up over 415 we could be looking at the positive vanna down under 400 as potential targets, and above 415 we gotta get past 417 at a chance for 420+.
We now want to view gamma to see what is going on with the gap in vanna close to where spot is currently at.
Look at this chart above we can see that the current area is positive gamma, 405-409. I would be interested in shorts under 405 and longs above 409, but we also have to take into consideration the negative vanna at 411-412 and at 415.
—Weekly Plan—
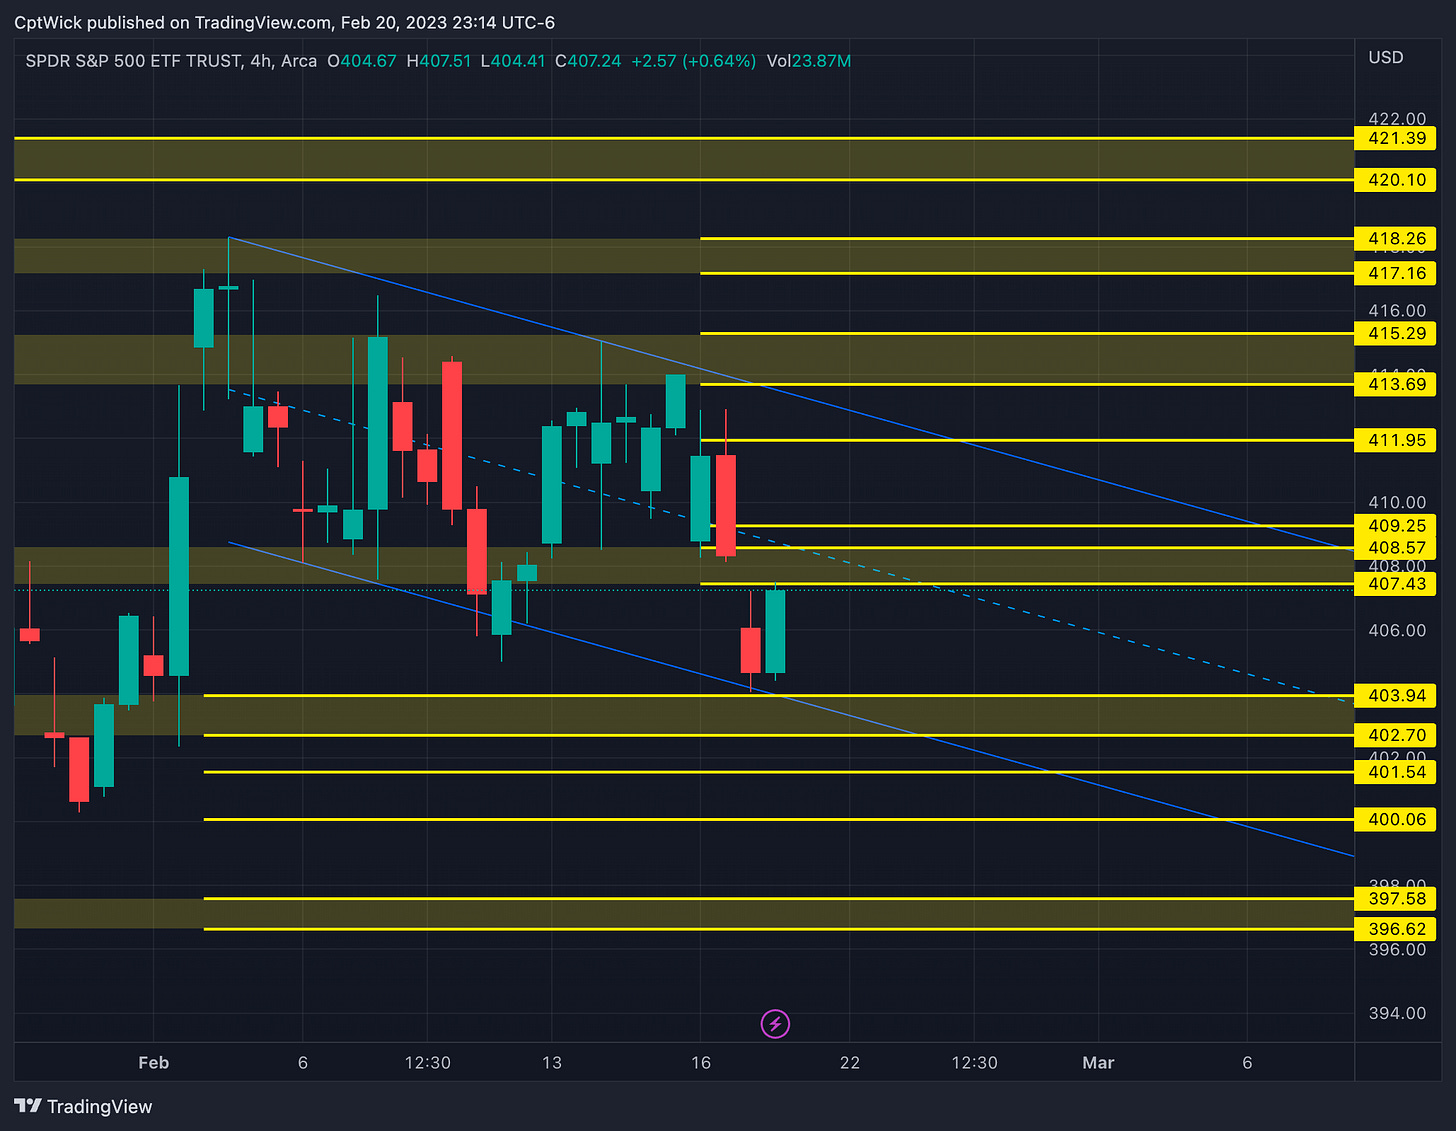
After analyzing the volume profile and reviewing the Volland data I have marked these key levels on my chart as areas of interest.
You can also see that we are respecting this channel, we have a demand zone at 404-402.70 and we have supply at 407.43-409.25. If the bulls can reclaim 409-410 I think that we can see 412-415 and above 418.26 we can see 420+, we do have the negative vanna up around these supply zones so we need to keep an eye on IV or the VIX if we approach these levels, and if we pass through them look for a retest for a potential long. The positive vanna down around 400 is going to have a strong pull if we can stay under that 407-409 level. If the market wants to move down and we can get past 400 I think we can see the demand around 397-396. Also be mindful of the MMs expectations, they are expecting a weekly close around 415 or 400.
Here is the current look on the VIX. We had that nice breakout that we were following last week and we got the retest that we wanted for a continuation higher. If VIX can hold this breakout I would look for it to test some of the demand above, and I would be wanting to target some of our lower levels.
Above 409 target 412-415 and then 417-420.
Below 407 target 404-402 and then 400, 397-396.
—2/21 Trade Plan—
Lets use all the info above and the Volland data for tomorrow’s expiration to to form a plan. If we look at the vanna for 2/21 we can see similar things.
We can see that there is negative vanna at 410-412, and 405, with a bigger cluster of positive vanna below 405. If we look at the gamma we can see that we have positive gamma from 405-409.
Given the close on Friday of 407.26 if we open or bid above 405 we can retest the 407-410 area and if we open or bid blow 405 I think that may open the door to 400. I think that if we can get to 409-410 I will initially look for a short opportunity to target 407-405, and if we get above 410 I want to target 412-413. Be mindful of the weekly levels from up above.
Above 405 target 407-410 then 412
Below 405 target 403-403 then 400
Happy Trading,
—WICK—
To cover our basis…
Welcome to my Substack where I provide a daily SPY trading plan to help guide my intraday trading. The purpose of this letter is not to advice you on your trading or investment decisions. I am simply documenting my daily trading plan for myself to help with planning and execution. These are simply my opinions and the data sourced from the likes of vol.land, TradingView, Tradytics and others. The stock market is risky, gains are not guaranteed. This is not about getting rich quick, but learn to educate yourself and make the necessary financial decisions on your own. This is not financial advice.


