QQQ
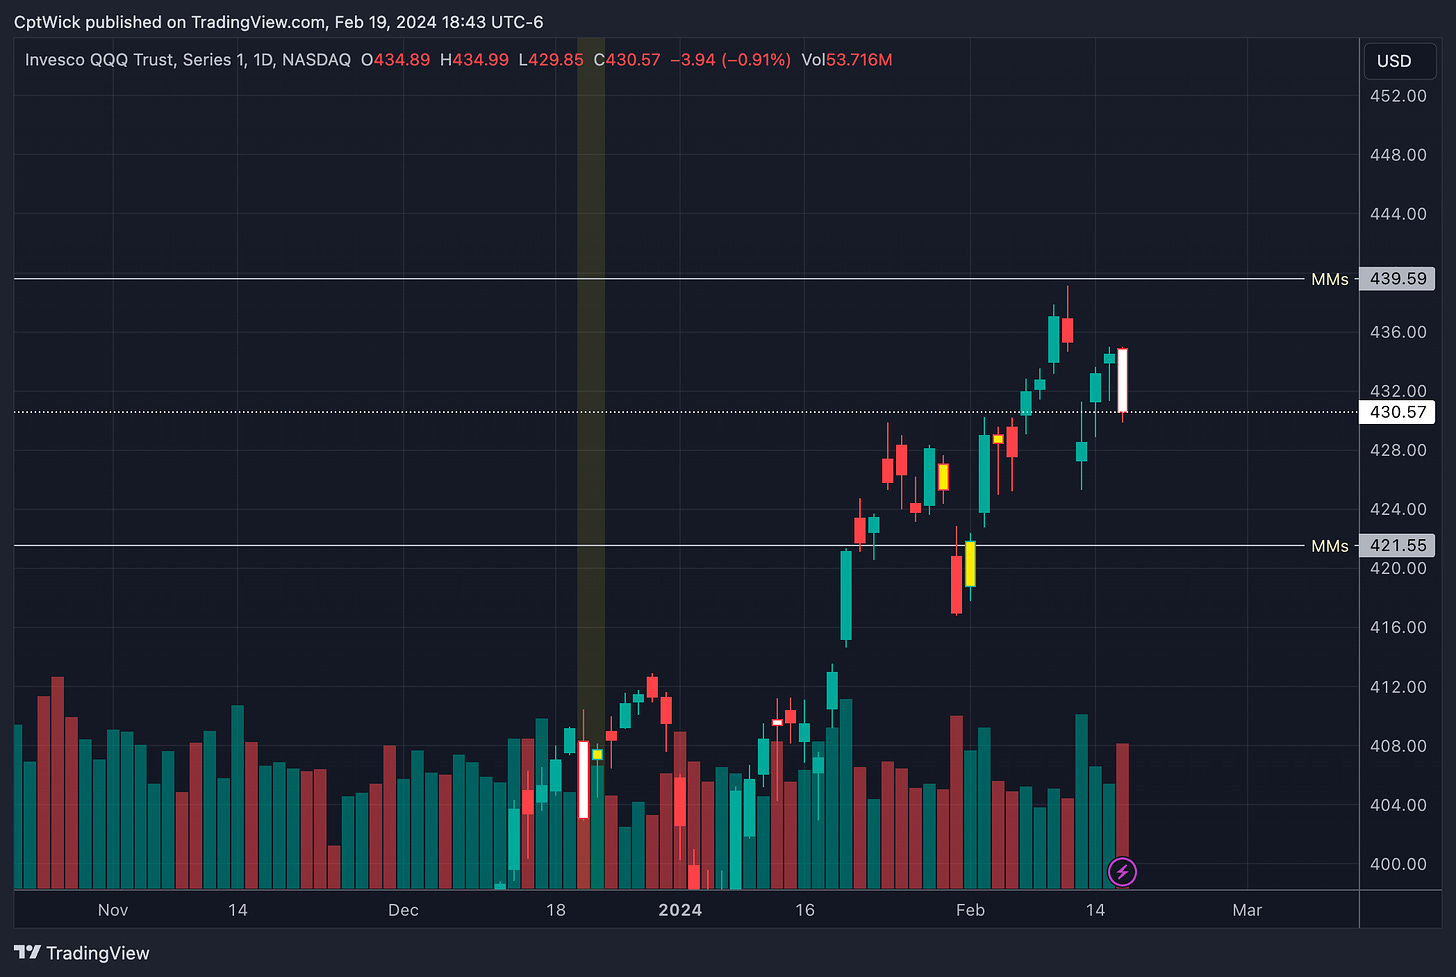
The Market Makers (MMs) weekly implied move is $9.02
Upper range = 439.56
Lower range = 421.55
We only have four session’s this week and the MMs are pricing in a 9 dollar move.
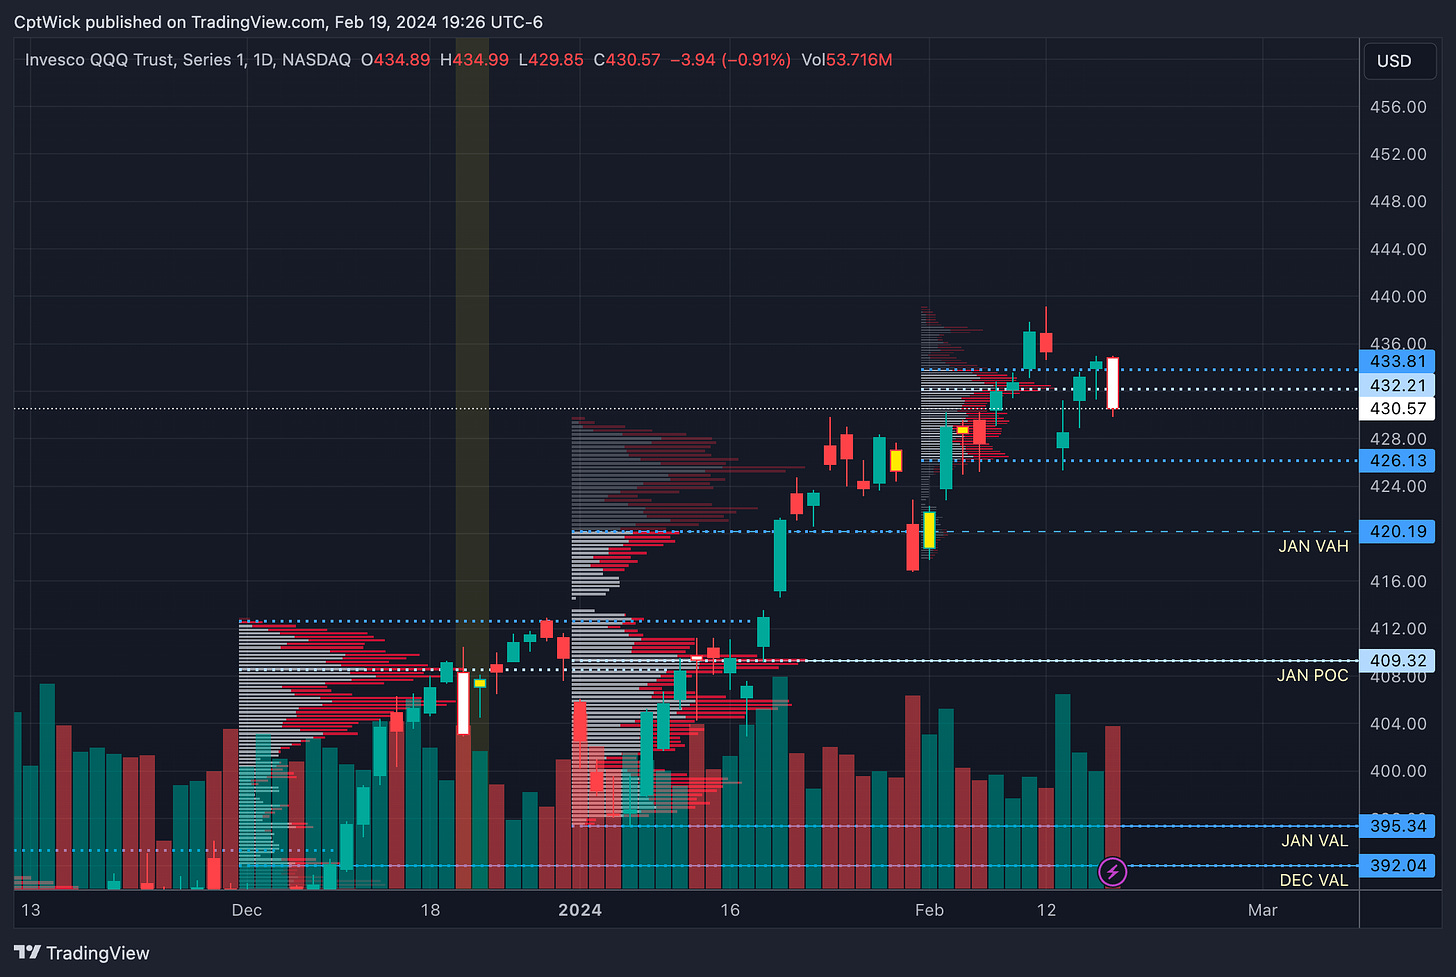
Monthly VP Levels
February’s Current Value Area
VAH 433.81
POC 432.21
VAL 426.13
January's Value Area
VAH 420.19 this level has been breached
POC 409.32
VAL 395.34
We had the big bearish engulfing candle on Friday 2/16, that pushed price under the current VAH and POC.
One of the big levels I want to point out is the Jan VAH at 420.19, I know we are far from it, but if we lose it on the bigger picture, we could test the POC at 409.32, I am not expecting this to happen this week, but we need to be aware.
I will cover potential upside targets beyond the profile later in this plan.
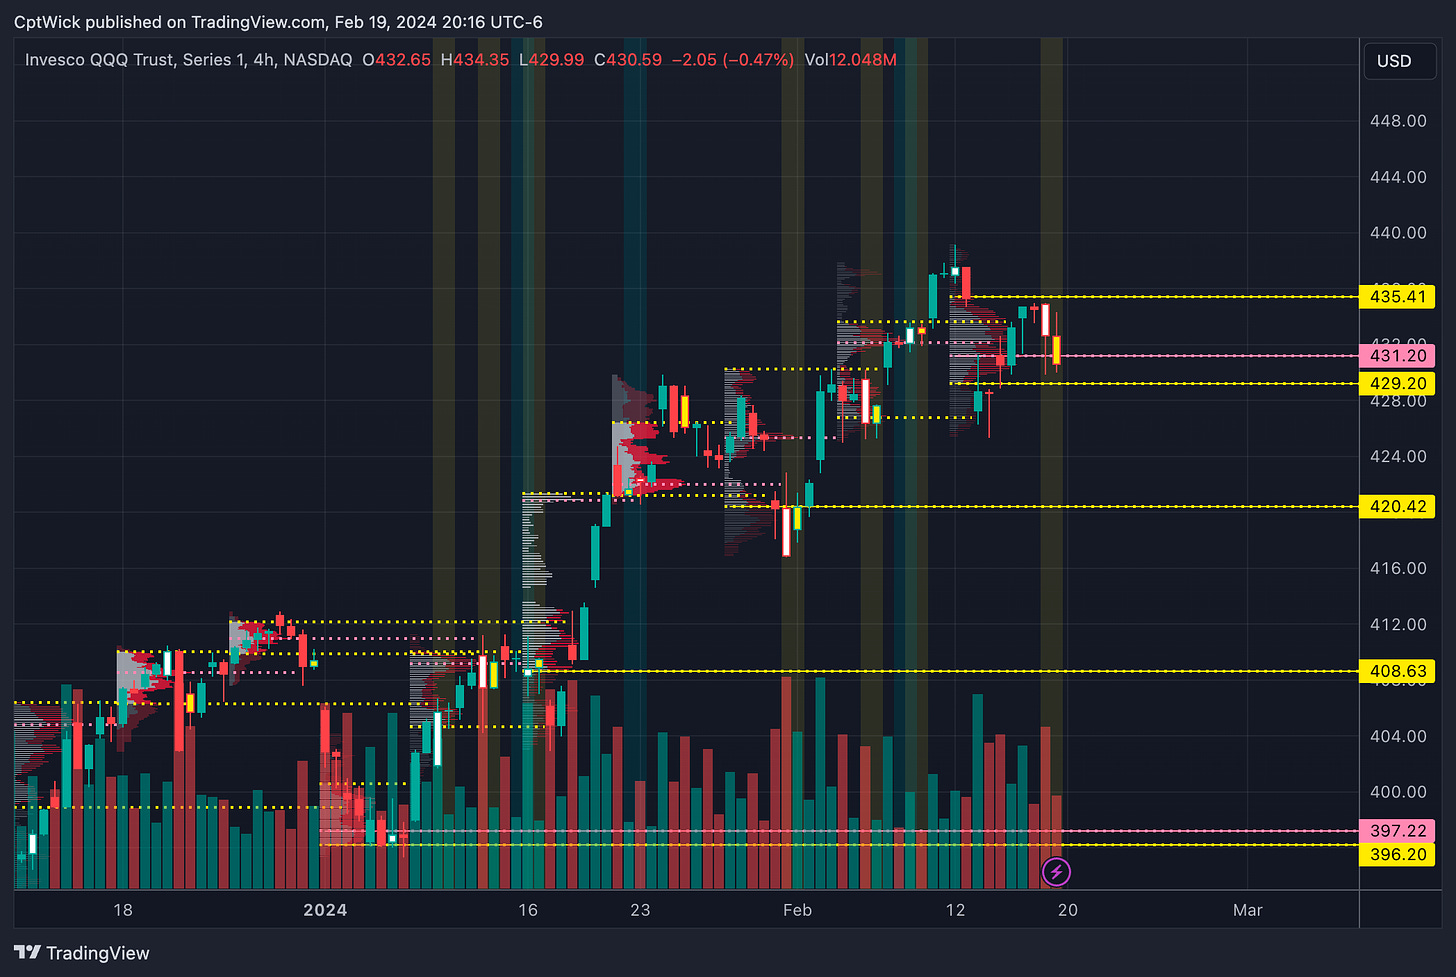
Weekly VP
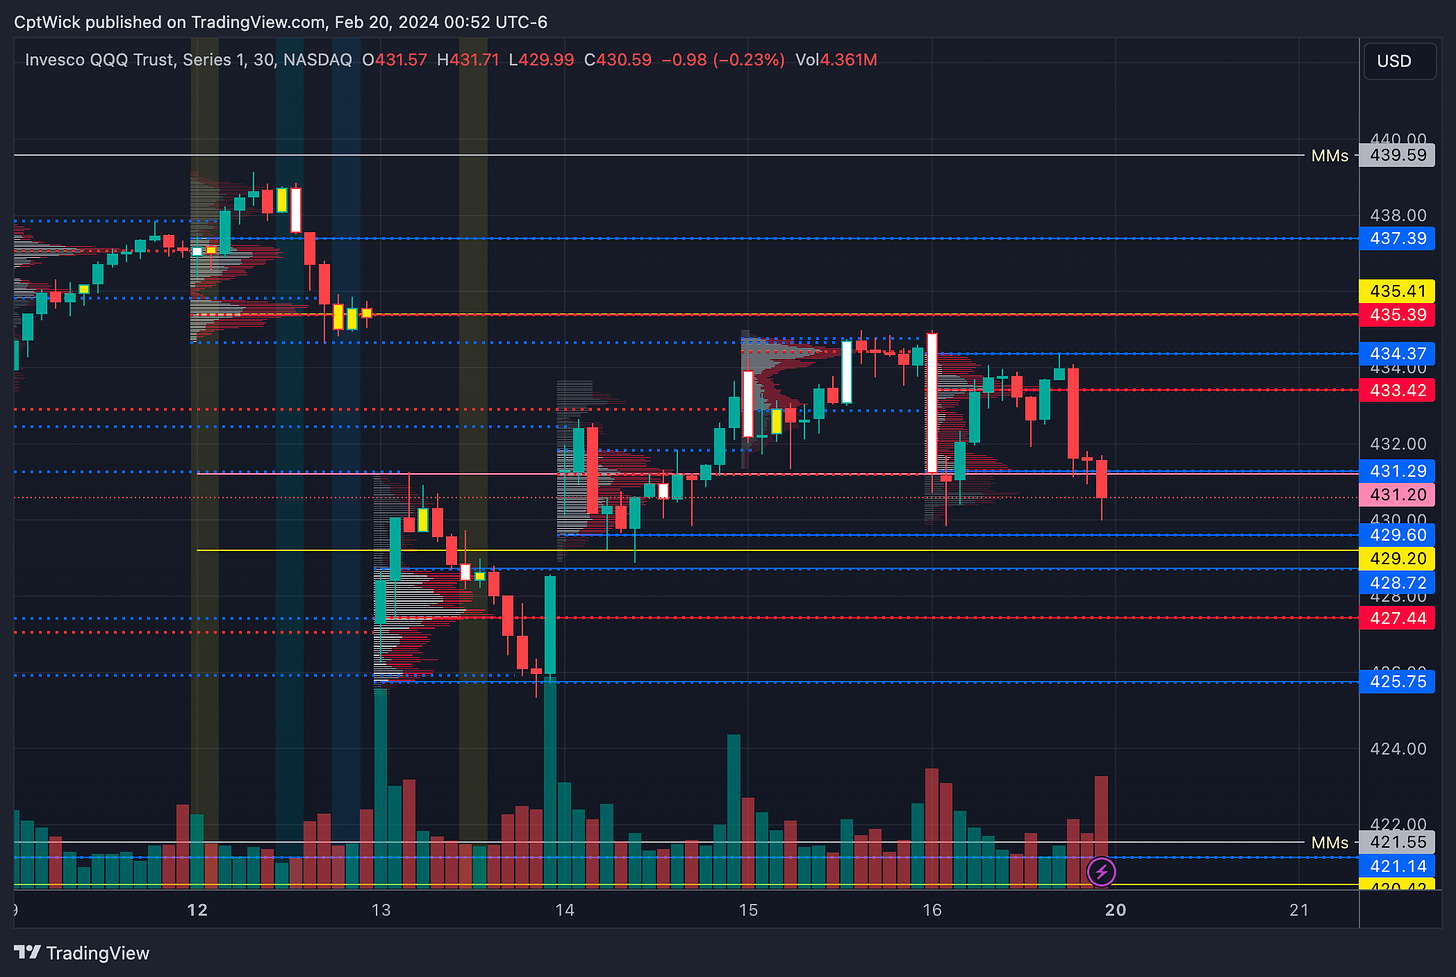
Last Week's Value Area
VAH 435.41
POC 431.20
VAL 429.20
This area is going to be choppy if we are stuck inside of it. We want to see what happens when we breach the VAH or the VAL. We then look for a breakout/breakdown or a FAILED breakout/breakdown.
Notable Weekly Value Levels
420.42 VAL from the week of 1/29
408.63 VAL from the week of 1/16
Fibonacci
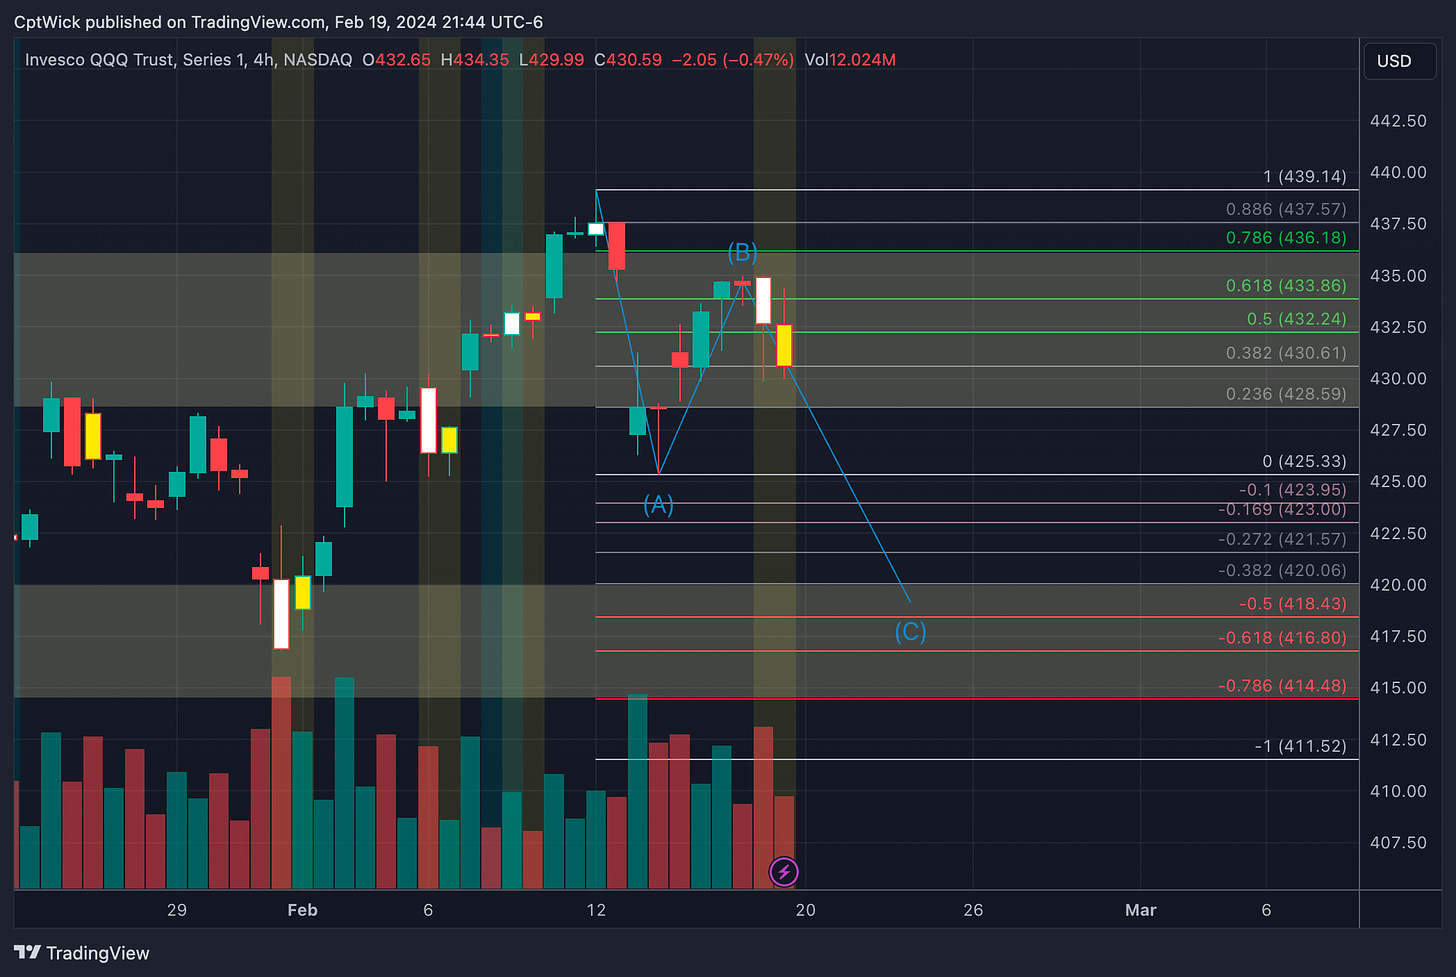
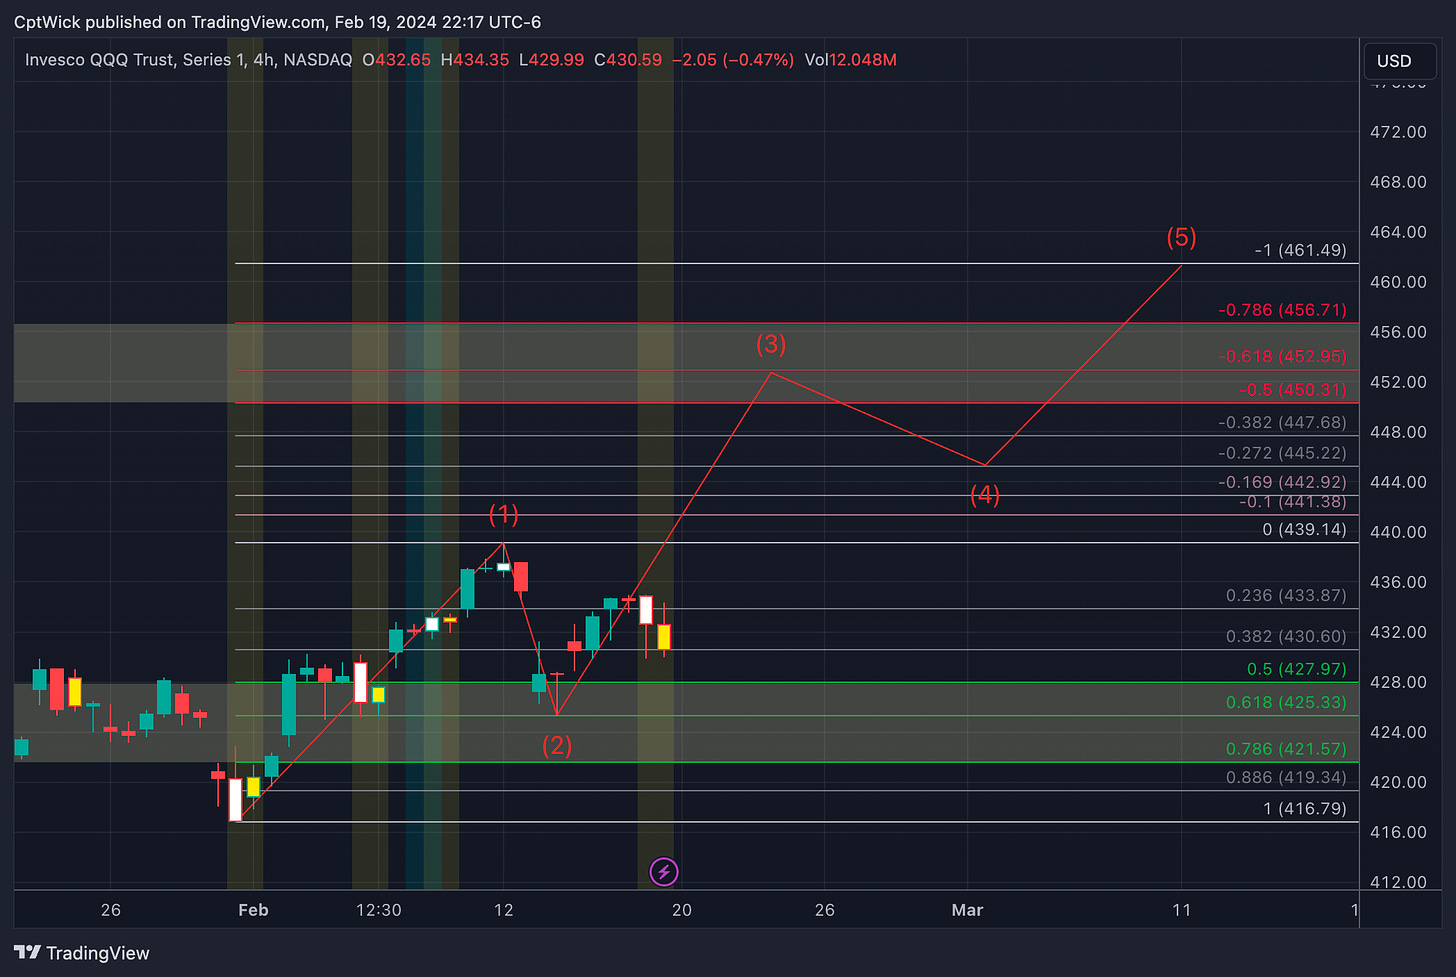
I want to touch on the Fib's I drew from last week's plan. I called out this potential down leg if we could come back into this box.
So far so good if you are on the put side, if price rises back above this box, chances are we are going higher. If bears can hold this box, I would look for a move to the box below around 418.50 or lower.
This would give us a, A=C corrective retracement just like the one that started on 1/29-1/30 into the 31st.
And for the Bull case.
We stated that the swing low on 1/31 to the swing high on 2/12, priced retraced 61.8%, if this area 425.33 holds, we can possibly target the extension at 452.95.
So far, the 61.8% has yet to be retested.
Moving Averages
1D timeframe
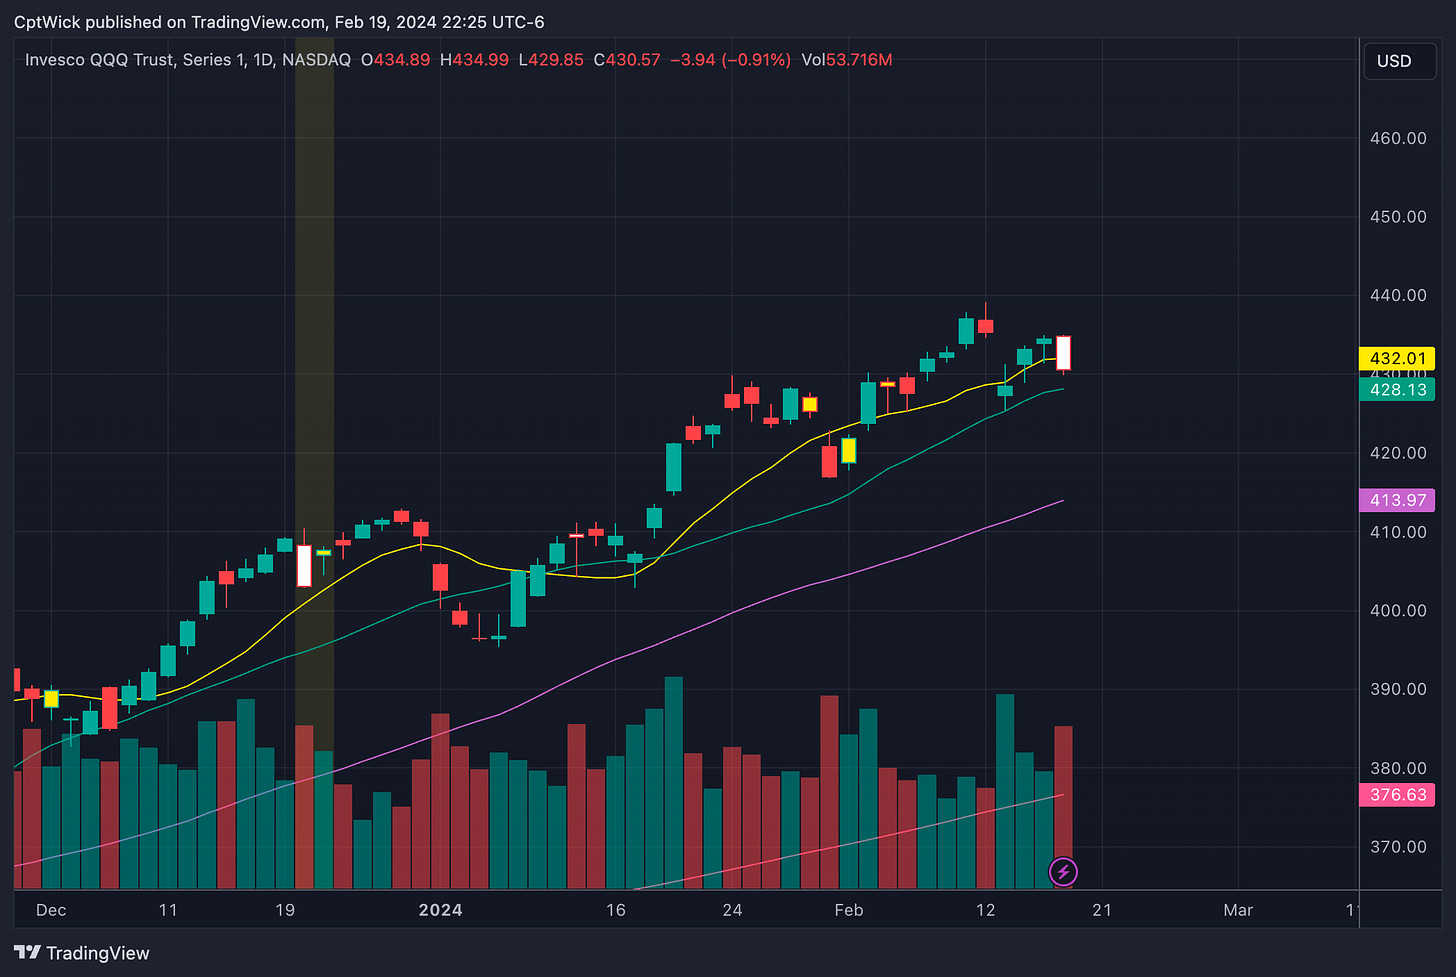
10 SMA - 432.01
20 SMA - 428.13
50 SMA - 413.87
200 SMA - 376.63
One last thing, we fell under the 10 SMA on the 1D, we are sandwiched between the 10 and 20. Keep an eye on these. Bulls need to reclaim the 10 and defend the 20.
Losing the 20 could bring some selling.
Bullish Bias
I want to see the bulls reclaim the 432 area; this is the 10 SMA on the 1D. If this happens, I think they can see last week's VAH.
I also want to see them defend 429.20, this is last week’s VAL I think if we lose this level, it opens the door to 425 and possibly the MMs weekly implied low.
Bearish Bias
Bears need to defend the 10 SMA on the 1D which is 432. If the bulls take this back, it is imperative that the bulls dont take back last week's VAH at 435.41
Keep an eye on the Fibs from the weekly plan for both the bears and bulls. Right now, both sides have a case.
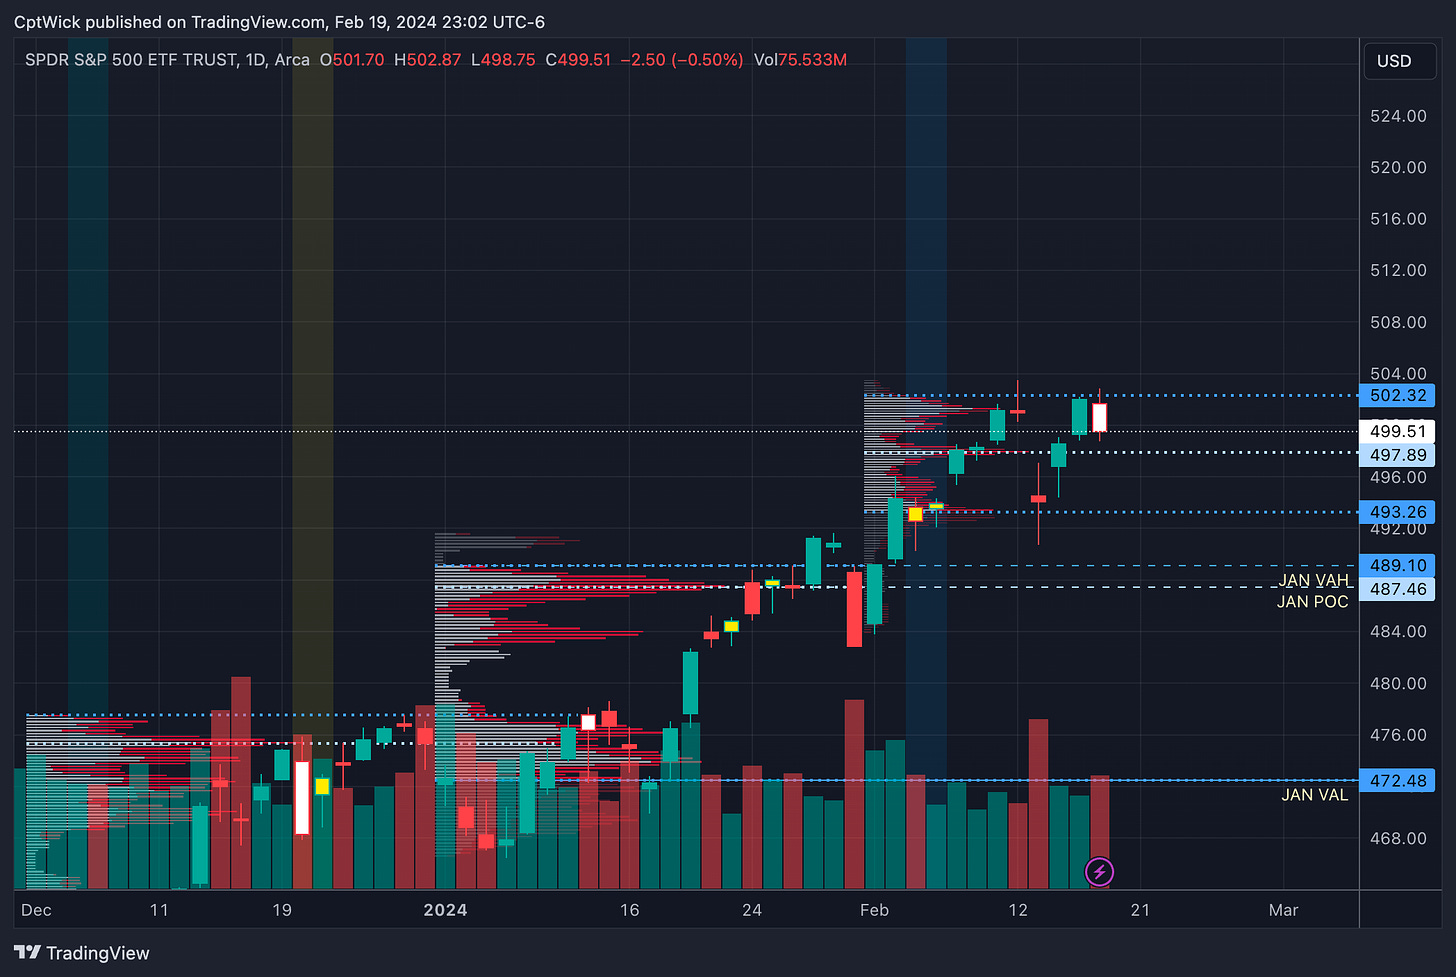
SPY
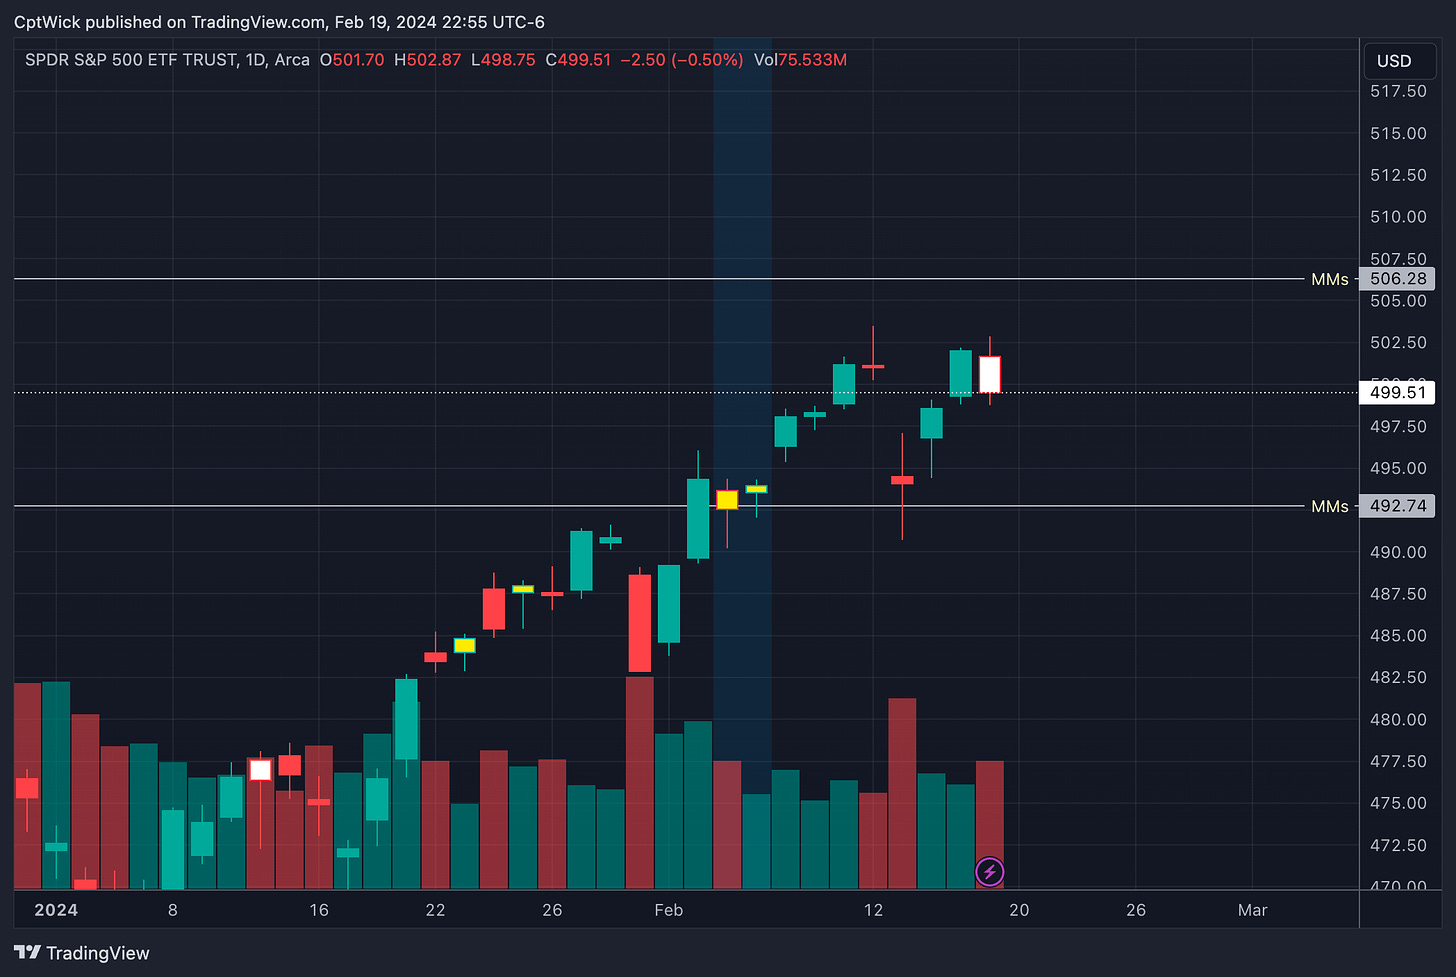
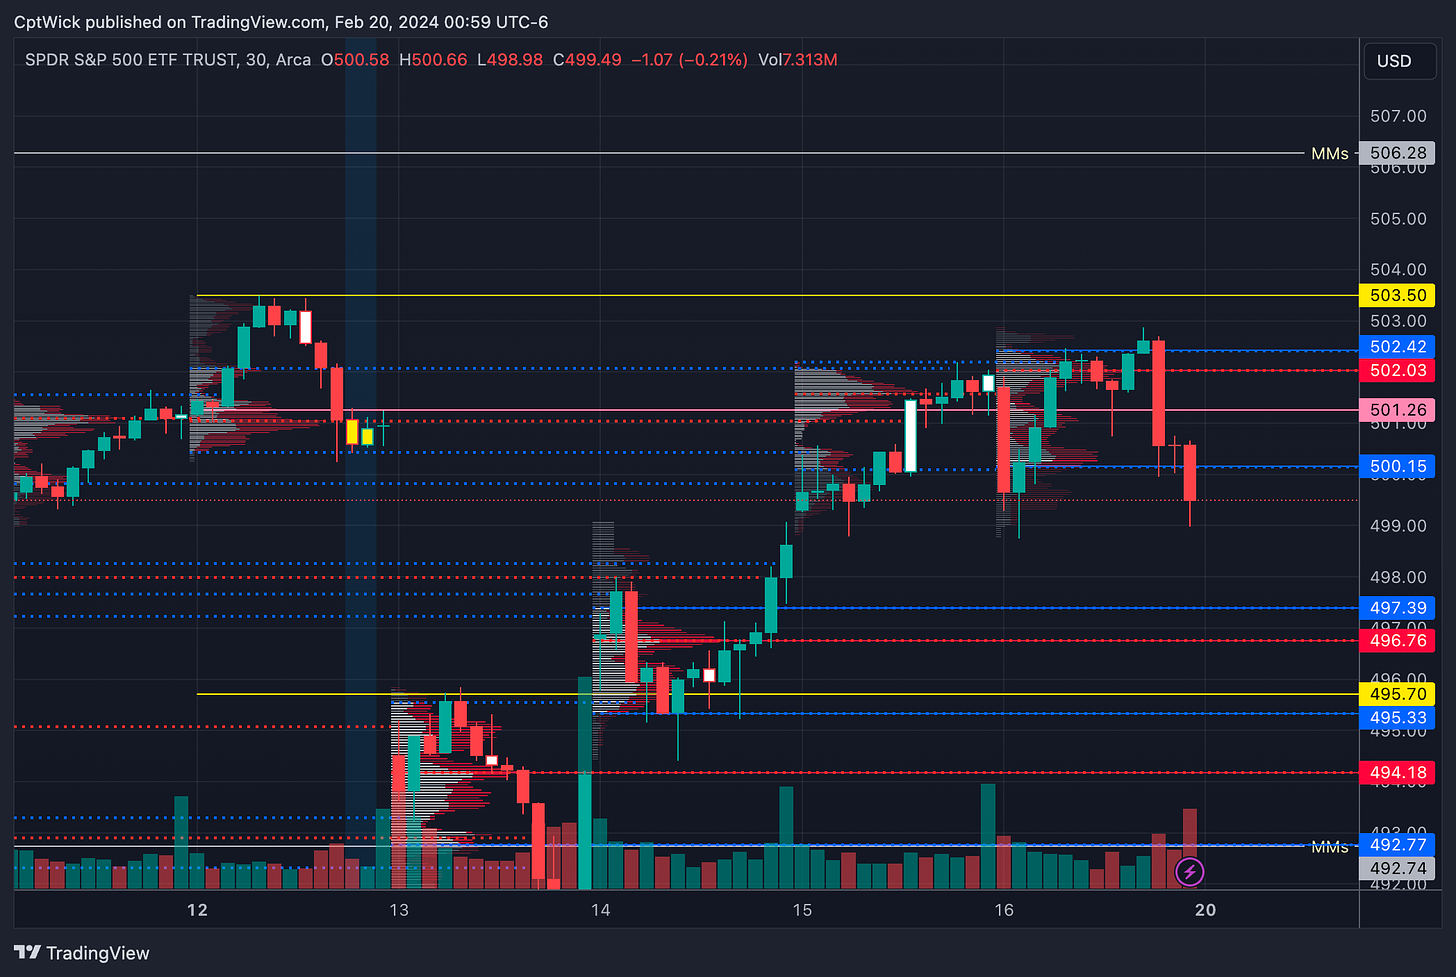
The Market Makers (MMs) weekly implied move is $6.77
Upper range = 506.28
Lower range = 492.74
Monthly VP
February’s Current Value Area
VAH 502.32
POC 497.89
VAL 493.26
January's Value Area
VAH 489.10 this level has been breached
POC 487.46 this level has been breached
VAL 472.48
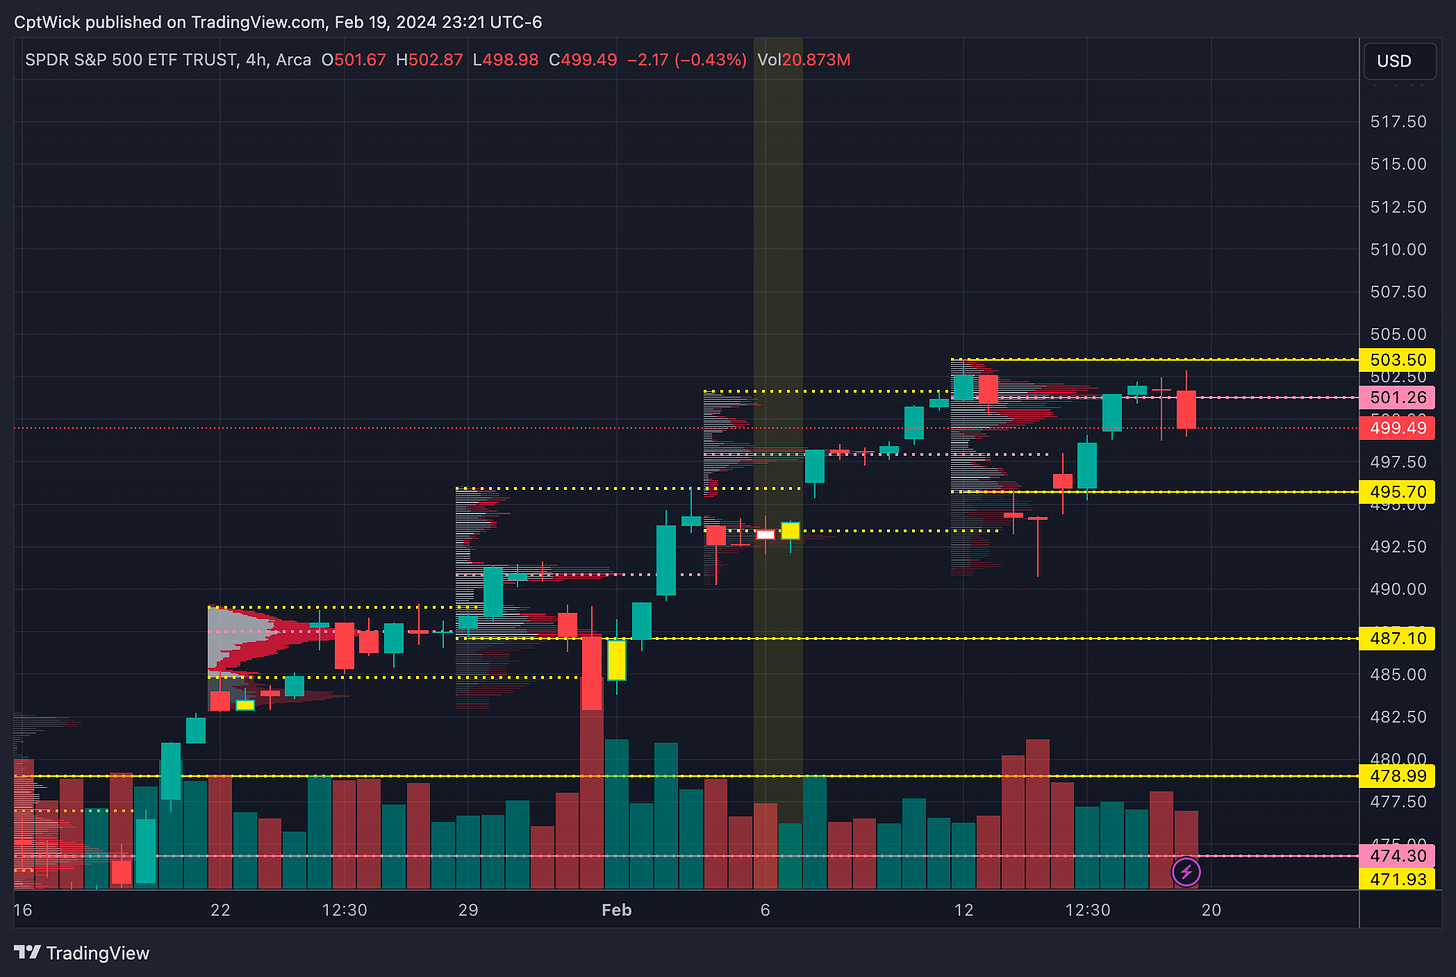
Weekly VP
Last Week's Value Area
VAH 503.50
POC 501.25
VAL 495.70
Notable Weekly Value Levels
487.10 VAL from the week of 1/29
478.99 VAH from the week of 1/16
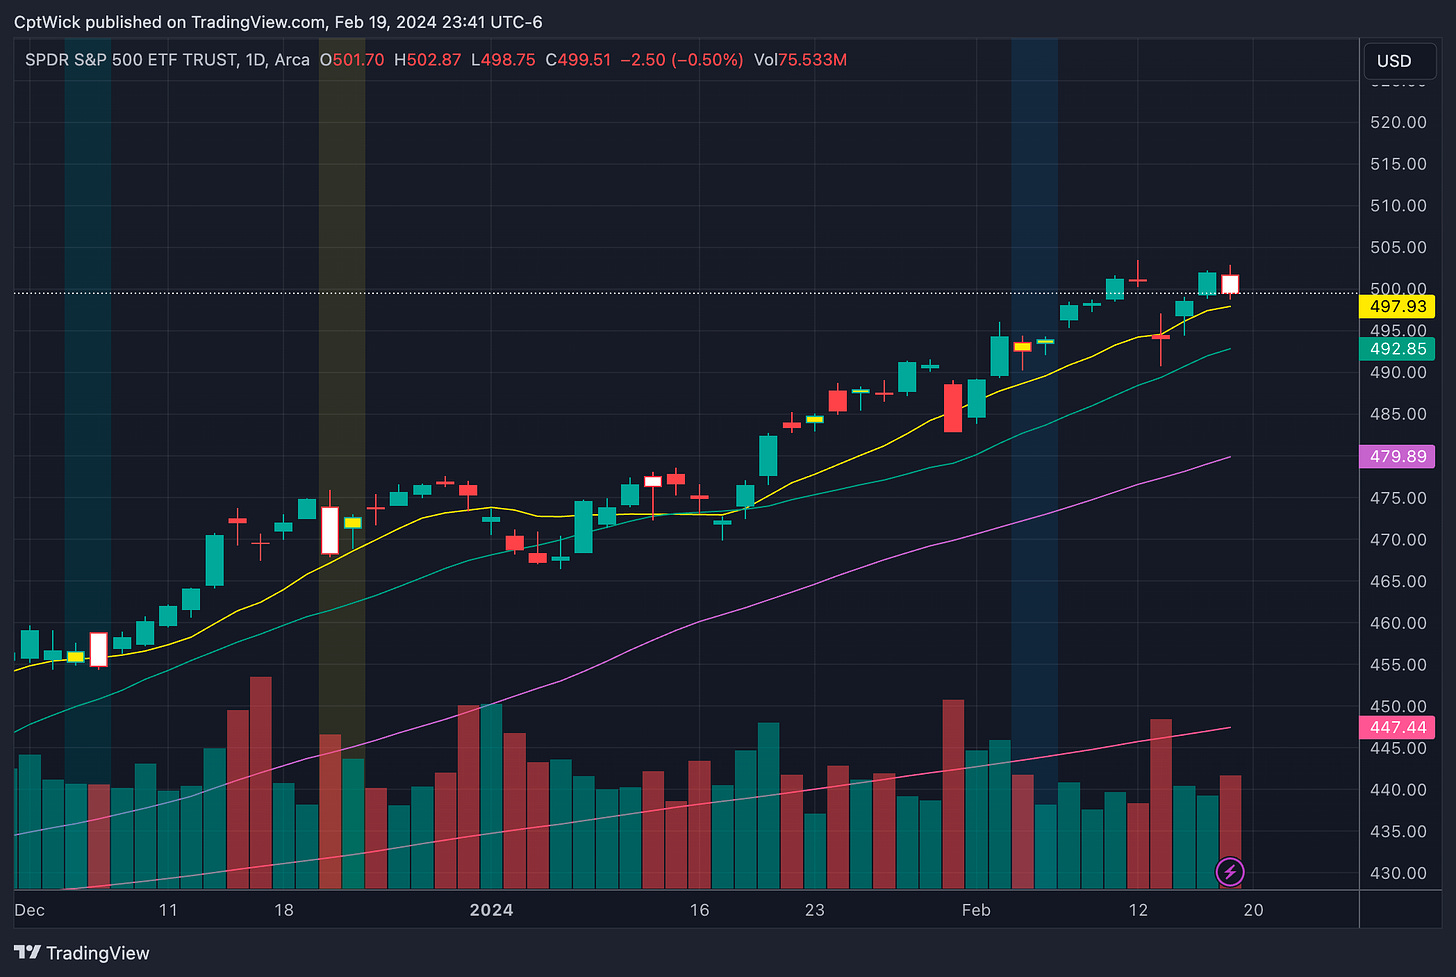
Moving Averages
1D timeframe
10 SMA - 497.93
20 SMA - 492.85
50 SMA - 479.89
200 SMA - 447.44
Bulls need to defend the 10 or else we run the risk of testing the 20.
Happy Trading,
—WICK—
To cover our basis…
Welcome to my Substack where I provide a daily trading plan to help guide my intraday trading. The purpose of this letter is not to advise you on your trading or investment decisions. I am simply documenting my daily trading plan for myself to help with planning and execution. These are simply my opinions and the data sourced from the likes of vol.land, TradingView, Quantdata.us and others. The stock market is risky, gains are not guaranteed. This is not about getting rich quick but learn to educate yourself and make the necessary financial decisions on your own. This is not financial advice.


