A very technical week traded to the downside, but ended with a 40pt rally from the lows of Friday to the close on SPX. I shared a recap of potential trades and why to take them on Twitter - I would suggest that you take a moment to review it and let it soak in and why #paytience and waiting for key levels to materialize before taking a trade.
You can find that Tweet here…
I enjoy interacting and learning from other traders so continue to share your trades, ideas, and how you use this trade plan by messaging me on Twitter @DarkMatterTrade.
Before we get into the trade plan for 2/13, I want to take you through some of my analysis I do over the weekend. The weekend and more specifically Sunday is a prime opportunity to soak in any news, data, and reviewing the charts. So let’s kick in to see what I am doing…
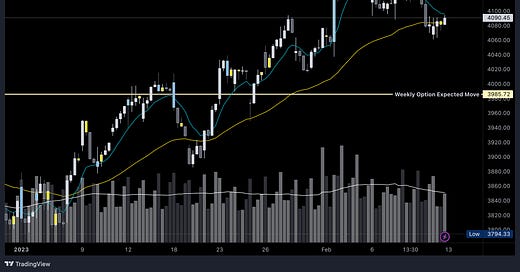
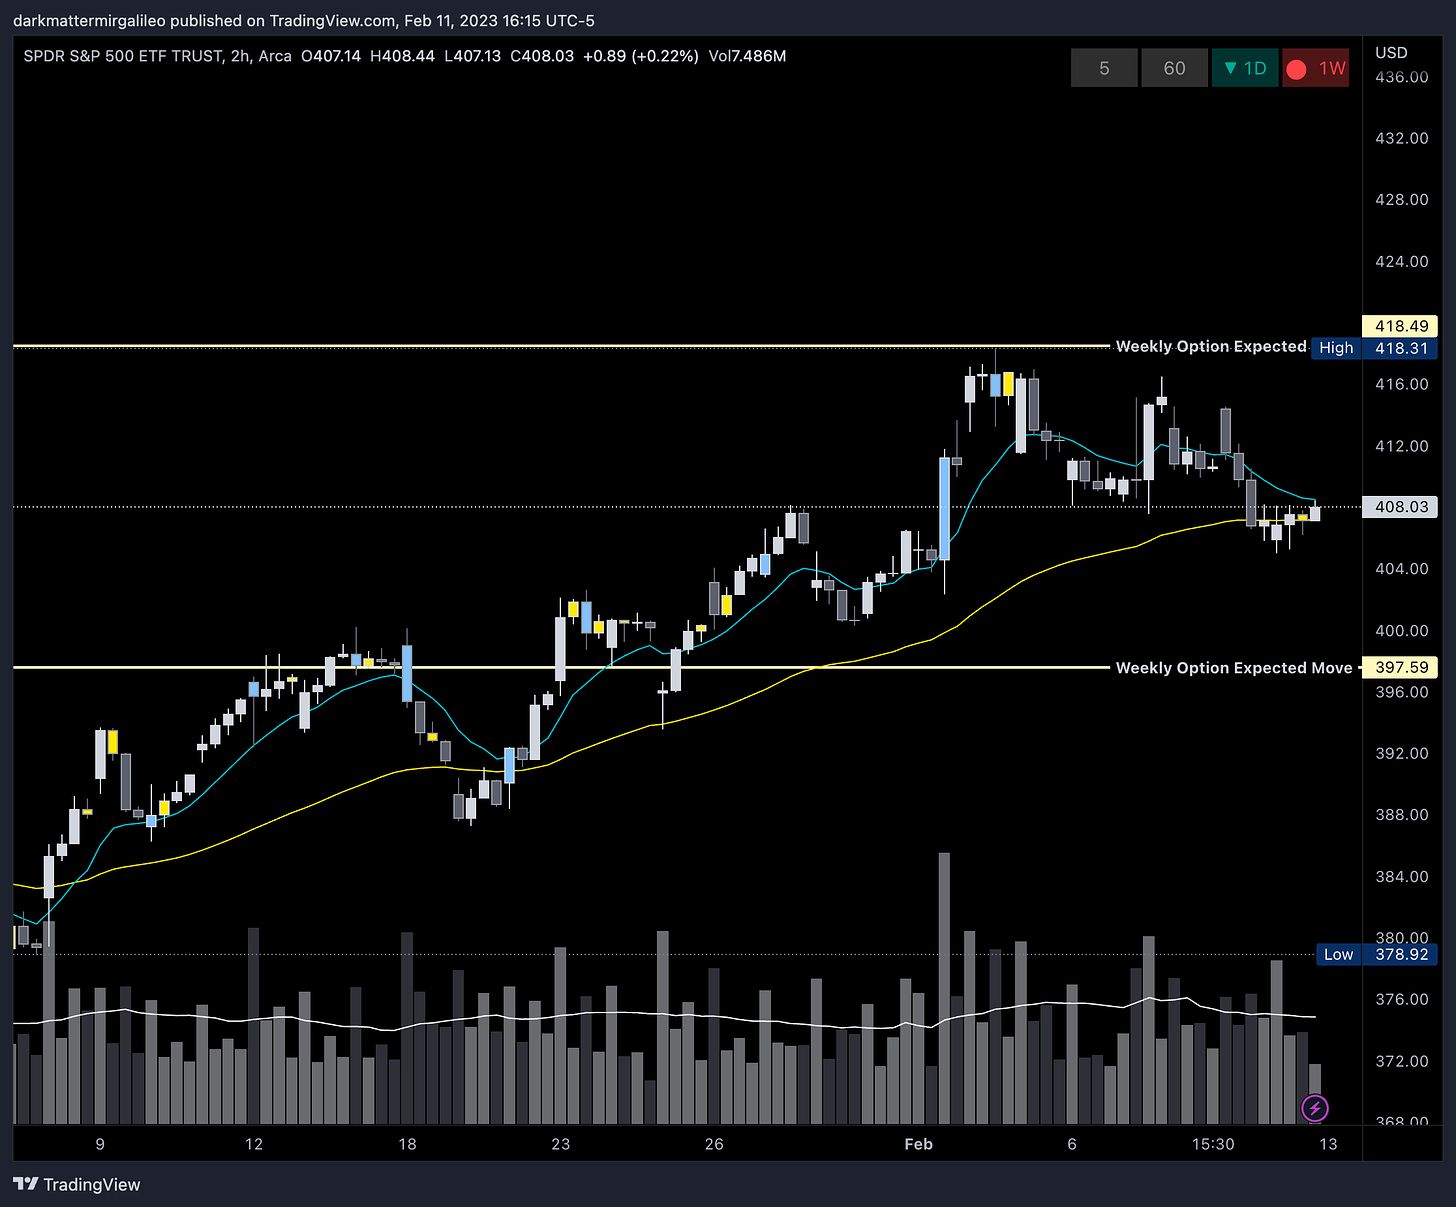
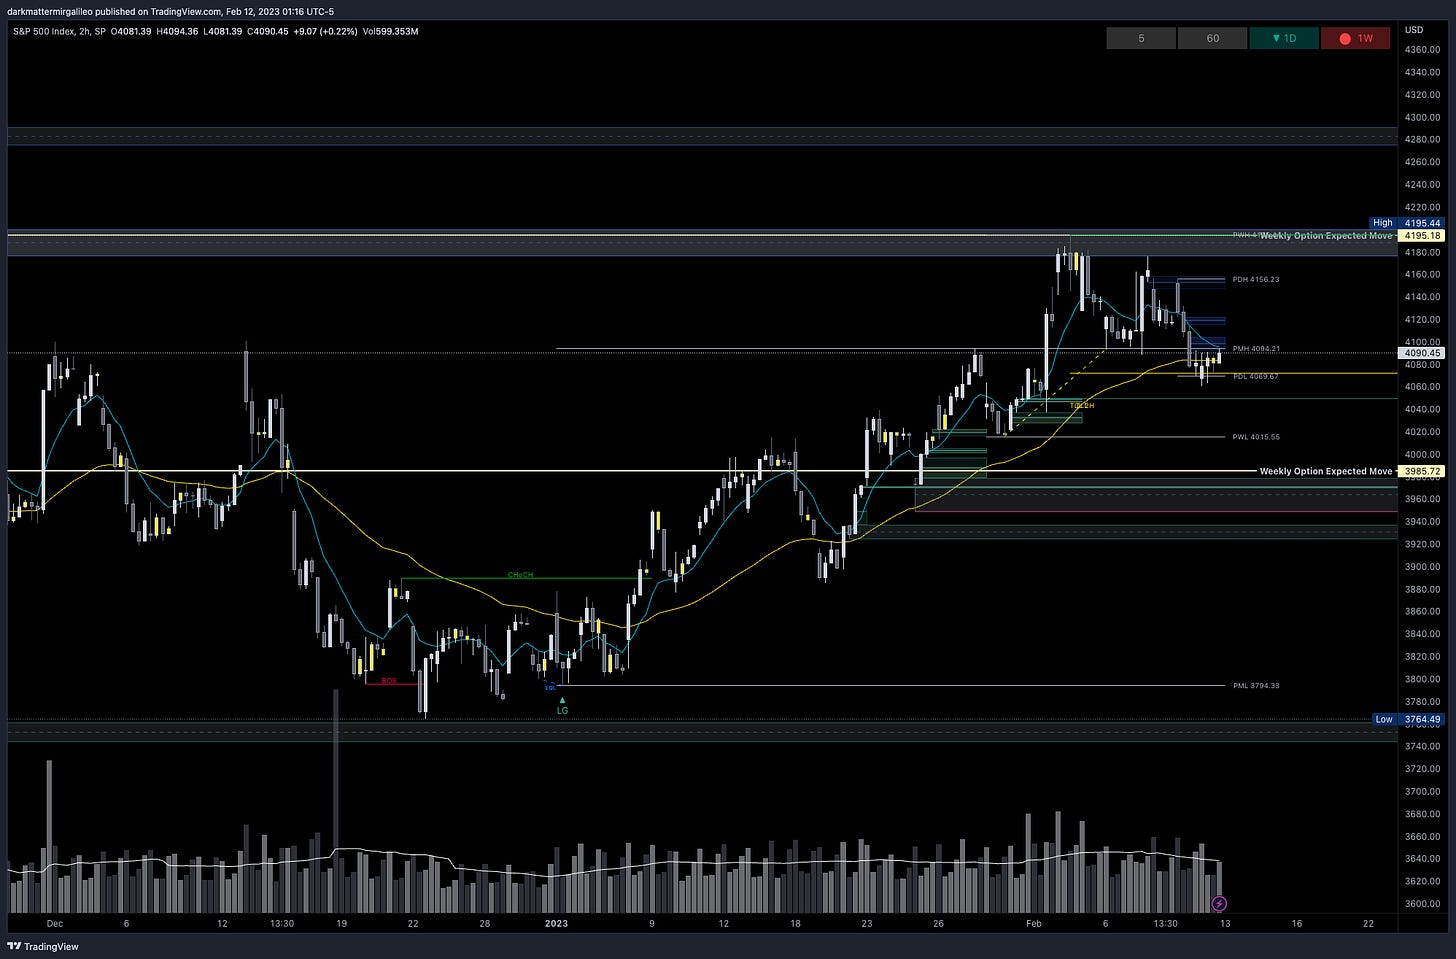
The first thing I do is mark my options weekly expected moves. For those on Think or Swim (TOS) you can find these totals at market close. Take SPY 0.00%↑ or SPX’s Friday close amount and add and substract to get your range. For this week SPX’s expected move is 104.73, SPY is 10.45, and QQQ 10.41.
From there I have the following checklist:
Review Volland
I review Volland to see where levels are hedged by dealers and where they must react if price gets to a certain level
Always think in a If X happens then Y will occur
The key areas in Volland that I am reviewing are Vanna, Gamma, DAG Exposure, Vega, and Charm
I am not focusing on EVERY single level - look at levels that overlay each other on each chart where potential fireworks can occur such as positive vanna and negative gamma
Volume Profile & Low Volume Nodes
There are many great videos on YouTube and articles on this topic, but what I am looking for are we inbalance, out of balance, near a POC (point of control), what other POC’s are of interest
My friend Captain Wick had a great post on Low Volume Nodes
He has a full write up that you can visit below to learn more
I then go into the charts and there are a few key items I am looking for
What is the trend on the larger timeframes such as the 2hr, 4hr, daily, weekly, and monthly
Are there any key trendlines
I always stick to two EMA’s on my chart and that’s the 10/50 EMA’s
When the 10ema is above 50ema we are bullish
When the 10ema is below the 50ema we are bearish
Go put these on your charts and when you view them on timeframes less than the daily timeframe you will see the power they provide
For scalpers out there the smaller timeframes provide great opportunities to scalp 5-10pt moves
Review key tickers
In this market if you are not looking at the VIX, DXY, 2-year, TLT to help determine a risk on vs off environment you are behind
There is a direct inverse correlation between DXY and the equities - DXY goes up, equities go down
Order blocks and Fair Value Gaps
These are Smart Money Concepts and again you will find much more content online
I use these to see if any key Vanna/Gamma/DAG levels overlay to potentially add to my conviction to some of my trades
As an example you will see the power these concepts provide - in the below example you will see last week a key bearish order block where sellside liquidity existed was actually the high point of the market before we sold off
Trading is not for the unprepared. It is critical you abide to a strategy and checklist and walk into every trade with a plan. Without a plan you are simply gambling and have a better chance at the slot machines. There are more nuances to my weekly and daily checklists, but I think this provides a good read for now and we will/can continue adding to it.
Let’s get into tomorrow’s trade plan.
News Catalyst
There is no news catalyst for Monday besides all this alien 👽 talk ha!
For more information on these news events, visit the Economic Calendar
SPX & ES Trade Plan:
Remember you can use this SPX trade plan to trade ES. Take roughly 9 pts off ES and you get these SPX levels. At Friday close ES traded 4099.75 and SPX 4090.45.
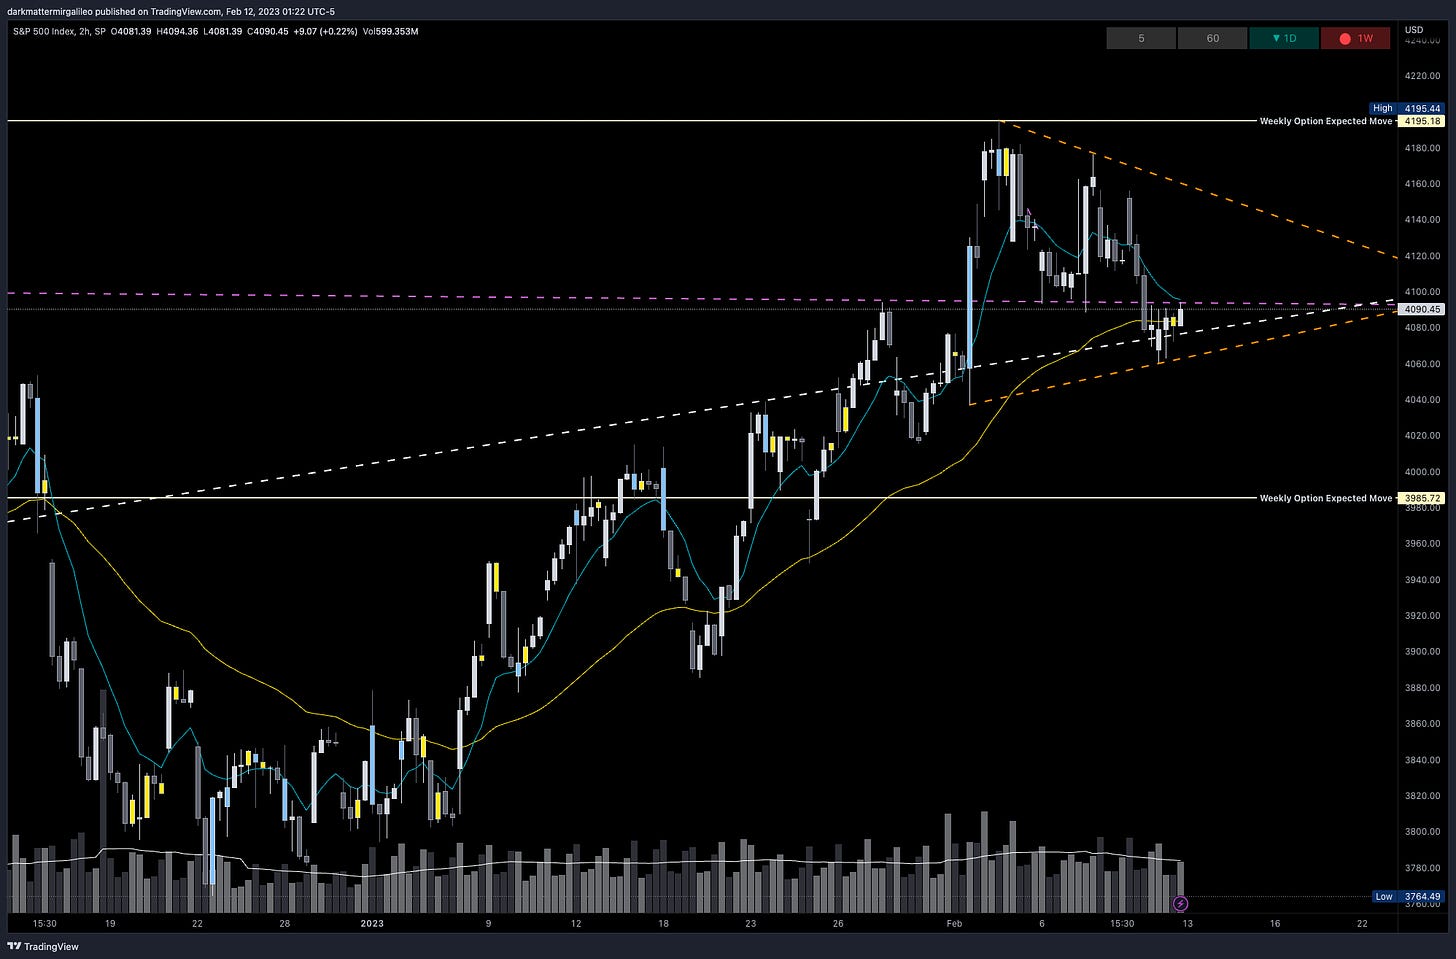
The key trendlines I am watching are:
Orange - From our recent highs you can see this trendline is a clear resistance to price above and a triangle/wedge has formed where I can see price ping pong before CPI and post CPI waiting for a breakout up or down
Purple - This trendline was broken at FOMC around 4093 and where price was rejected on Friday at the end of the day - let’s see if the bulls take us back above
White - this is our trendline from the Covid 2020 low - while price broke below it, we were able to get back within it
Bullish bias:
Above 4100 target 4115
If there is a breakout at 4100 target 4115
If there is a breakout at 4120 target 4140
Below 4080 target 4065
If there is a failed breakout at 4100 target 4085
If there is a breakdown of 4045 target 3980
Vol.land Data
For a better understanding of the various greeks below I would suggest you visit the Volland YouTube Page. Volland provides unique data showing where dealers are positioned providing in my opinion a higher degree of conviction to where price may move to.
Vanna - Levels where price may repel or act as magnet
Remember for price to go above spot through a magnet or repel VIX and IV must decrease. For price to go below spot through a magnet or repel VIX and IV must increase.
Above Spot:
4100 is a minor positive vanna - acting as magnet
4120 is a minor negative vanna - acting as repellent
4150 and 4175 are major negative vanna - acting as repellent
4200 is a minor positive vanna - acting as magnet
IV and VIX need to decrease above 4095 in order for price to flow towards 4120 then 4150
Below Spot:
4075-4055 is a cluster of negative vanna - acting as repellent
4050 is a minor positive vanna - acting as magnet
4035-3980 is a cluster of positive vanna - acting as magnet
4000 is a major positive vanna - acting as magnet
3975 is a major negative vanna - acting as repellent
IV and VIX need to increase below 4090 in order for price to flow towards 4055
Our range could be 4075-4115
Bulls must hold 4075 in order to push to the upside to target 4115
Bears must break 4045 to target 4000 and then 3980
Gamma and Delta-Adjusted Gamma (DAG)
Above Spot:
4100 is a major positive Gamma - acting as resistance
4115 is a minor positive Gamma - acting as resistance
4125-4135 are minor positive Gamma - acting as resistance
4160 is a minor positive Gamma - acting as resistance
Above 4095 will trigger dealer buying pressure supporting price to 4115
Below Spot:
4065 is a major positive Gamma - acting as support
4045 is a minor positive Gamma - acting as support
Note if this level breaks and paired with Vanna data will push price towards 3980
3975 is a major positive Gamma - acting as support
Below 4065 will trigger dealer selling pressure pushing price to 4005
Charm - which direction will dealers be moving price
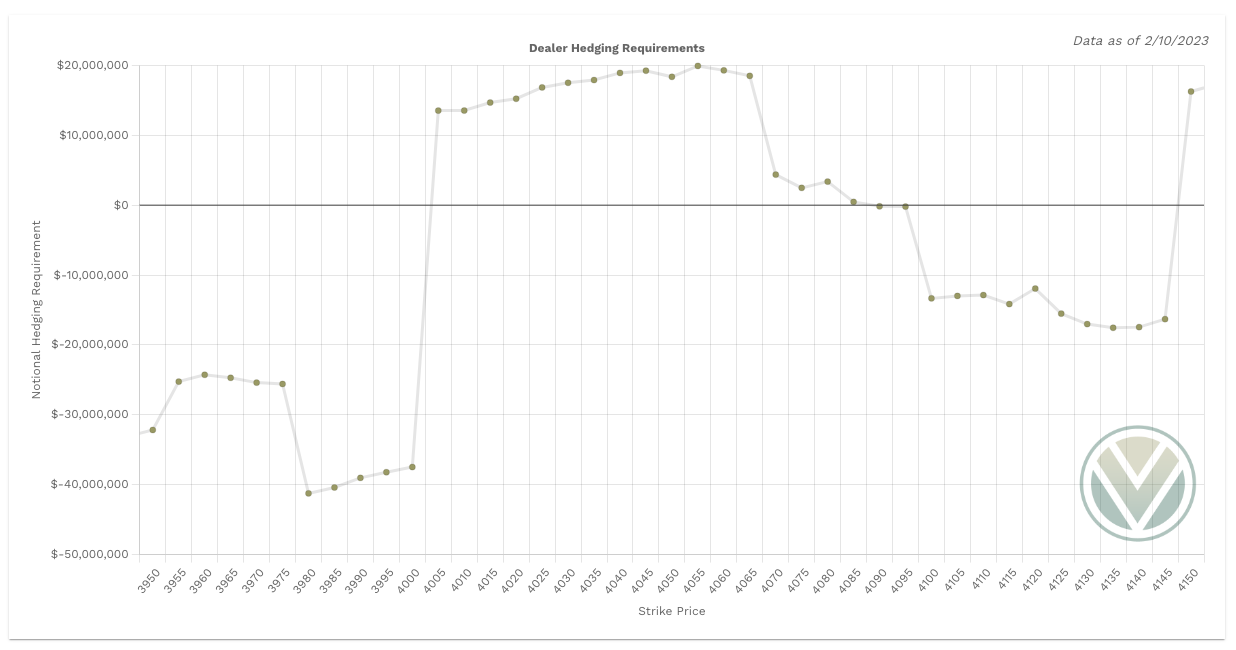
Negative aggregate charm will push price to the upside - positive aggregate charm will push price to the downside
2/12
The charm chart still suggests a more bullish stance where negative notional value outweighs positive notional value.
QQQ Trade Plan
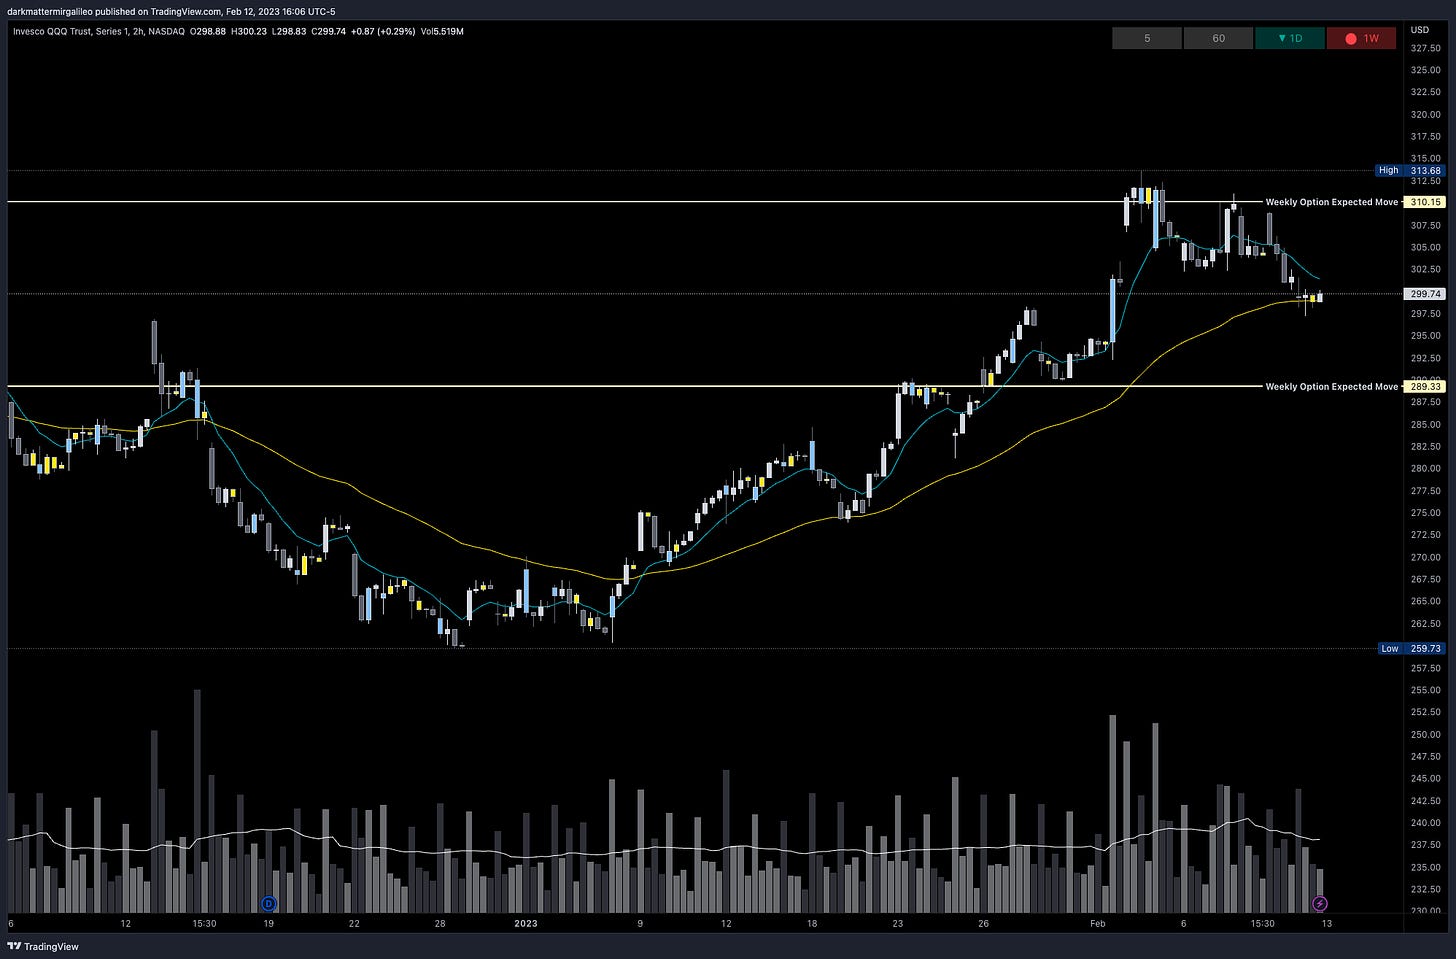
A few of you have asked for a QQQ trade plan. While I don’t trade QQQ as often, let’s review it and potentially add it as a ticker for trades.
Here is our weekly options expected move:
Bullish bias:
Above 301 target 304
If there is a breakout at 308 target 310
If there is a failed breakdown at 300/298 target 302 then 305
Bearish bias:
Below 298 target 295
If there is a failed breakout at 302 target 295
If there is a breakdown of 294 target 291
Vanna:
300 is a positive vanna - acting as magnet
304/305 are positive vanna - acting as magnet
310 is a major positive vanna - acting as magnet
297 is a positive vanna - acting as magnet
295 is a negative vanna - acting as repellent
Gamma:
300 is a major positive Gamma - acting as resistance
301 is a minor positive Gamma - acting as resistance
304 is a minor positive Gamma - acting as resistance
310 is a major positive Gamma - acting as resistance
294 is a minor positive Gamma - acting as support
285 and 282 are major positive Gamma - acting as support
Final Take
I think there will be a run up prior to CPI on Tuesday - our big news catalyst - and even into Tuesday which could trigger a short squeeze going above 4150/4175/4200. This is a critical moment in the market. The rest of the week we have key news catalysts such as Retail Sales and PPI on Wednesday and Thursday.
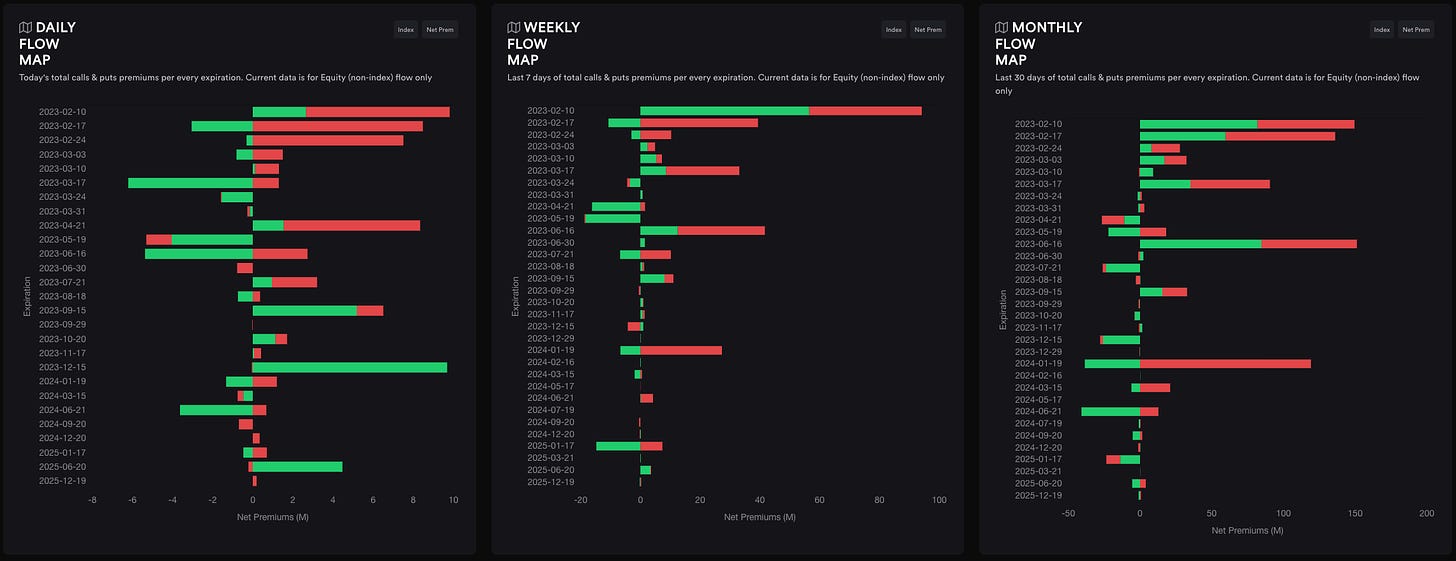
Again, I don’t like making predictions, but anytime we are heading into a key news catalysts seeing how overtly bearish people are and seeing options volume come so heavily to one side makes it hard for the MM’s to pay everyone. Something is bound to break and not go in favor of the masses…
Similarly, if we take a look at the OI on the weekly, very heavily sided on puts. Below is the OI of SPY.
Stay #paytient and react to the key levels - no predictions! Good luck traders.
I am going to share my key rules to intraday trading in the end of the plan moving forward to build better habits and allowing you to grow as a better trader.
My Intraday Trading Rules
I do not trade within the first half hour UNLESS I am in a trade from the prior session and looking to close the trade or we have a major gap or a key level already broken - key level today would have been 4130 and 4150 and will explain below why these were important levels
I let the initial balance do its thing - I am just a small fish in a large ocean of traders so let's let them fight it out
I then wait for key levels targeting one level to the next and taking profits at each one.
If there are key levels that are 10pts apart that is when I have scalping mindset and anything above 10pts I want to give it the room to hit the price target with a 5 pt buffer to take profits once we reach within 5 pts of a target - I also tighten my stop loss once at 10-20% profit with the goal of never allowing trades to go red when I have a nice profit)
I supply options greeks with OB (order blocks) and FVG (fair value gaps) otherwise known as Smart Money Concepts
When I am scalping - ie targeting 10pt trade levels I will take profits and never go more than 10% red. Simple as that, know your trade plan strategy and the risk. When you are wrong you are wrong and reset
For 20pt trade level targets I will increase my stop losses to 20% and allow more of the trade to play in the event I entered too early
I try - key word try ha - avoid trading lunch hours defined as 12pm to 2 pm est. Money for the most part unless you are scalping - is made in the first 2 hours of the trading day and the last 2 hours
There are more we could discuss including volume profile, low volume nodes that I think are great strategies to compliment option greeks. Maybe in the future we can include more details.
To cover our basis…
Welcome to my Substack where I provide a daily SPX trading plan to help guide my intraday trading. The purpose of this letter is not to advice you on your trading or investment decisions. I am simply documenting my daily trading plan for myself to help with planning and execution. These are simply my opinions and the data sourced from the likes of vol.land, TradingView, Tradytics and others. The stock market is risky, gains are not guaranteed. This is not about getting rich quick, but learn to educate yourself and make the necessary financial decisions on your own. This is not financial advice.

