Readers,
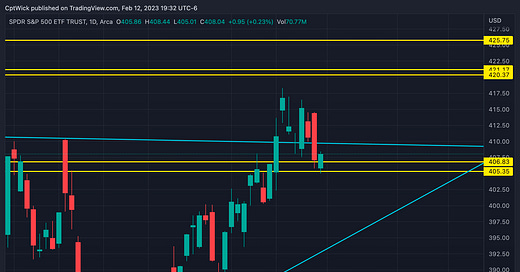
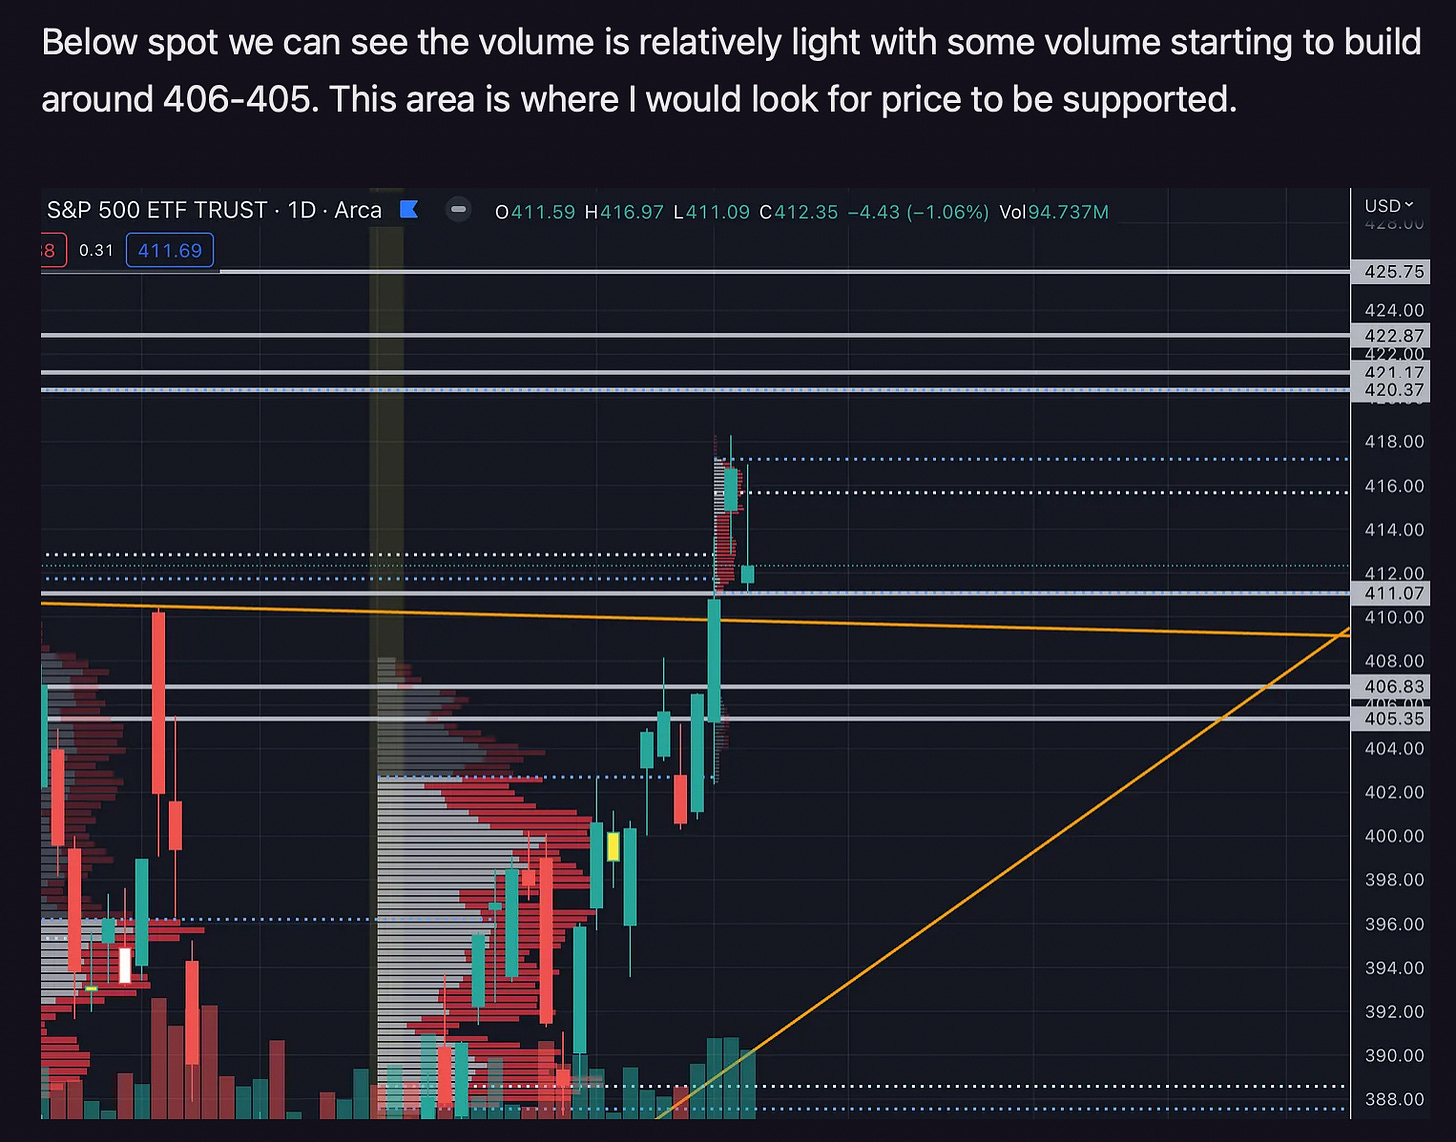
This past week, our approach to trading was guided by a well-thought-out weekly plan. The plan put emphasis on identifying key demand zones, including one in the 405-406 range. Our diligent execution of the plan resulted in a remarkable outcome, as we closed the week with a bounce from this very demand zone, leading to a streak of 5 straight profitable days for the account. Here is a snapshot of the demand zone at 406.83 - 405.35.
Ill leave a line here to the plan if you want to go back and read it. 2/6-2/10 Plan
—2/10 Recap—
Lets see how our plan on Friday turned out. We said that the key level was going to be 410 and if we couldn’t trade above that we wanted to target 405.
Friday proved to be a dull day in terms of SPY activity as we reached our pre-determined downside target swiftly, followed by a period of unsteady trading. Despite the monotony, we stayed true to our strategy and maintained our disciplined approach, keeping our sights set on our long-term goals.
During my analysis, I emphasized several key levels that I believed were crucial for maintaining the bullish trend. Unfortunately, none of these levels held and we are now trading below them. We do not want to make predictions in the market but, the current outlook for bulls is not favorable. However, it is imperative that we conduct a thorough analysis for the coming week to stay informed and prepared.
Do the readers like the recap section?
—2/13 - 2/17 Pre Plan—
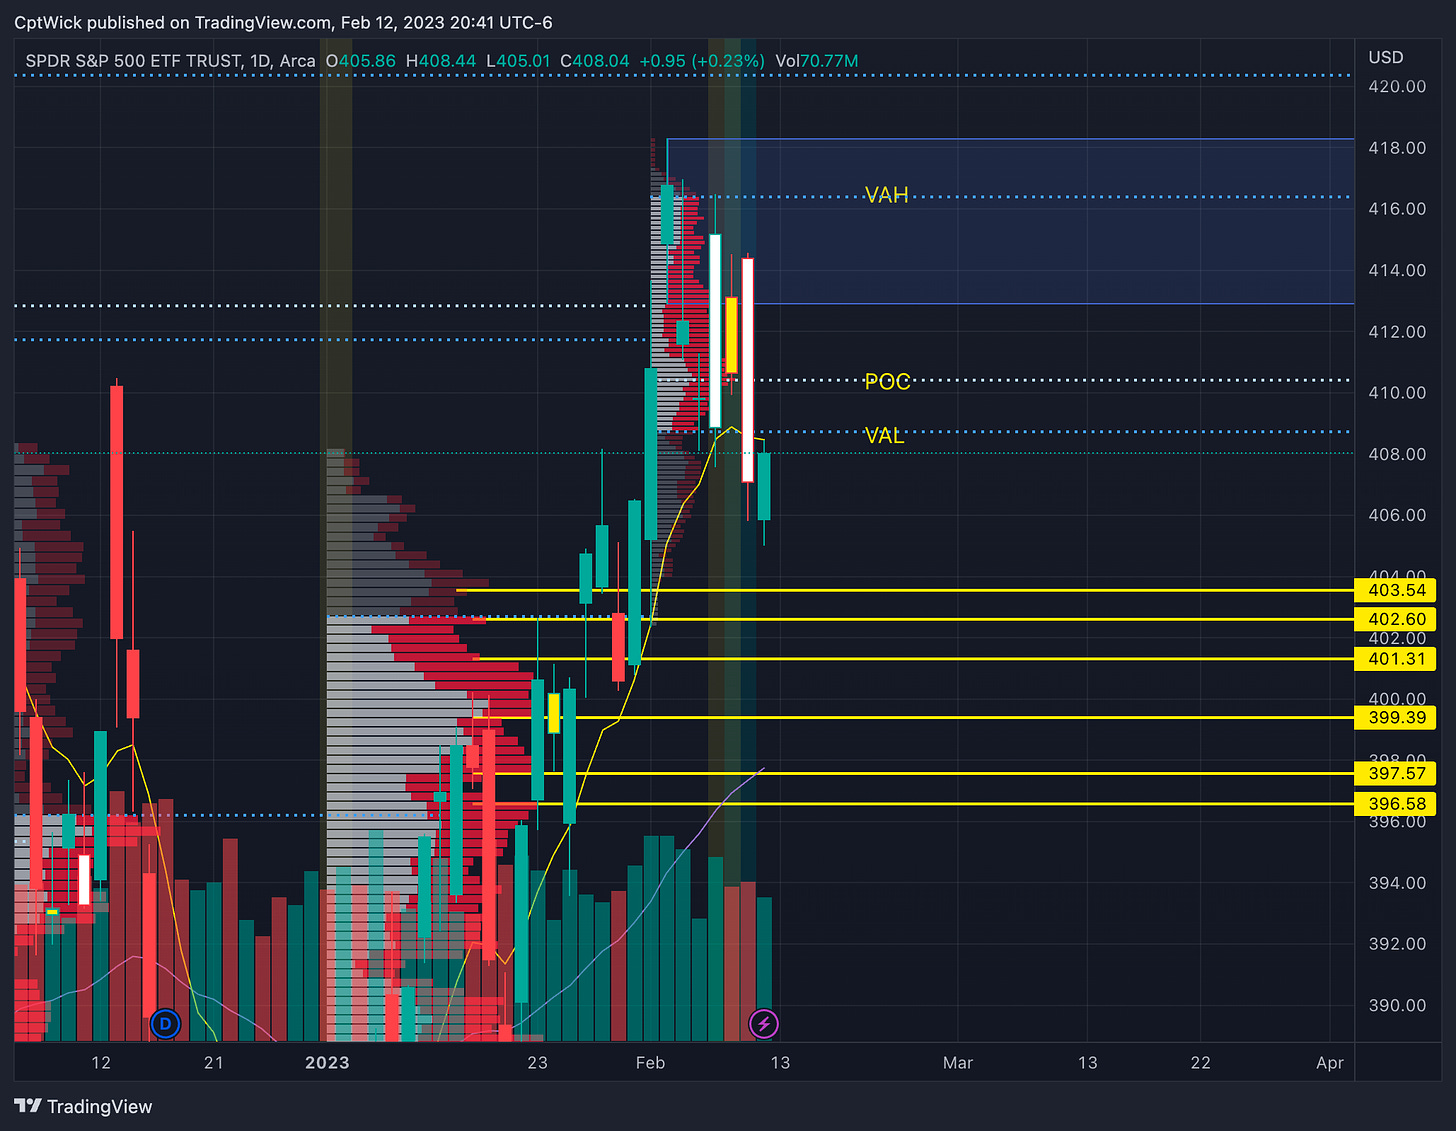
As we reviewed the volume profile, just as outlined in our Friday Plan, we noted that the VAL (Value Area Low), located around 408.75, would play a crucial role in determining price movement. This level will be a crucial reference point in the coming week. If the bulls are able to reclaim the VAL, our next objective would be to surpass the POC at 410.50, with the ultimate target being the VAH at 416. Ideally, this would be the bullish scenario. On the other hand, if the VAL is not regained and we fail to move above the POC, we may see a downward trend towards the range of 403.50-400, with potential support levels around 397-396.
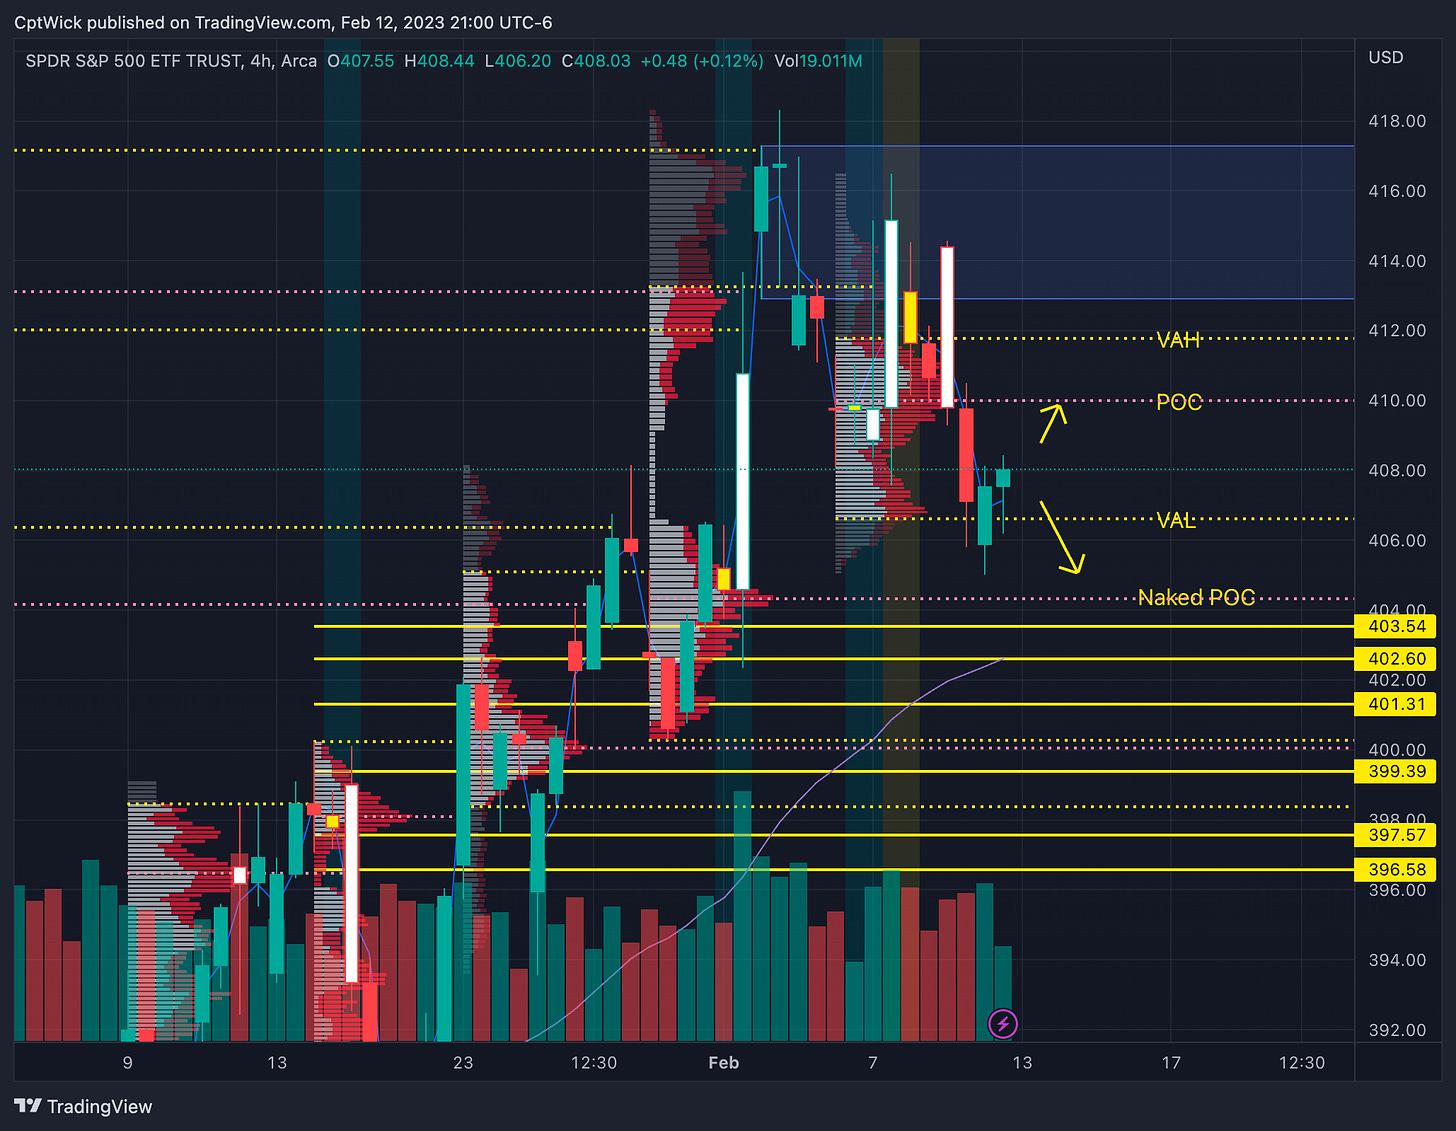
Focusing in even further, this 4-hour chart displays the weekly volume profile levels. It can be seen that the week closed inside the value area, with the close above the VAL at 406.60 but below the VAH at 411.75. The POC at 410 is not protected by any nearby price levels, and there is an earlier naked POC at 404.40 beneath the current value area. Provided that 406.60 holds, I would expect to see a resurgence to 410, followed by 411.75. However, if 406.60 fails to hold, a test of the levels at 404 or below may be necessary.
Now let’s jump into the Volland data to see what is going on at these levels so we can formulate a plan.
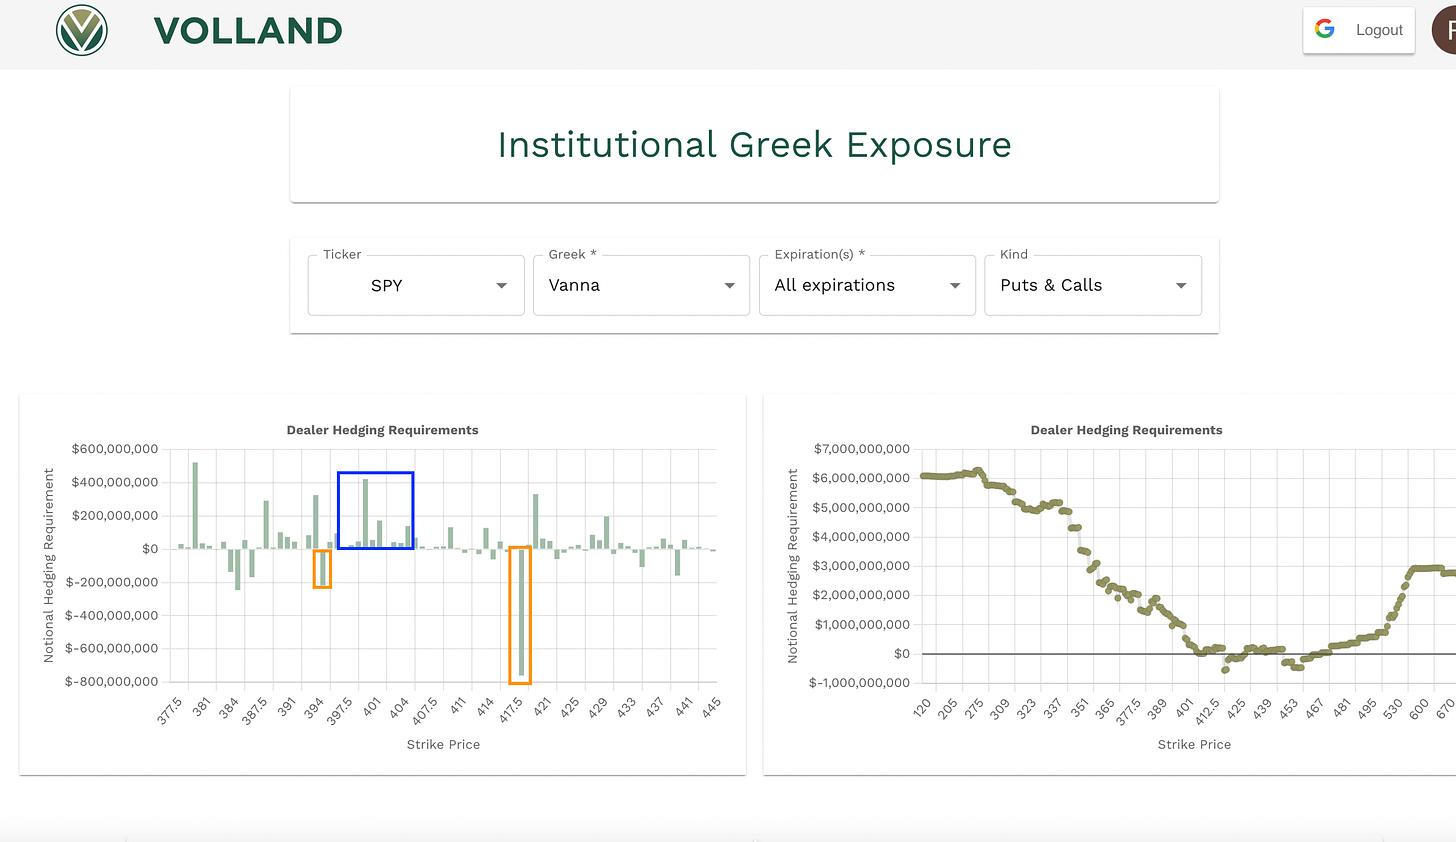
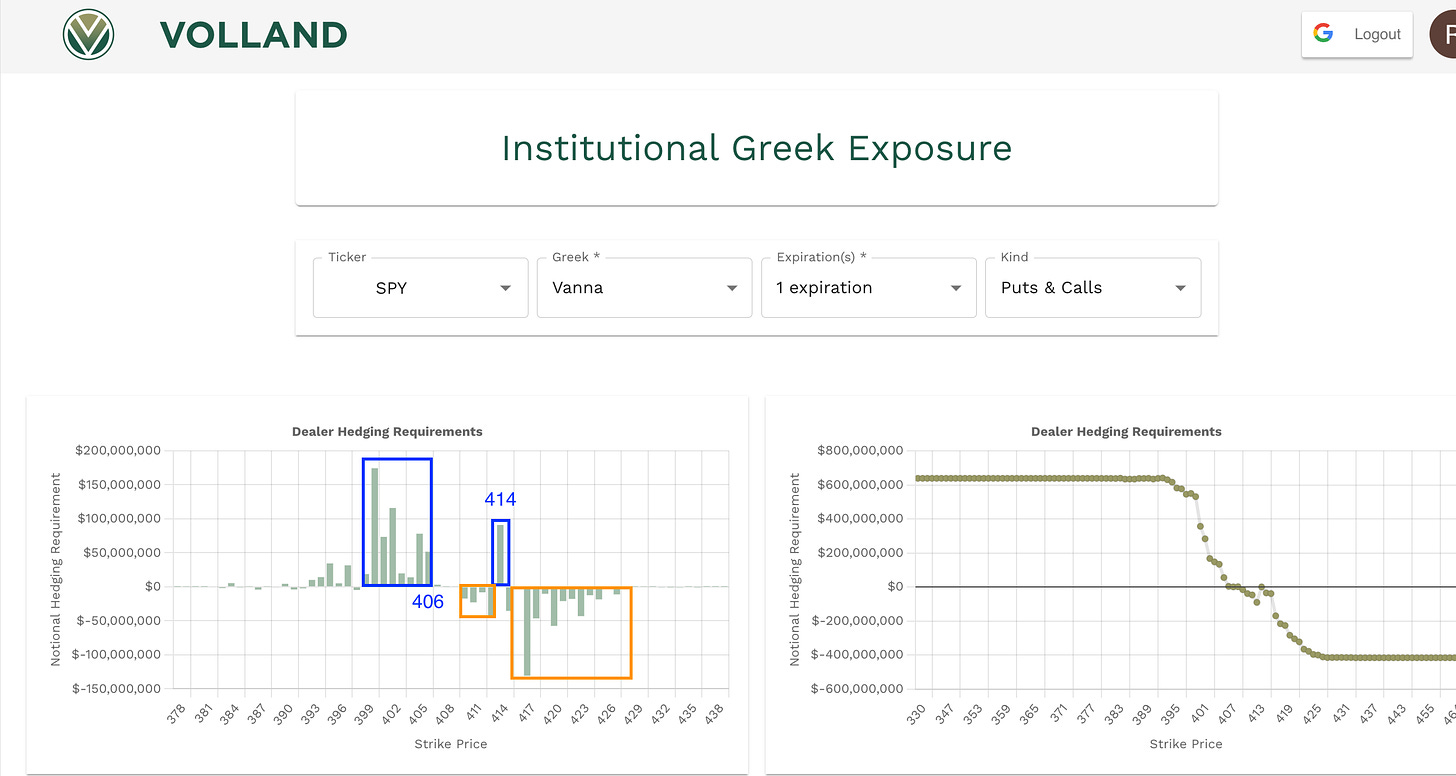
The aggregate chart continues to reflect a similar trend. There is a significant downward bar at 418 and a negative vanna at 395. However, there is also a cluster of positive vanna between 406 and 396.
It's important to remember that negative vanna above the current spot acts as a barrier, or resistance, while negative vanna below the current spot acts as support. On the other hand, positive vanna acts as an attractor.
This raises the question, will we see a move to 400 tomorrow due to the larger positive bar? The answer is not necessarily, but it is possible given all relevant factors.
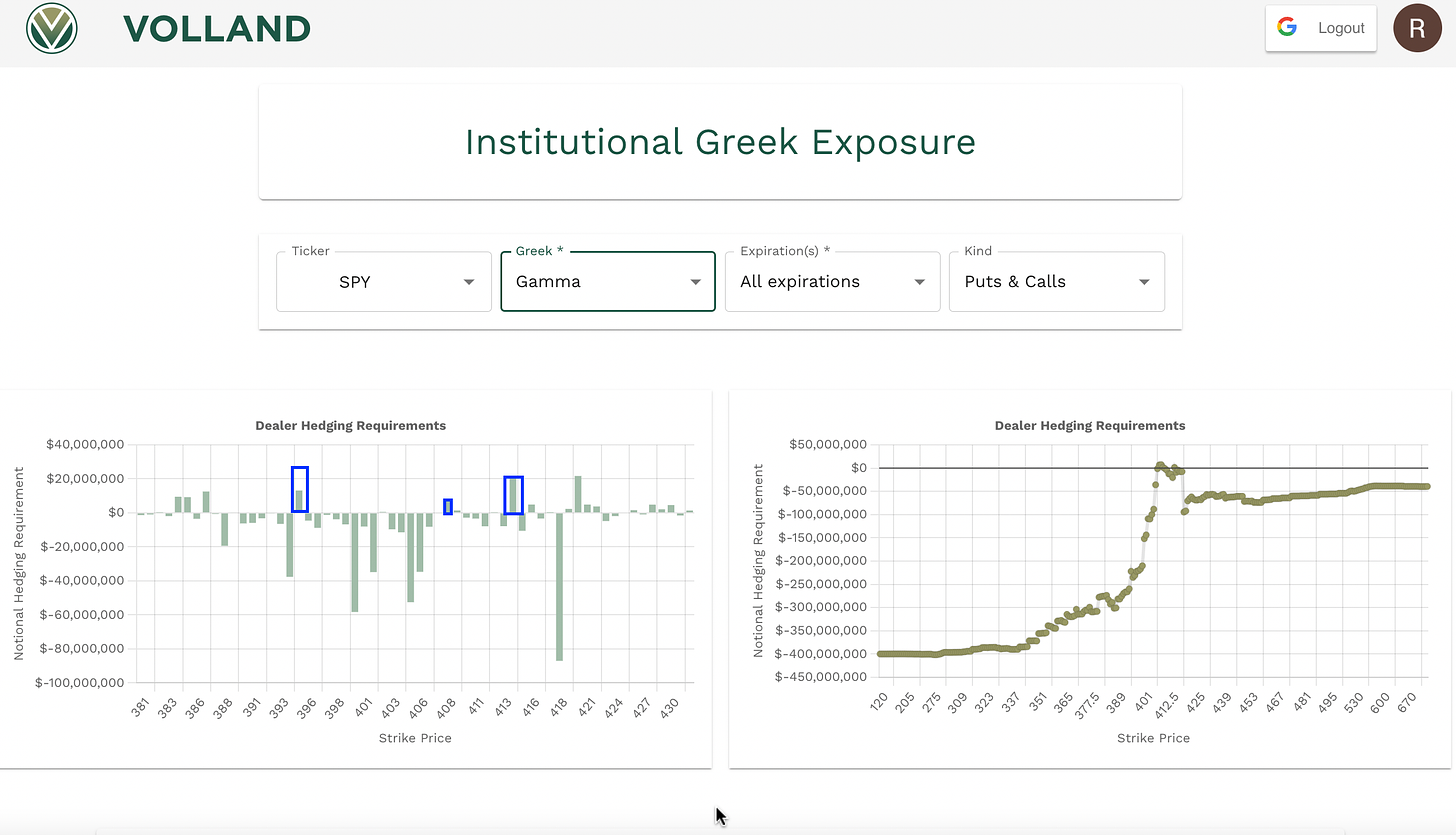
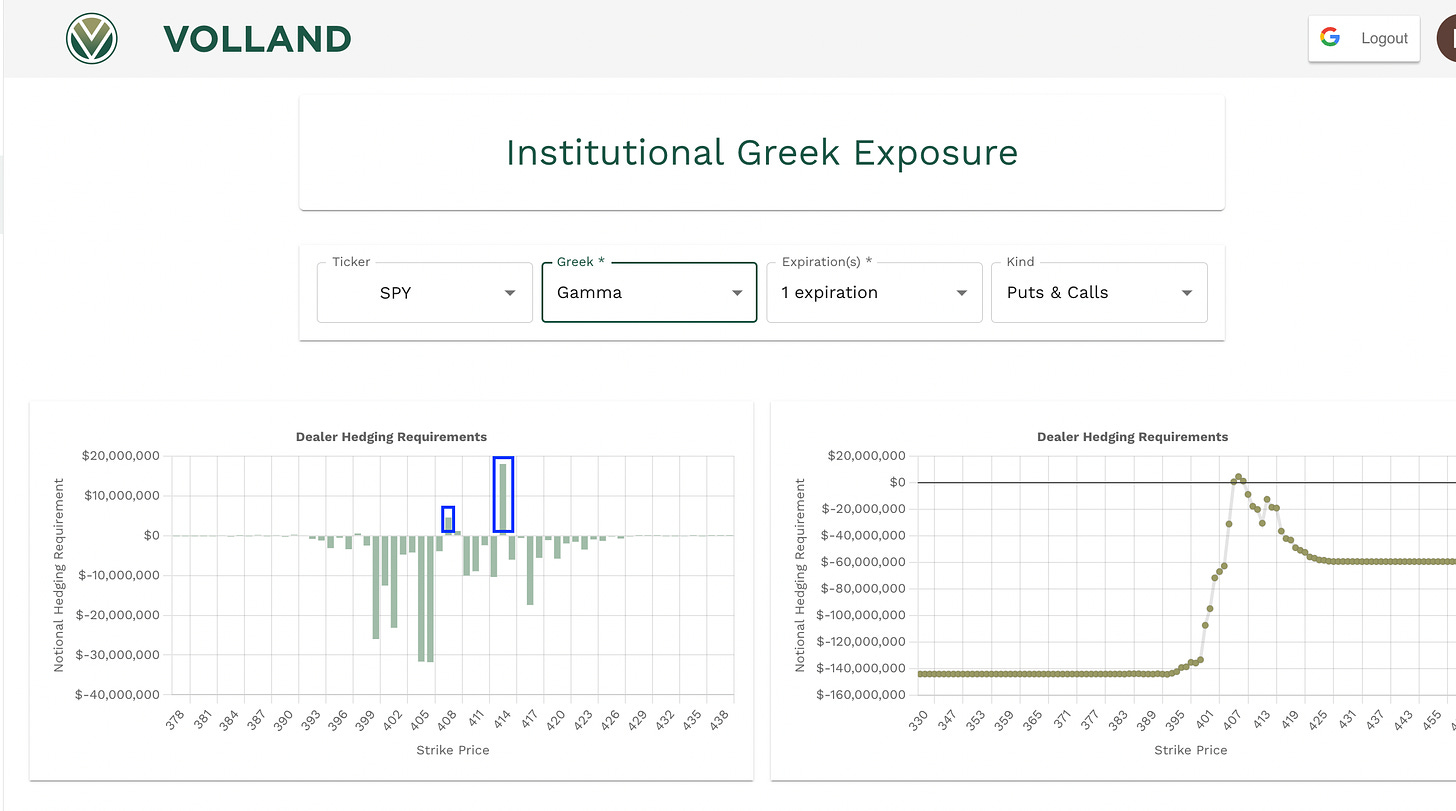
If we examine the aggregate gamma levels, the levels of significance are 395, 408, 414, and possibly 420. These are the levels where positive gamma is present and they are likely to act as both support and resistance until they are breached.
It's also worth mentioning the negative gamma at 418, which is coincidentally the same level as the negative vanna. In the event of a sudden decrease in Implied Volatility (IV), reaching 418 could present a potential opportunity for a volatility squeeze that propels the price over the 420-423 range.
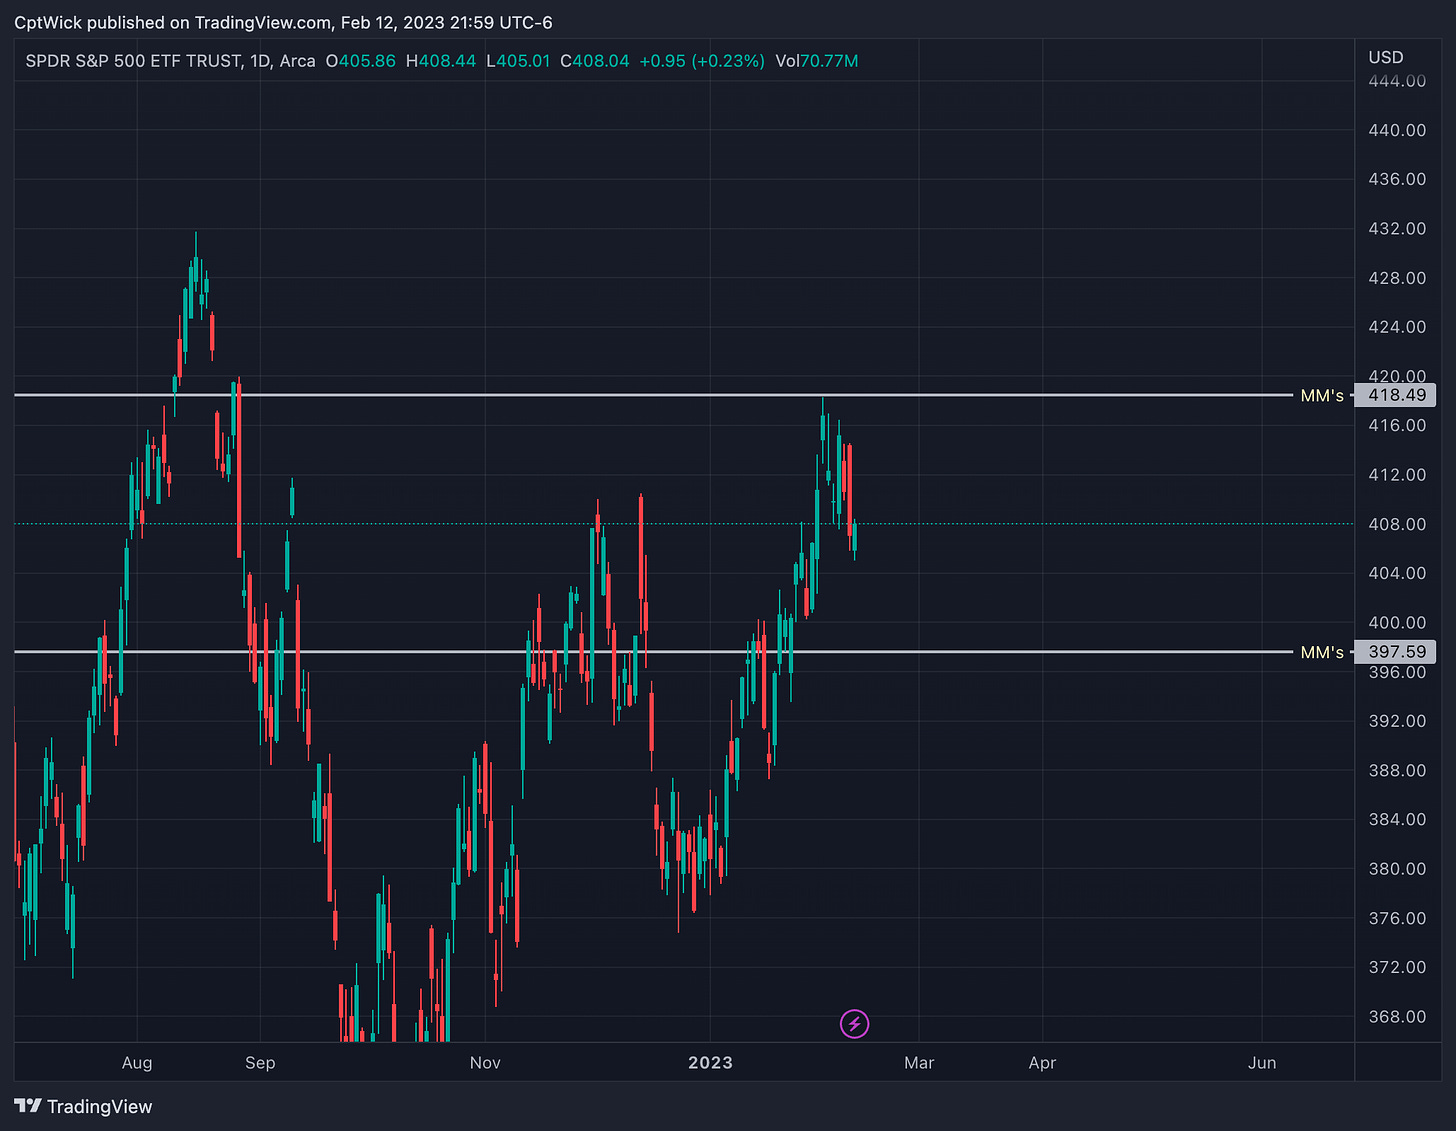
Finally, before we outline the critical weekly levels, let's take a look at the market makers' expectations for the move on Friday, February 17th. According to their calculations, the expected move is +- 10.45. With the close on Friday at 408.04, the estimated move to the upside is 418.49 and to the downside is 397.59.
—WEEKLY PLAN—
On the week I think that the bulls need to get back over 410 I want to target the upper side of the range I think that we will run into resistance at 412, 415, and 418, with a possible overshoot into 420-423. Remember, we have CPI on Tuesday, so it is hard to say what is likely going to happen. I am not going to predict up or down, but I want to try and weigh all possible outcomes. If we cannot get over 410 I think that 403-400 will be a likely target. Under 400 I think we could get down into 396-395. All of these volume profile areas and all of the data on Volland is suggesting that we stay between 395 and 418.
—2/13 Pre Plan—
Let's move on to the plan for trading on Monday, February 13th. A good place to start is by reviewing the vanna on the 1-day to expiration chart.
Given the close of 408.04, we can see that the chart exhibits positive vanna at 414, with a larger cluster between 406 and 395, with the majority of the data concentrated at 400. Meanwhile, negative vanna is present between 410-413 and from 415 upwards.
It's also worth noting the vanna gap between 407 and 409. To determine what might occur in this area, we need to examine the gamma levels.
The positive gamma at 408 marks it as a crucial level, and the presence of positive gamma at 414 is also noteworthy. However, it's important to remember that the 414 strike also has negative vanna, which could make it a challenging level to overcome.
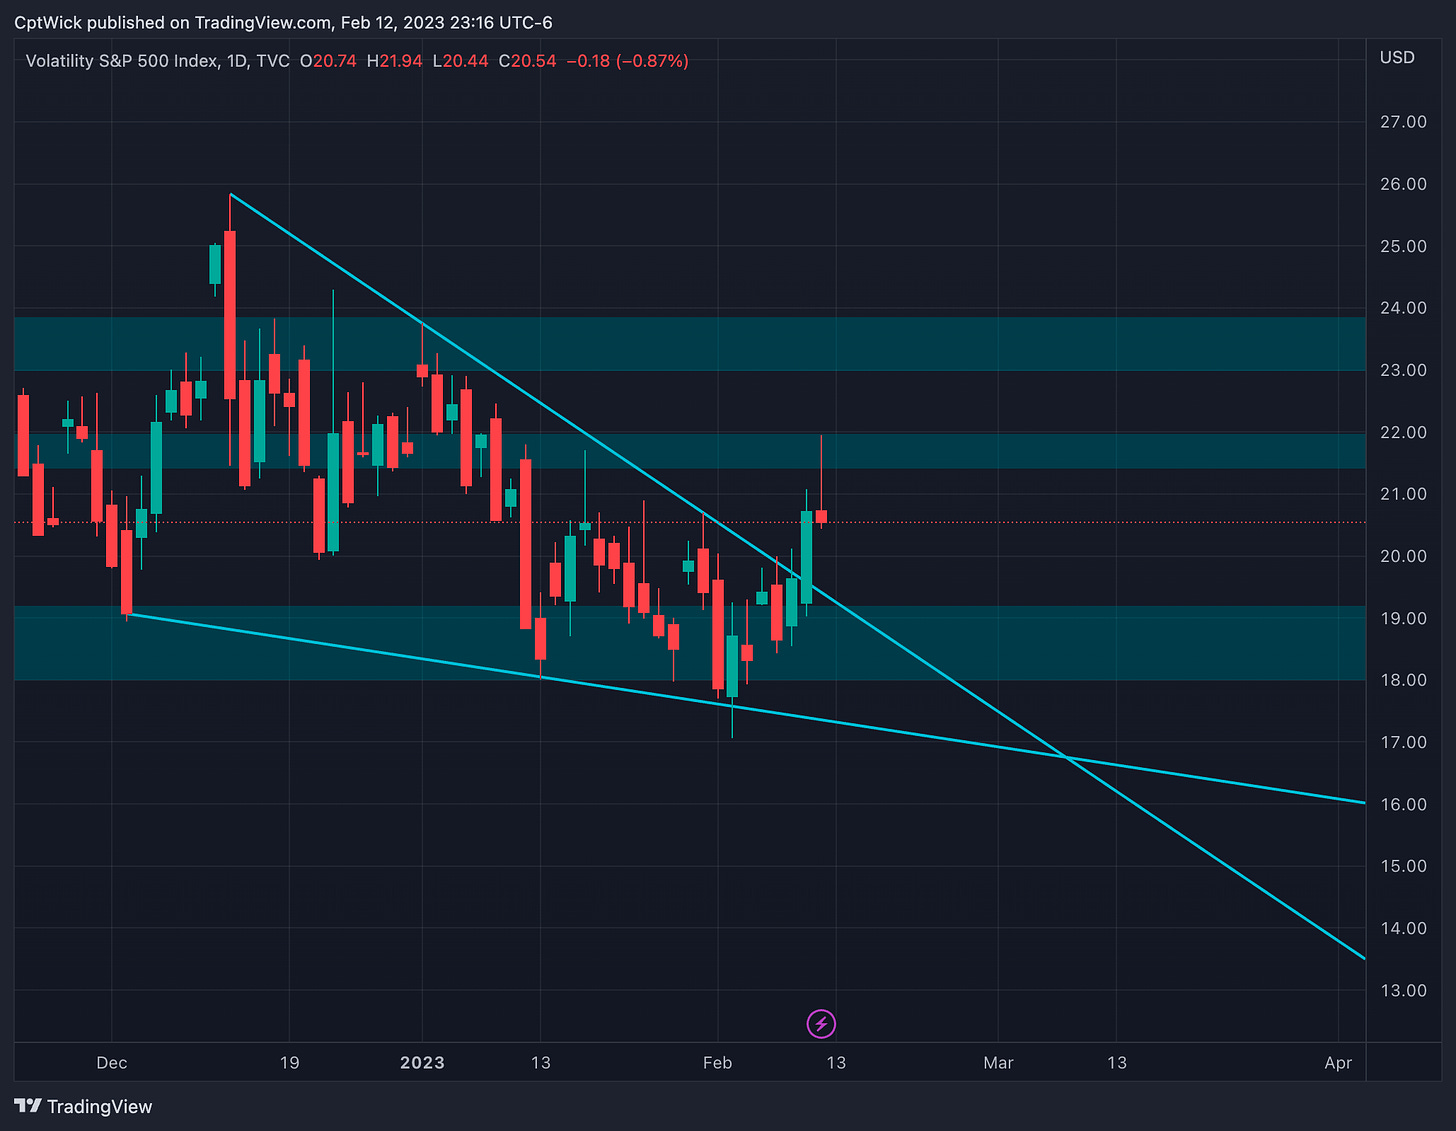
We talk a lot about the VIX on this page, that is because VIX is crucial to our analysis. With that being said, I want to note a few things I am seeing on its chart
If you are bullish on the VIX, the inverted hammer after a recent breakout may be cause for concern. This could indicate that a retest is likely, but it is not possible to make a prediction with certainty. Keeping a close eye on both the VIX and SPY will be key in trying to gain insight into what the future holds.
—2/13 Trade Plan—
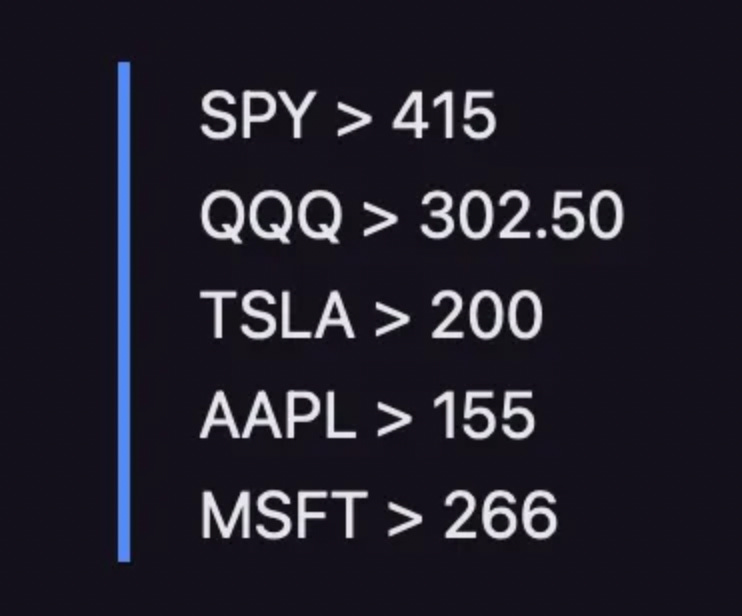
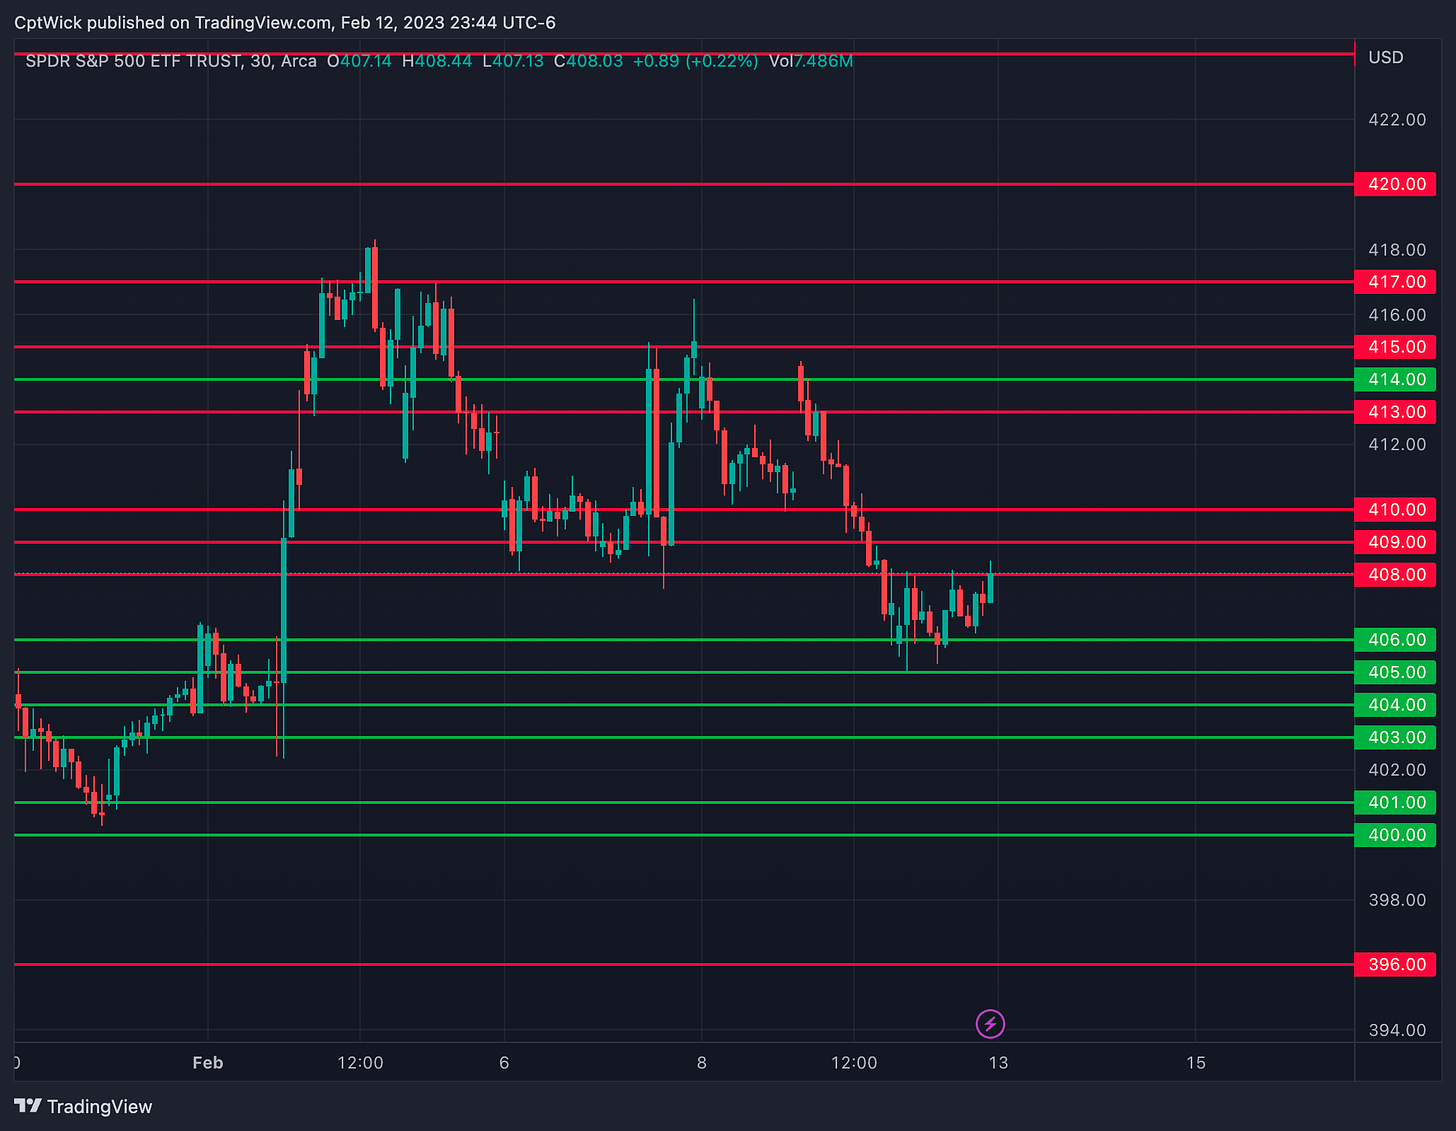
With Friday's close at 408.04, our focus is set on the key level of 408, which we identified in our pre-plan. In the event of a decline below 408, our targets are 406, then 403-400. Conversely, if the SPY rises above 408, we anticipate a push towards 414, encountering resistance at 410, 411.50, and 413. To maintain a bearish outlook, it's vital for the VIX to sustain its recent breakout. An increase above 22 would increase the likelihood of SPY reaching 400. On the other hand, if VIX retests its breakout, the SPY may rise towards 414-415. Please exercise caution with Tuesday's Consumer Price Index release, as it could result in significant market volatility that could exceed these levels. Maintain a responsible position size and ensure that you have an exit strategy for any trades. Good luck this week! I will send daily updates each night prior to the cash session.
Above 408, target 410 and I think there is a potential to see 414-415.
Below 408, target 406, under 406 I think we can go 403-400.
Happy Trading,
—WICK—
To cover our basis…
Welcome to my Substack where I provide a daily SPY trading plan to help guide my intraday trading. The purpose of this letter is not to advice you on your trading or investment decisions. I am simply documenting my daily trading plan for myself to help with planning and execution. These are simply my opinions and the data sourced from the likes of vol.land, TradingView, Tradytics and others. The stock market is risky, gains are not guaranteed. This is not about getting rich quick, but learn to educate yourself and make the necessary financial decisions on your own. This is not financial advice.





That is correct
there are too many levels to follow with little gap in between. Believe the takeaway for 2/13 from this blogpost is
Above 408, target 410 and I think there is a potential to see 414-415.
Below 408, target 406, under 406 I think we can go 403-400.
Is that correct?